

TL;DR: The Four Costs of Bad Pricing
- Direct Revenue Loss: 11-17% of current ARR left on the table from mispricing alone. At $5M ARR, that is $550,000 to $850,000 per year.
- Customer Quality Tax: Price-sensitive customers demand the most support, churn fastest, and provide the fewest referrals. Track support tickets per customer by pricing tier to quantify it.
- Growth Ceiling: Low margins prevent investment in product, marketing, and talent. Companies that adjust pricing annually grow 20-30% faster.
- Revenue Leakage: 3-10% of ARR lost to billing errors, unapproved discounts, contract mismatches, and failed collections.
The Diagnosis: A Real Revenue Leakage Example
Consider a real scenario from a B2B SaaS company that InfluenceFlow documented. The company was generating $8M in ARR with a pricing model based on per-seat licensing. They had not reviewed their pricing in 18 months.
Their close rate on qualified leads was 42%, and their customers regularly described the product as a "no-brainer at this price."
The numbers told a different story. A pricing audit revealed 3 specific leakage points:
- Their base price was approximately 35% below customer willingness-to-pay, costing roughly $980,000 per year in direct lost revenue.
- Their lowest tier attracted 60% of sign-ups but generated only 15% of revenue, while consuming 45% of support capacity.
- Unapproved sales discounts and grandfathered legacy accounts created a 4% revenue leakage on top of the mispricing, worth another $320,000 per year.
The total annual cost of bad pricing on an $8M ARR base — 16.25% of revenue disappearing every single year.
This is not an edge case. Price Intelligently and ProfitWell found that 80% of SaaS startups underprice by 30-60% (Athenic).
The default state for SaaS pricing is underpriced. The question is not whether you are leaving money on the table. The question is how much and how long it has been compounding.
Cost 1: The Direct Revenue Loss
The direct revenue loss is the most visible cost of bad pricing, and it is also the easiest to quantify. If your company generates $1M in ARR and your pricing is mispriced by 11-17%, which is the McKinsey and Price Intelligently range, you are leaving $110,000-$170,000 per year on the table with zero additional features, marketing campaigns, or hires (Dev.to).
Here is a worked example using a typical early-stage SaaS company with 200 customers at $49 per month. The correction is a conservative 15% increase.
| Metric | Current | Corrected | Difference |
|---|---|---|---|
| Customers | 200 | 200 | — |
| Monthly price | $49 | $56 | +$7 |
| Monthly revenue | $9,800 | $11,200 | +$1,400 |
| Annual revenue | $117,600 | $134,400 | +$16,800 |
That is $16,800 in additional annual revenue from a $7 per month price correction. No new product work. No new sales hires. No new marketing budget. The revenue appears immediately because the value was always there — you were just not capturing it.
The Scale of the Problem at Higher ARR Levels
The same percentage scales dramatically at higher ARR levels. Here is what a 15% pricing correction looks like across typical SaaS company sizes.
| Current ARR | 15% Correction | Annual Gain |
|---|---|---|
| $1,000,000 | $150,000 | $150,000 |
| $5,000,000 | $750,000 | $750,000 |
| $10,000,000 | $1,500,000 | $1,500,000 |
| $50,000,000 | $7,500,000 | $7,500,000 |
At $5M ARR, a 15% correction funds an entire senior engineering hire. At $10M ARR, it funds a content marketing program that could 3x your pipeline.
Why Do Not More Companies Raise Prices?
85% of SaaS companies did not raise prices in the past 6 months despite an inflationary environment (Blue Ridge Partners). Among those that did, the average increase was 7.6% — and zero companies reported their price increase as unsuccessful.
The root causes come down to three factors.
- Lack of pricing expertise: The average company spends just 8 hours on pricing over its entire lifecycle (GenesysGrowth). 8 hours. That is less time than most teams spend on a single sprint retrospective.
- Fear of churn: Founders worry that raising prices will trigger mass cancellations. But companies that raise prices by 10-15% see only modestly more customer pushback than smaller increases.
- Competitor anchoring: Founders price against competitors who are themselves mispriced, which creates a race to the bottom where nobody captures their true value.
How to Know If You Are Underpricing
There are 3 diagnostic tests that will tell you immediately whether your pricing is too low. Run all three and look for converging signals.
- The close rate test: If you are closing more than 30-40% of qualified leads, your price is not filtering. A correctly priced SaaS product closes 25-30% of qualified leads. Above 40%, you are leaving money on the table because your price is too low to create appropriate friction.
- The customer language test: If customers describe your product as a "no-brainer" or "so cheap," you are underpriced. The target language is "worth it" or "fair price." "No-brainer" means the price does not match the value.
- The value capture test: Calculate the economic value your product delivers per customer. If you are capturing less than 10-12% of that value in your price, you are underpriced.
Cost 2: The Customer Quality Tax
Here is the cost of bad pricing that nobody talks about. Low prices attract the wrong customers.
Price-sensitive customers are, on average, your worst customers. They demand the most support, complain the most loudly, provide the fewest referrals, and churn the fastest.
Low prices do not eliminate price objections — they just shift the objection from "this is too expensive" to "this does not do enough for the price" (Gatilab).
The Infrastructure Breakdown Problem
Consider two pricing models that generate identical revenue on paper. The unit economics tell a very different story.
| Model | Price | Customers | Monthly Revenue |
|---|---|---|---|
| A | $200 per month | 100 | $20,000 |
| B | $20 per month | 1,000 | $20,000 |
Same revenue. But Model B requires 10x the infrastructure, 10x the support capacity, and 10x the billing complexity. At scale, Model B unit economics break because the cost to serve 1,000 customers at $20 per month exceeds the cost to serve 100 customers at $200 per month. Support costs do not scale linearly with revenue (Gatilab).
A lower-priced company needs 50% more customers for the same ARR as a correctly priced competitor — which means 50% more support tickets, billing inquiries, onboarding friction, and churn risk, all for the same top-line number (BB Financials).
The Signal Effect
Price is a quality signal. A buyer evaluating a $19 per month tool and a $79 per month tool will make different assumptions about what each product delivers — even if the features are identical.
The $19 per month buyer expects basic functionality and minimal support. The $79 per month buyer expects premium outcomes and is willing to invest in the relationship.
Low prices do not just reduce revenue. They reduce perceived value (Dev.to). This is why 67% of B2B tech buyers prefer vendors with clear positioning and specialized expertise, even at higher prices (Gartner, via Sproutworth).
The customer quality tax compounds over time. Every price-sensitive customer you acquire at a low price increases your support costs, depresses your margins, and accelerates your churn. The revenue loss is visible. The customer quality tax is invisible until you try to scale.
Cost 3: The Growth Ceiling
The third cost of bad pricing is the one that compounds over years. Low margins prevent reinvestment.
When your pricing is too low, your margins are too thin. When margins are thin, you cannot afford to hire the senior engineer who would 10x your product velocity. You cannot invest in the content marketing program that would 3x your pipeline. You cannot build the customer success team that would reduce churn by 30%.
This is the growth ceiling. It is invisible at $1M ARR. At $5M ARR, it becomes a nagging frustration. At $10M ARR, it is a strategic crisis — and the only way out is a pricing redesign that requires rebuilding your entire billing infrastructure.
The Compounding Effect
Best-practice pricing initiatives deliver 15% or more revenue growth on average (Blue Ridge Partners). Companies that adjust pricing annually grow 20-30% faster than those that do not (PipelineRoad). The gap between companies that price strategically and companies that price reactively widens every single year.
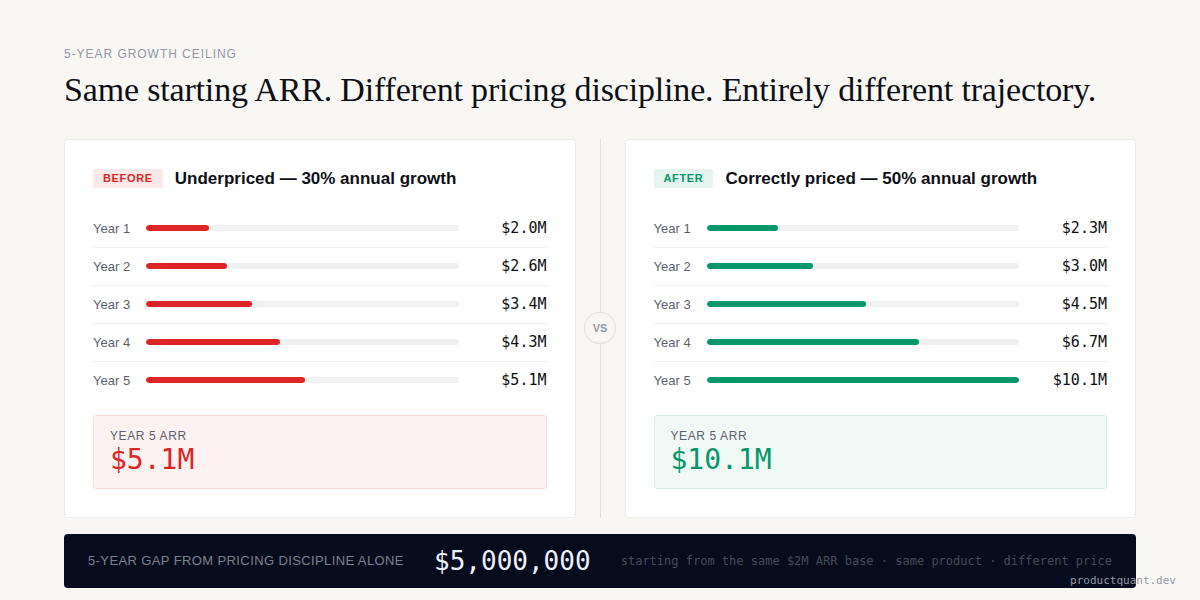
Consider a company at $2M ARR with thin margins due to underpricing. They cannot hire a VP of Sales at $200,000. They cannot fund a demand generation program at $150,000 per year. They grow at 30% organically, reaching $2.6M in year 2.
Meanwhile, a competitor with correct pricing at $2M ARR captures an additional 15% ($300,000) in revenue. They hire the VP of Sales. They fund the demand gen program. They grow at 50%, reaching $3M in year 2. The gap is $400,000. In year 3, the gap widens further.
By year 5, the correctly priced company reaches $10.1M ARR. The underpriced company reaches $5.1M. The growth ceiling is not a single event — it is a slow constriction that becomes visible only when it is too late to fix without a painful overhaul.
The Infrastructure Lock-In
Pricing decisions set in motion a cost structure that is hard to reverse (City Shift Finance). Bad pricing at $1M ARR still affects unit economics at $10M. Every customer acquired at a mispriced rate creates a legacy account that cannot be easily corrected. Every sales rep trained on the wrong pricing model builds a pipeline of prospects who expect the wrong price.
The longer you wait to fix pricing, the more expensive the fix becomes. Companies that wait until they are forced to fix pricing pay a much higher cost: re-engineering billing systems, retraining sales teams, and managing customer backlash from a large catch-up increase instead of a series of small, planned adjustments.
Cost 4: The Revenue Leakage Multiplier
Bad pricing does not just lose revenue at the point of sale. It compounds through your entire quote-to-cash process.
4-10% of annual SaaS revenue is lost to revenue leakage — billing errors, unapproved discounts, misconfigured CPQ data, duplicate CRM records, and compliance failures (XFactrs). For a $500M subscription business, that is up to $35 million per year lost to billing and quoting misalignment alone.
Under-discounting by just 2% across 5,000 enterprise customers leaves $10 million or more in unearned revenue on the table, compounding over recurring contracts (XFactrs).
This is not a pricing strategy problem. It is a pricing execution problem. And it is entirely preventable.
The Revenue Leakage Formula
The total cost of bad pricing follows a multiplicative pattern, not an additive one. Here is the formula and how to calculate each component.
- Direct Revenue Loss: Current ARR multiplied by the pricing gap percentage, which is typically 11-17% for most SaaS companies.
- Customer Quality Cost: Incremental support cost per low-price customer multiplied by the number of price-sensitive customers, typically 60% or more of the base on a mispriced model.
- Growth Ceiling Cost: The difference between actual growth rate and achievable growth rate with correct pricing, multiplied by ARR, compounded over the number of years the mispricing has persisted.
- Revenue Leakage: 3-10% of ARR from billing errors, unapproved discounts, contract mismatches, and failed collections (Zenskar).
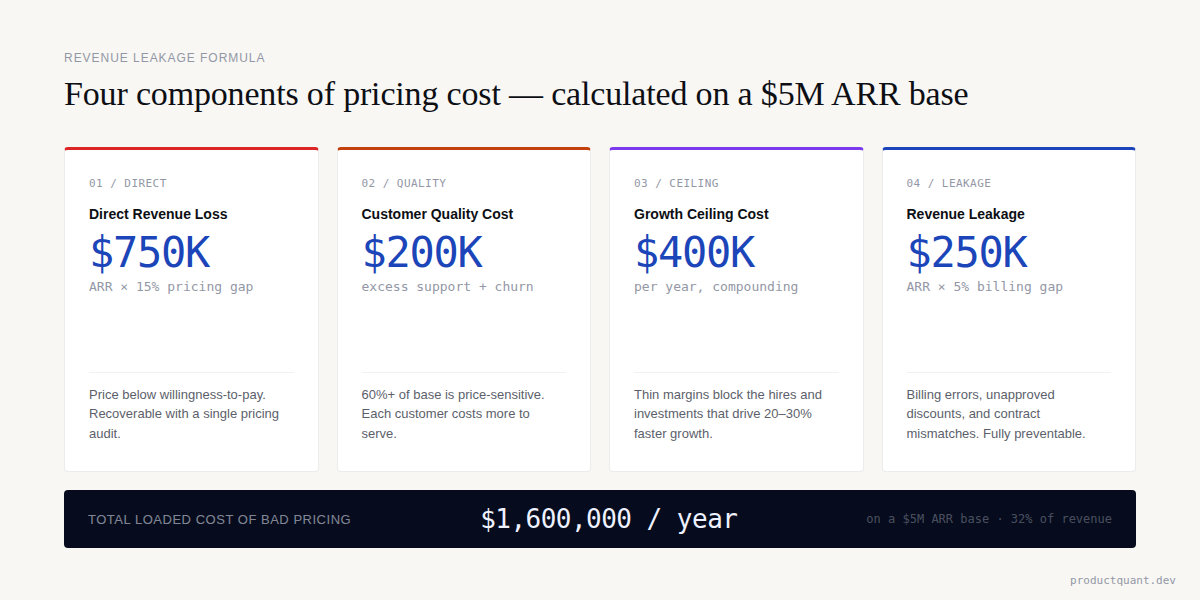
For the $8M ARR company in our opening diagnosis: $980,000 in direct revenue loss, $200,000 in excess support costs from price-sensitive customers, and $320,000 in billing and discount leakage — fully loaded.
Payment Failure and Involuntary Churn
Payment failures and involuntary churn account for as much as 40% of lost subscribers and significant annual revenue leakage (Kaplan Collection Agency). When pricing is misaligned with customer value, even small payment friction points become churn triggers.
Customers who feel they are getting fair value tolerate occasional billing issues. Customers who feel overcharged for what they receive use a failed payment as an excuse to exit.
SaaS companies lose 1-5% of revenue to billing errors, contract mismatches, and failed collections (Zenskar). Companies with integrated contract-to-cash automation can reduce this leakage below 1% (LedgerUp AI). The gap between 5% and 1% on a $10M ARR company is $400,000 per year — recovered without changing the product or acquiring a single new customer.
How to Fix It: The 4-Step Price Increase Execution
If you have confirmed you are underpriced through the diagnostic tests above, here is the fastest path to correction. The framework is designed to maximize revenue recovery while minimizing churn risk.
Step 1: Quantify Your Value
Calculate the economic value your product delivers per customer. Measure hours saved multiplied by hourly rate, revenue generated, or costs avoided. This is your pricing ceiling. If you are capturing less than 10-12% of that value, you have significant room to increase.
A logistics SaaS that prevents 50 routing errors per month at $340 per error saves its customers $17,000 per month. Pricing that solution at $2,000 per month captures only 12% of the value delivered. That is actually a well-priced product — but most SaaS companies capture far less.
The optimal pricing range captures 10-30% of the total economic value delivered to the customer (Sproutworth).
Step 2: Test on New Customers Only
Raise prices 10-15% for new signups. Monitor conversion, close rate, and trial-to-paid for 30 days. If your close rate drops from 40% to 28%, you are still in the healthy range — and your revenue per customer just increased materially (Dev.to).
94% of SaaS companies update pricing annually, and 40% or more tweak quarterly (SBI Growth). Testing on new customers isolates the price variable from the retention variable. You can see exactly how the market responds without risking existing revenue.
Step 3: Grandfather Existing Customers
Keep existing customers on their current pricing for 3-6 months as a transition window. This buys goodwill, prevents sticker-shock churn, and gives you time to communicate the value behind the increase (Dev.to).
Grandfathering is not optional. It is the single most important retention lever during a price increase. Give customers 30-45 days advance notice and consider phased rollouts starting at 10%, moving to 30%, and finishing at 60% of the target increase.
For the complete playbook on grandfathering strategies and communication templates, see our complete guide on raising prices.
Step 4: Bundle With a Feature Launch
Do not raise prices in a vacuum. Bundle the increase with a meaningful feature launch, security certification, or product improvement. 73% of customers accept a price increase when it is tied to clear product improvements (WinSavvy).
The difference between a successful price increase and a failed one is not the magnitude of the increase. It is the quality of the communication that accompanies it.
Real Company Pricing Mistakes and Recoveries
Companies that fix their pricing recover dramatically. Here are documented examples from the market.
New Relic: From Per-Host to Consumption
New Relic built its business on per-host pricing, which worked well when customers monitored a small number of servers. As the product expanded to 13 different monitoring tools, the per-host model discouraged customers from adopting the full platform. The result was a 29% stock drop and accelerating churn.
The fix was a complete pricing redesign. New Relic consolidated 13 products into one unified consumption-based model: $0.25 per GB of data ingested plus user seats, with a 100 GB per month free tier. The initial transition caused a short-term ARR dip. But churn decreased significantly, account-level expansion increased, and the company successfully completed its public transition to consumption pricing by 2021.
The mistake was pricing infrastructure based on the vendor's cost model instead of the customer's value model.
SAP: From Perpetual Licensing to RISE Subscription
SAP's traditional model involved complex perpetual licensing, separate infrastructure negotiations, and lengthy sales cycles. Enterprise buyers faced a procurement process that took months and required separate contracts for software, hosting, and support.
The RISE with SAP offering shifted to a fixed annual subscription that bundles ERP software, cloud hosting, and technical support into one contract. By 2023, SAP cloud revenue reached 13.64 billion euros annually, representing 45% of total revenue.
The mistake was pricing each component separately, which created friction at every touchpoint. The recovery came from bundling into a single predictable price.
RevOps SaaS: From Feature Tiers to Journey Tiers
A revenue operations SaaS company restructured its pricing tiers from a feature-based model ($99, $299, custom) to a journey-based model ($499, $1,999, $4,999). The feature tiers mapped to product capabilities, which meant 80% of customers converged on the middle tier — a classic cannibalization problem.
The journey tiers mapped to customer maturity stages: startup, scaling, and enterprise. Conversion increased by 40% compared to the feature-based industry average of 2-3%. The average contract value nearly tripled.
The mistake was pricing around what the product does instead of pricing around what the customer is trying to achieve.
Climate Tech SaaS: From Broad to Focused
A climate tech SaaS company was serving both SMB and enterprise customers with the same pricing structure. SMB customers were generating 40% of sign-ups but only 8% of revenue, while consuming 55% of support capacity. The company dropped the SMB tier entirely and repositioned for enterprise buyers.
Revenue per customer jumped from $800 per month to $15,000 per month. Total revenue increased 3x despite serving fewer customers.
The mistake was trying to serve two completely different buyer profiles with one product. The recovery came from choosing margin over volume and building the product around a single high-value customer profile.
FAQ: The Cost of Bad Pricing
How do I know if I am underpriced or if my product is just cheap?
There is a difference. A cheap product delivers high value at a low price — think of the Stripe pay-as-you-go model. An underpriced product delivers high value but the price does not reflect it. Customers say "no-brainer" instead of "worth it." Use the 3 diagnostic tests from this article: close rate above 40%, customer language that signals a bargain, and a value capture ratio below 10%. If 2 or more of these signals are present, you are underpriced.
What is the maximum price increase I can implement without triggering mass churn?
Most SaaS companies can implement a 20-30% increase with minimal churn (Gatilab). For larger increases, grandfather existing customers and phase the rollout over 90 or more days. Bundle the increase with a meaningful feature launch or security certification to improve acceptance rates. Blue Ridge Partners found that zero companies reported their price increase as unsuccessful, even at increases of 10-15% or higher.
Is it ever smart to intentionally underprice?
Yes, in 4 specific scenarios. First, a land-and-expand strategy where an initial low ACV is a deliberate wedge into a larger account. Second, VC-funded market penetration where growth rate matters more than margin. Third, viral mechanics where network effects require broad adoption before monetization. Fourth, a learning phase where you are collecting willingness-to-pay data before setting a final price. In all 4 cases, underpricing should be a deliberate strategy with a defined timeline for correction — not a permanent state.
How much revenue do SaaS companies lose to bad pricing in total?
The total loss includes 4 components. Direct revenue loss of 11-17% of ARR from mispricing. Customer quality costs that add 10-20% in excess support and churn. Growth ceiling costs that compound at 20-30% slower growth annually. Revenue leakage of 3-10% of ARR from billing errors and contract mismatches. For a company at $5M ARR, the total loaded cost of bad pricing is approximately $1.2-1.8 million per year when all 4 components are calculated.
How often should we review and adjust our pricing?
60% of high-growth SaaS companies conduct quarterly competitive pricing reviews (ProfitWell, via InfluenceFlow). 94% of SaaS companies update pricing annually, and 40% or more tweak quarterly (SBI Growth). Companies that adjust pricing annually grow 20-30% faster than those that do not (PipelineRoad). The minimum standard is an annual pricing review. The growth standard is quarterly.
Sources
- GenesysGrowth — Complete SaaS Pricing Optimisation Guide
- InfluenceFlow — SaaS Pricing Strategy Complete 2026 Guide
- Sproutworth — The SaaS Pricing Strategy Mistake Costing You 6 Figures
- Chargebee — SaaS Pricing Strategy and Growth Mistakes
- Blue Ridge Partners — Current SaaS Pricing Is Leaving Money on the Table
- Zenskar — How to Identify and Avoid Revenue Leakage
- LedgerUp AI — Revenue Leakage in SaaS
- Athenic — SaaS Pricing Strategy Finding Your Sweet Spot
- Gatilab — Why Most SaaS Founders Undercharge
- Dev.to — How to Stop Leaving 11-17% of Your Revenue on the Table
- BB Financials — SaaS Pricing Strategy Financial Impact
- City Shift Finance — Software Pricing Decisions

About the Author
Jake McMahon builds growth infrastructure for B2B SaaS companies — analytics, experimentation, and predictive modeling that turns product data into revenue decisions. He has run pricing audits across multiple engagements, quantified revenue leakage in quote-to-cash processes, and helped companies recover millions in mispriced ARR. The cost analysis in this article is based on documented real-company scenarios and established pricing research. Book a diagnostic call to discuss your pricing strategy.