43 vs 88: What 60 Sales Calls Taught Us About Product Positioning
Founders claim their #1 differentiator. Buyers confirm it 43% of the time. The gap between what you say differentiates you and what actually wins deals is
ProductQuant · Insights
Frameworks, benchmarks, and signal intelligence for teams building past $1M ARR.
All posts — 386 pieces
Founders claim their #1 differentiator. Buyers confirm it 43% of the time. The gap between what you say differentiates you and what actually wins deals is
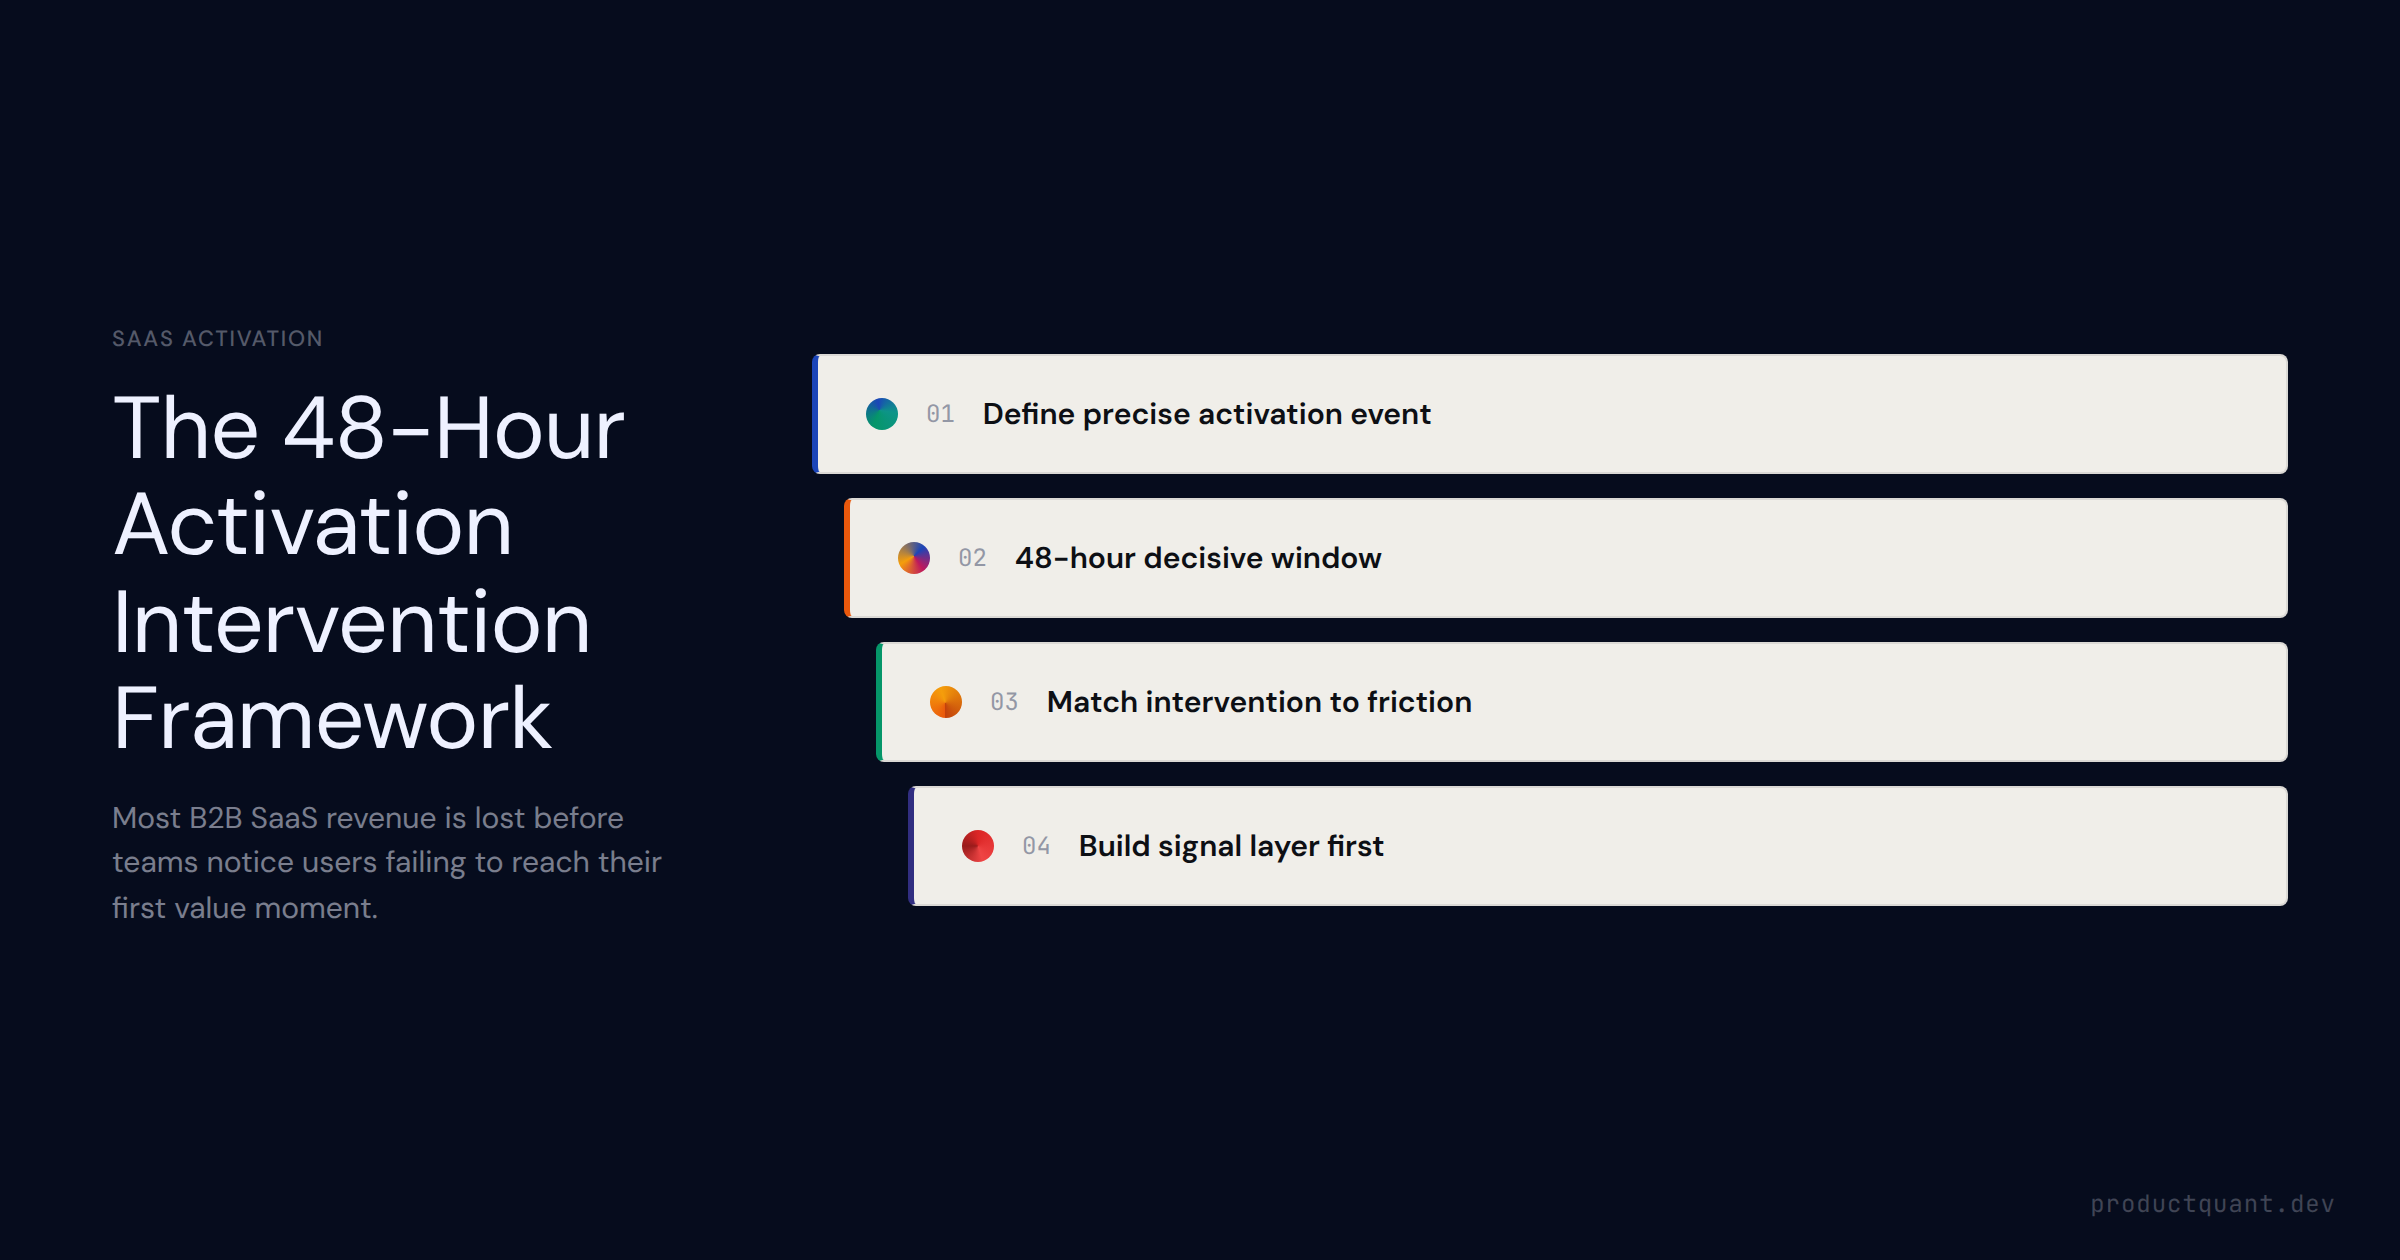
The 48-Hour Activation Window: Why Most SaaS Churn Is Decided in the First Two Days: practical ProductQuant guidance for SaaS growth teams improving...

Most SaaS teams have the data to understand their churn. They lack the structure to act on it. This sprint gives you a time-boxed path from raw subscriptio
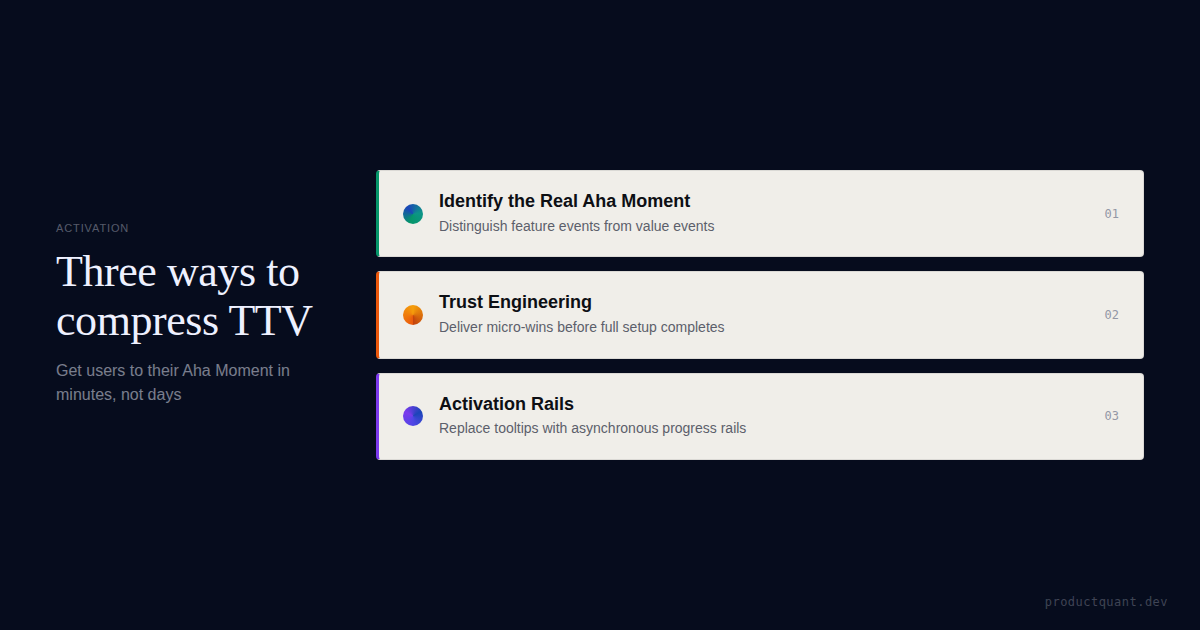
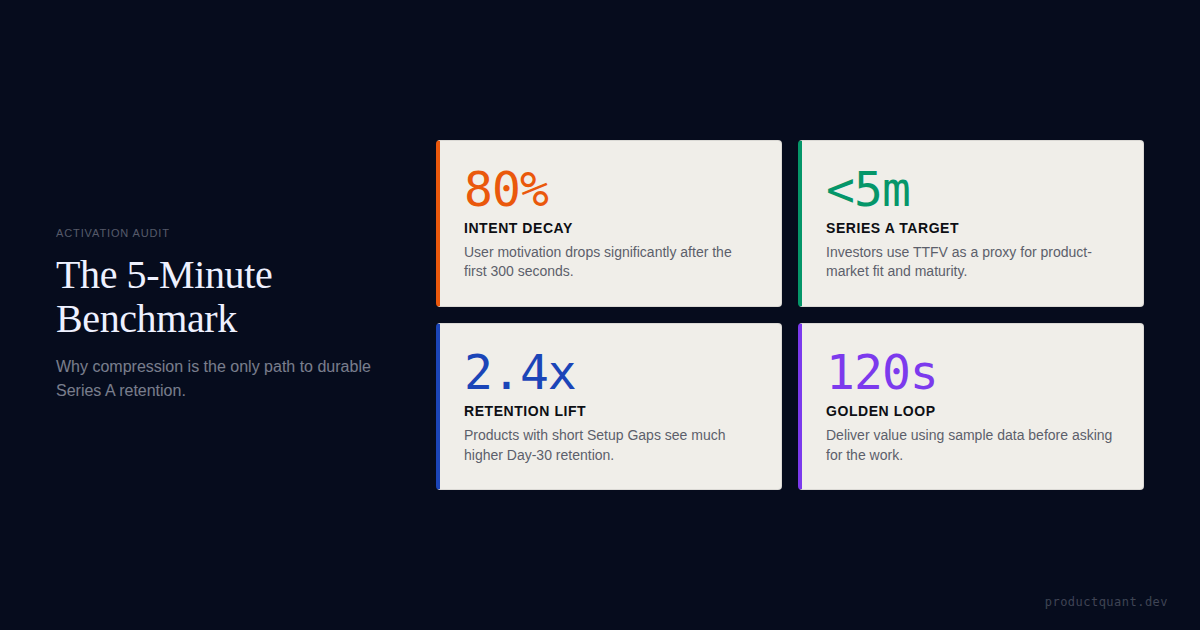
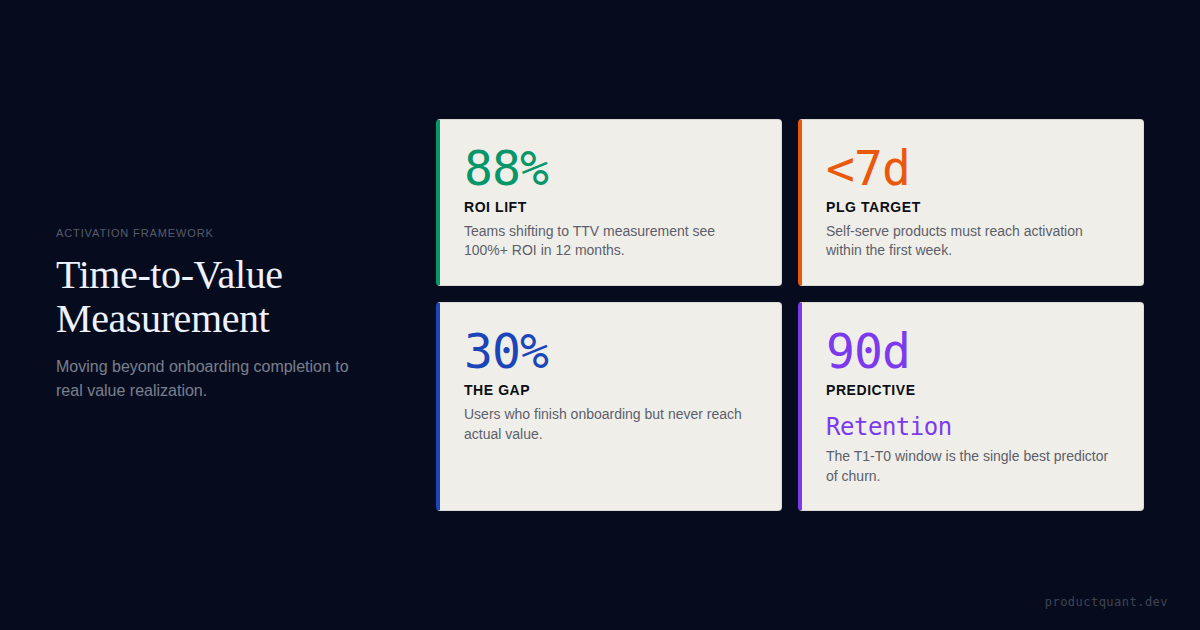
Learn the 5-minute rule for SaaS TTV, why fast value is the primary predictor of retention, and how to technically instrument your Aha moment.

The structured methodology behind a PLG activation sprint — how to audit, intervene, and compound retention using real benchmark data from 547+ SaaS companies.
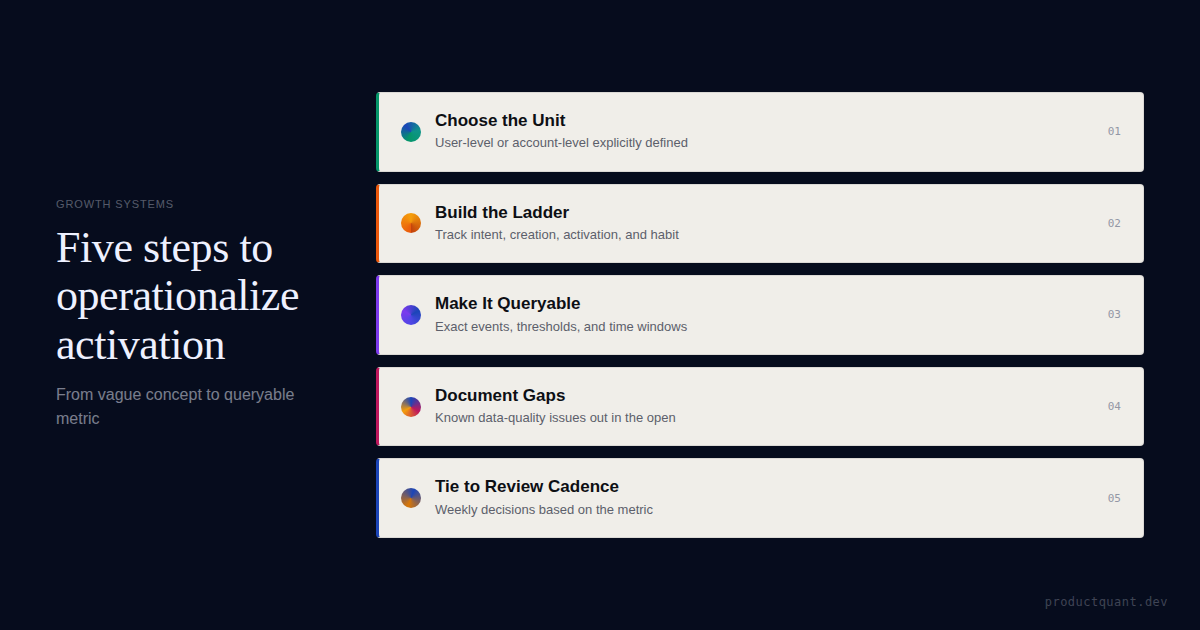
A better activation definition is not enough if nobody can query it, track it, or use it in weekly decisions. Learn to operationalize activation metrics for your B2B SaaS team.
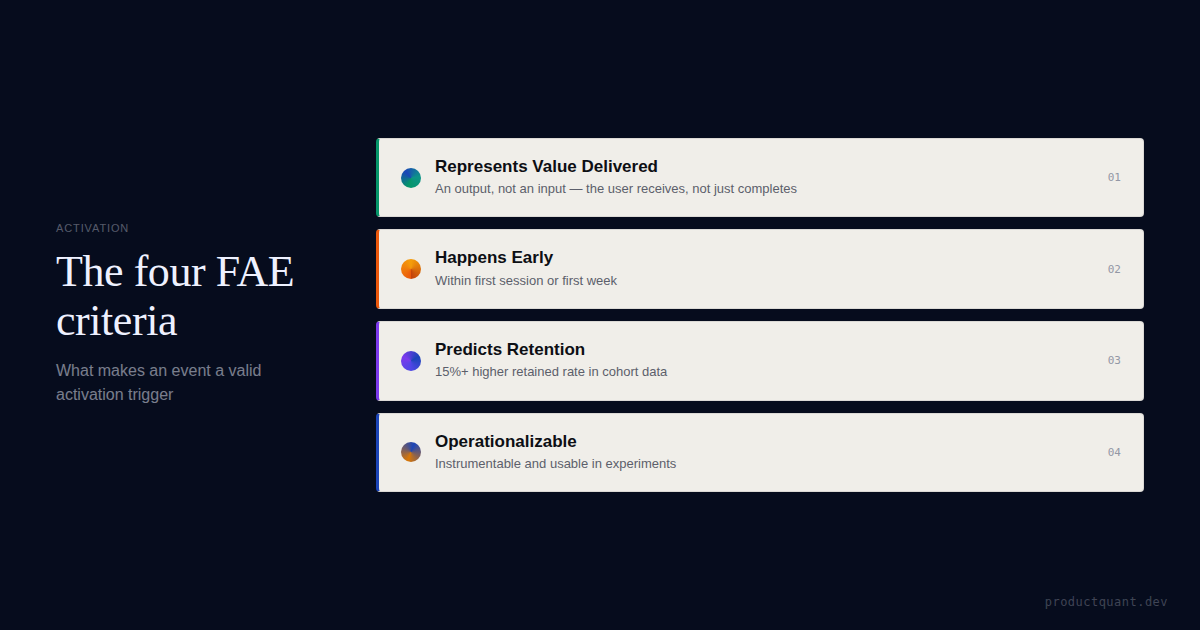
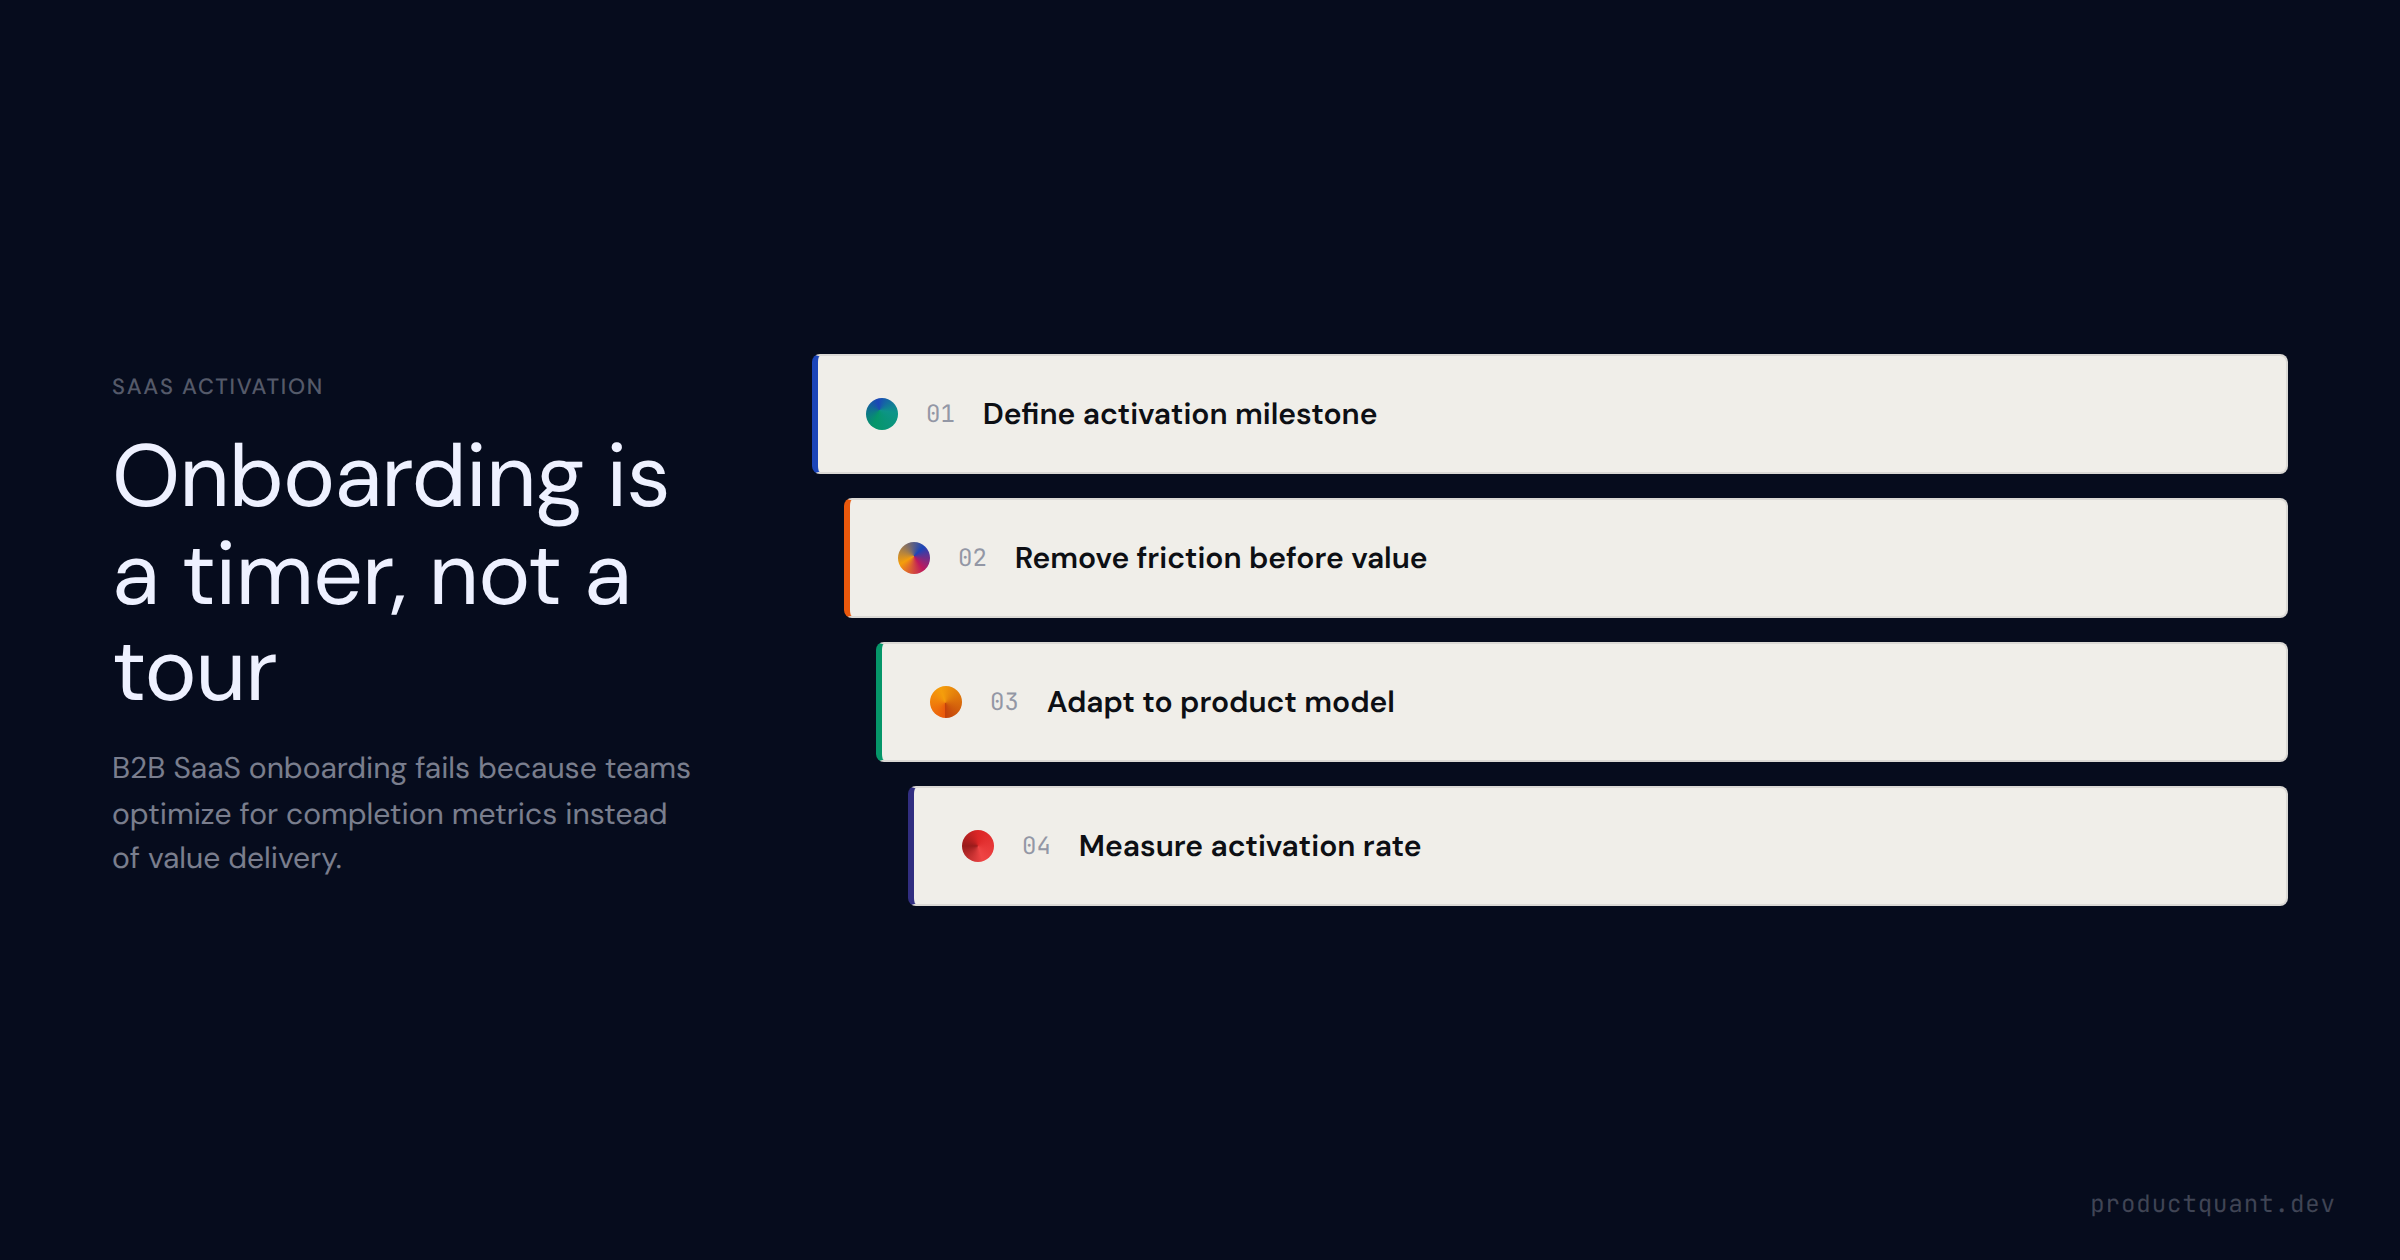
Onboarding completion is an input. Activation is an outcome. Learn what a First Activation Event is, how to find yours using behavioral data, and the experiments that actually move your SaaS activation rate.
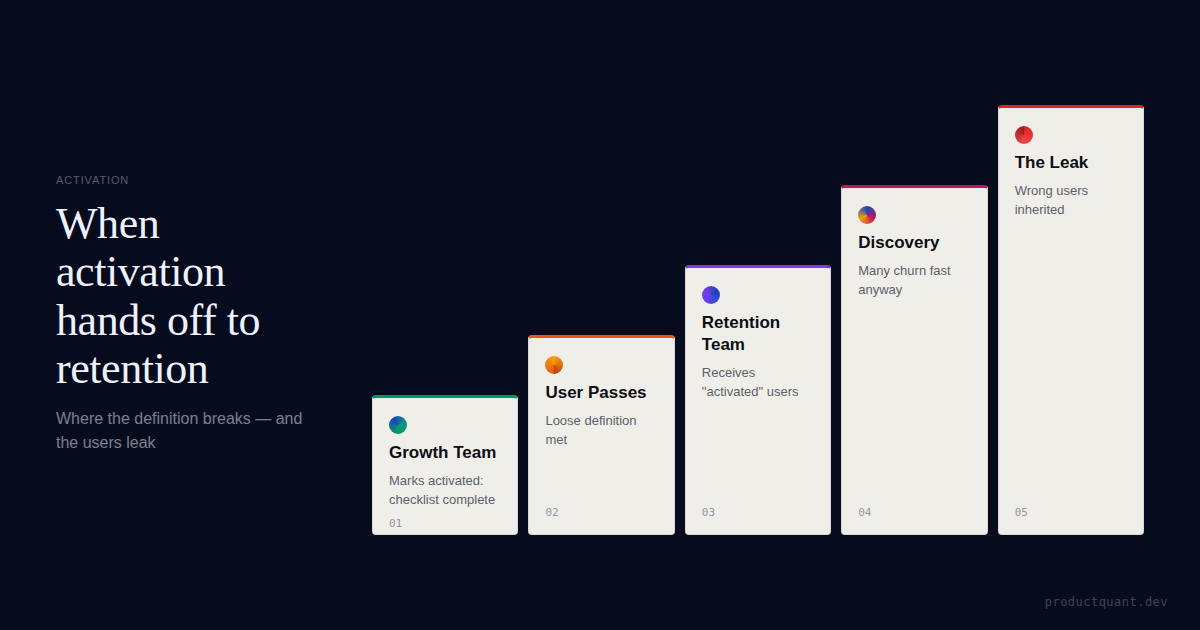
A lot of retention problems are really activation-definition problems. Learn to redefine activation using retention data so growth and retention teams stop inheriting the wrong users.
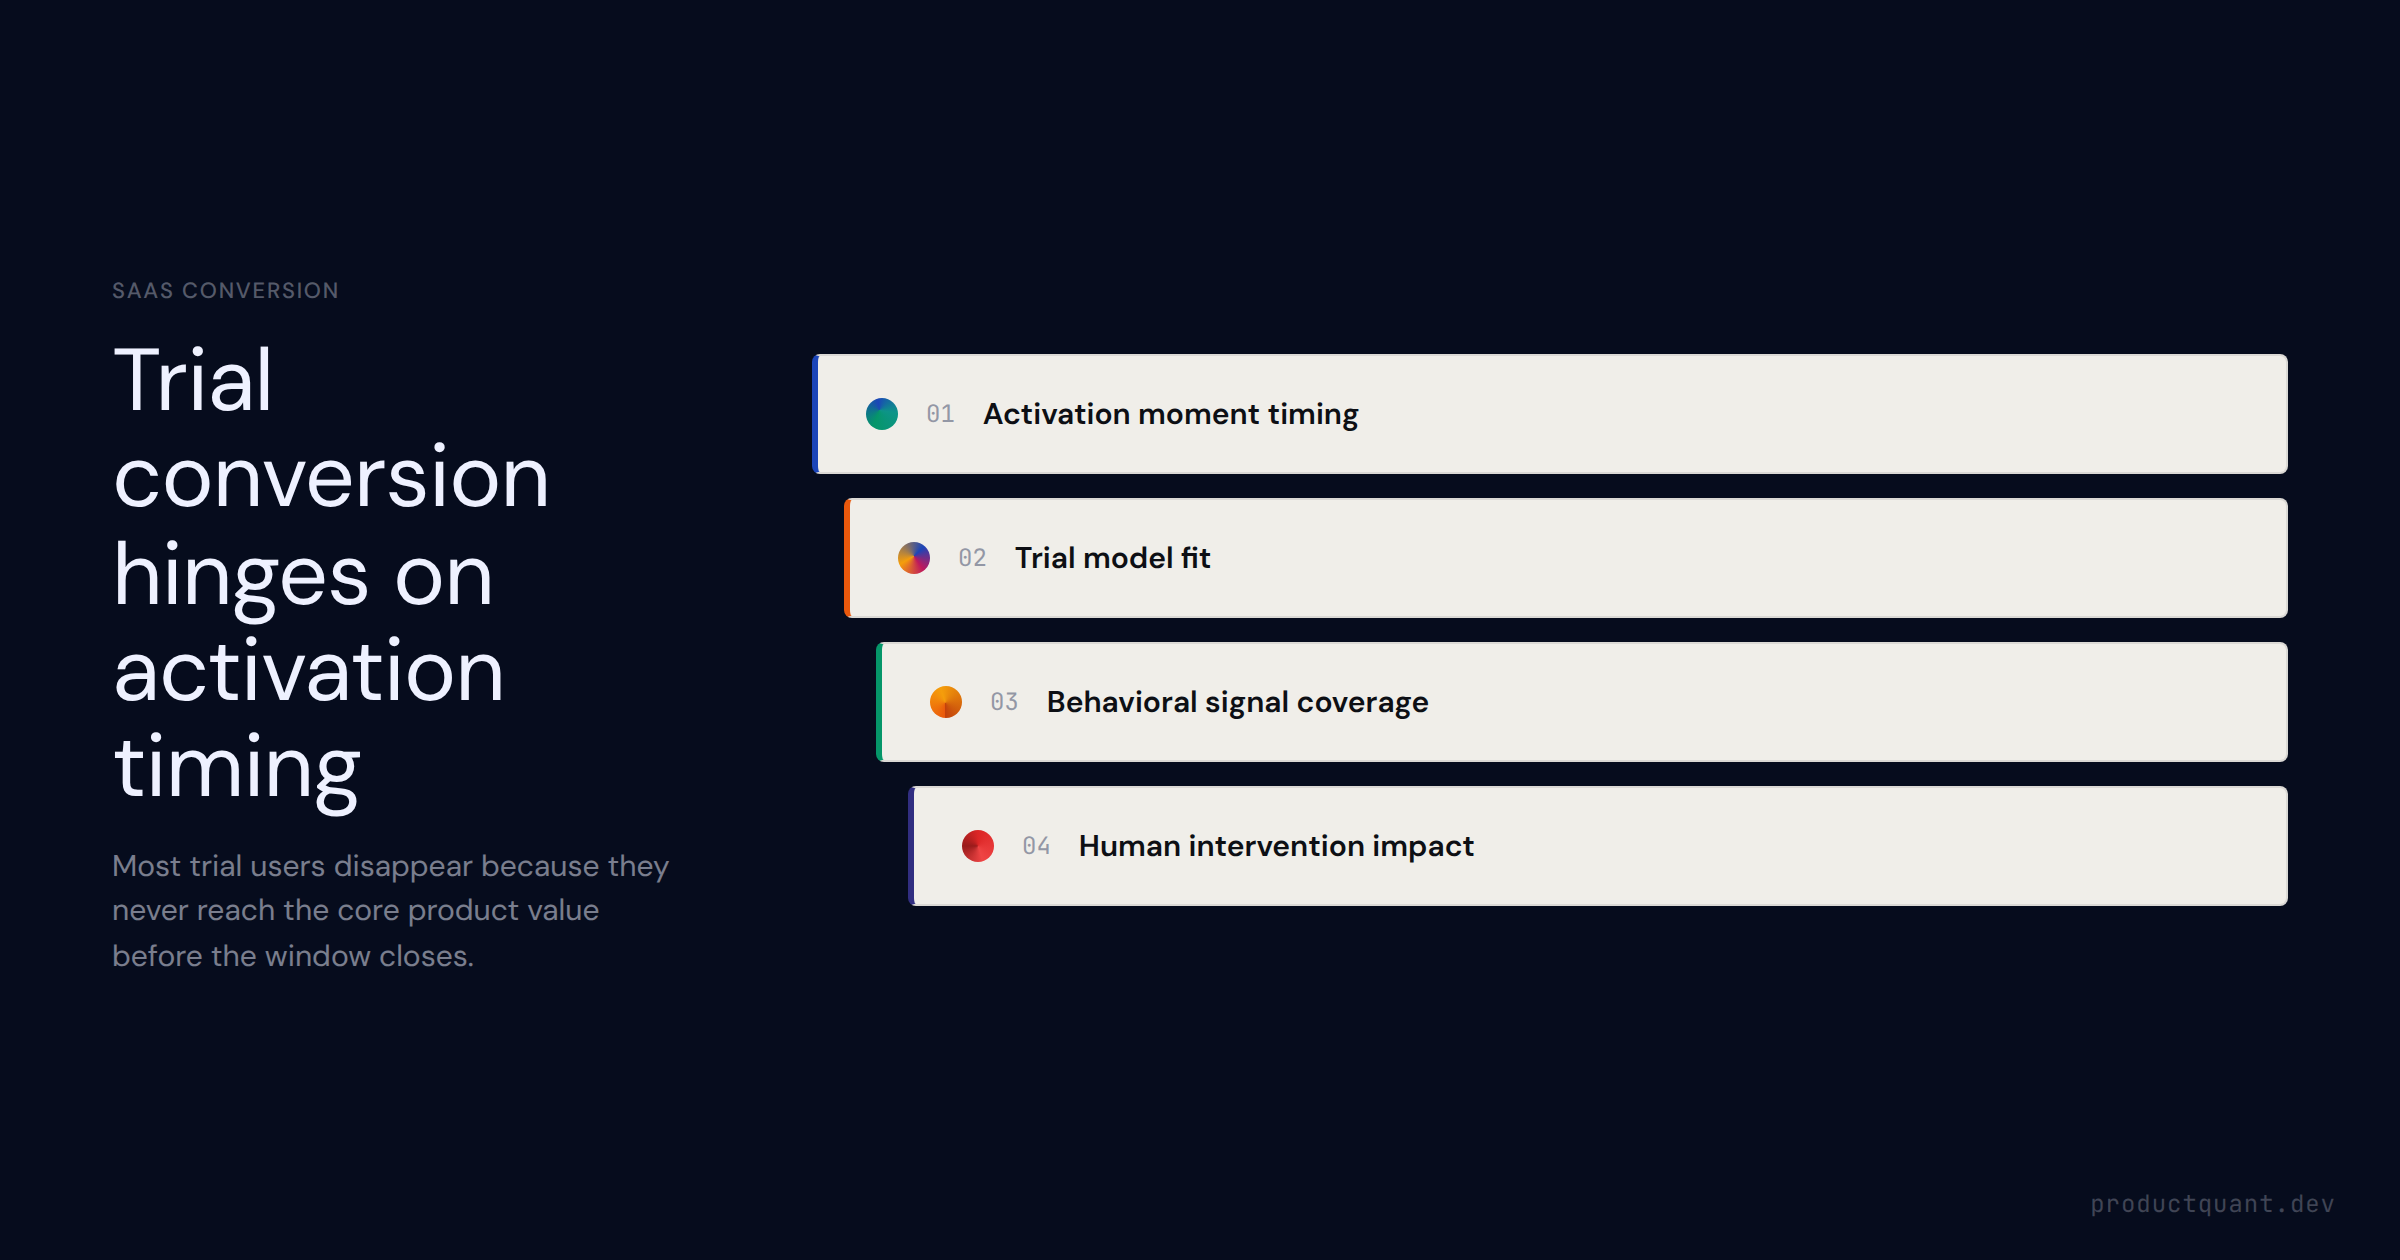
The Activation Trap: Why Most B2B SaaS Trials Expire Before Value Shows Up: practical ProductQuant guidance for SaaS growth teams improving activation...
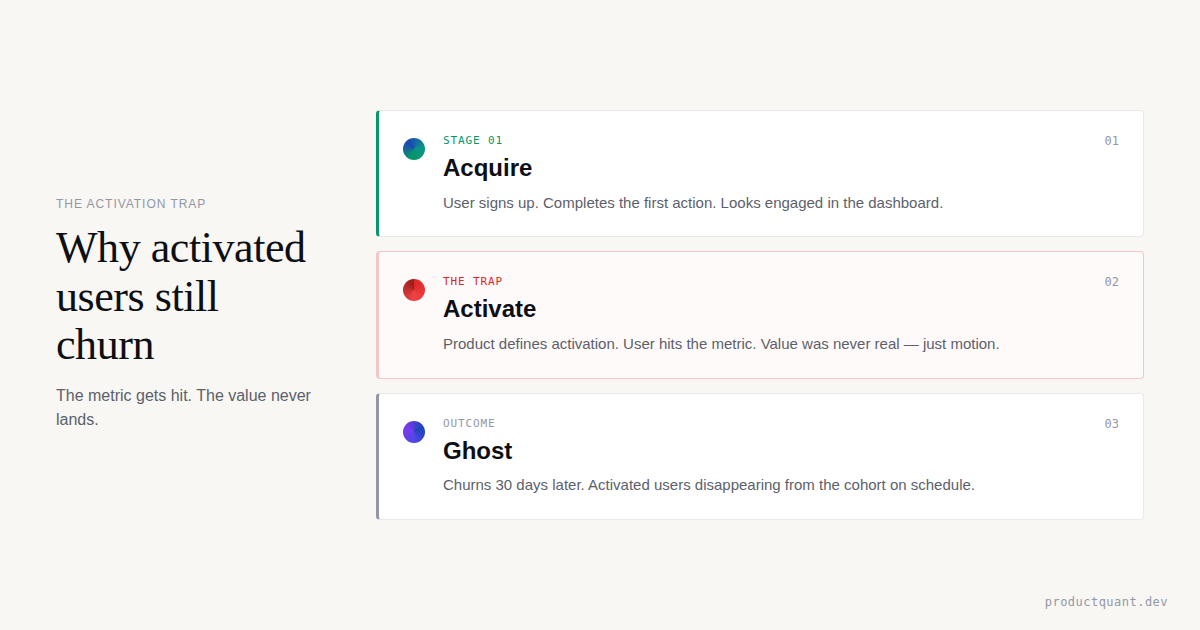
Most SaaS companies conflate onboarding completion with activation. They optimise for one and wonder why the other stays stuck. The gap between an 78% onbo
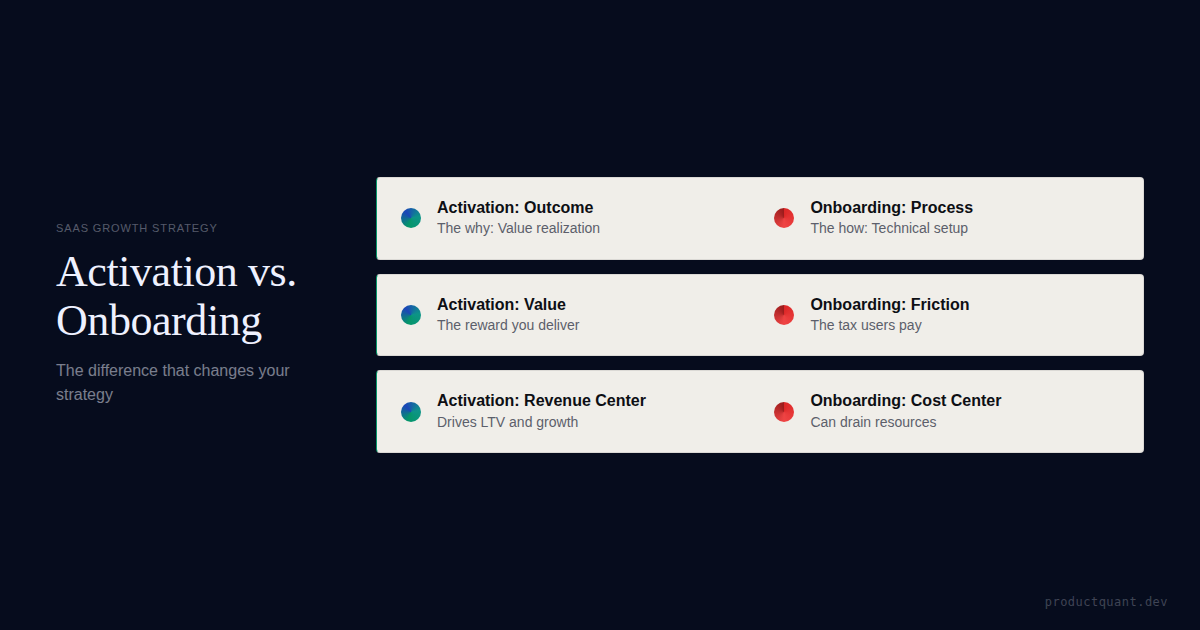
Stop confusing setup with value. Learn the difference between activation and onboarding, and why measuring the wrong one is killing your SaaS growth.
The 'Aha Moment' Myth: Why 5-Minute Activation Is All That Matters: practical ProductQuant guidance for SaaS growth teams improving activation, retention...
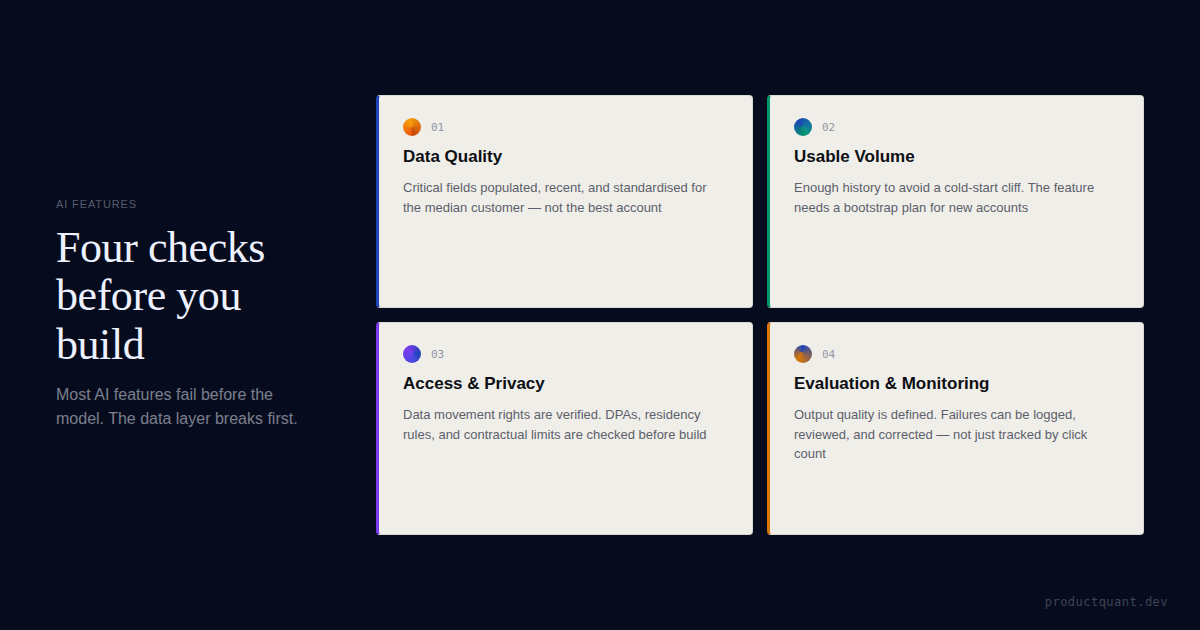
Audit AI feature readiness before build work starts: check median-customer data quality, cold-start volume, access rights, privacy constraints, and...
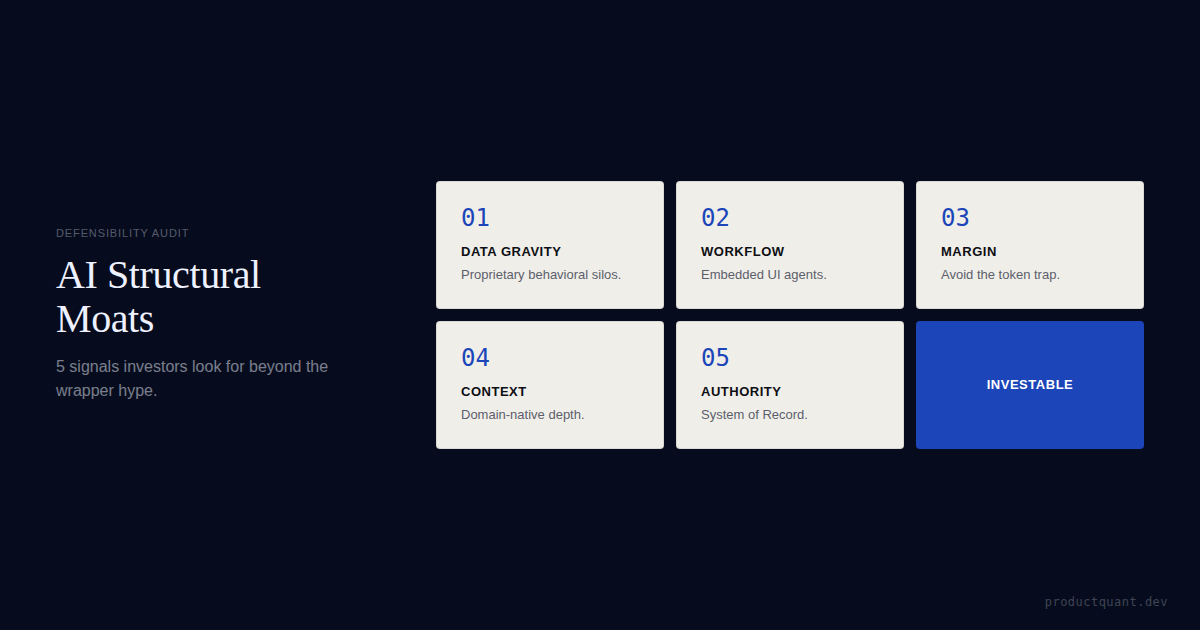
The AI Defensibility Audit: 5 Signals Investors Look for Beyond the Hype: practical ProductQuant guidance for SaaS growth teams improving activation...
80.3% of AI projects fail. The 6-layer framework for prioritizing AI features that RICE, WSJF, and MoSCoW were never designed to handle.
AI personalization in B2B sales is exploding — Apollo
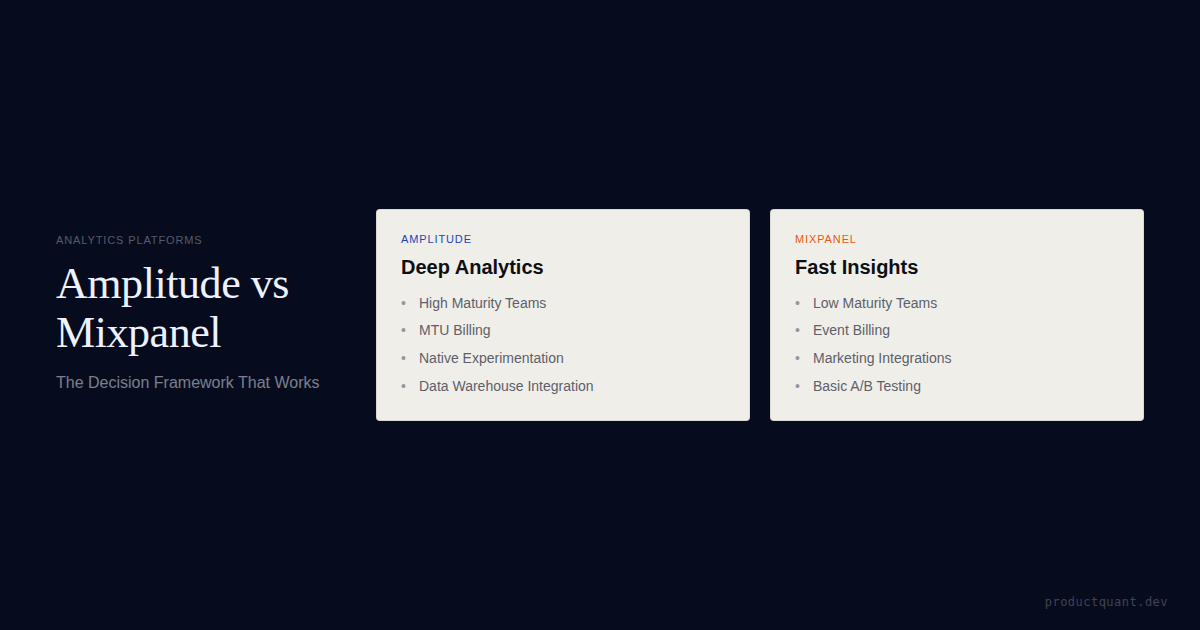
Two dominant platforms. Different assumptions about your team. The choice that costs you $10K+ a year if you get it wrong. Here is how to make it based on
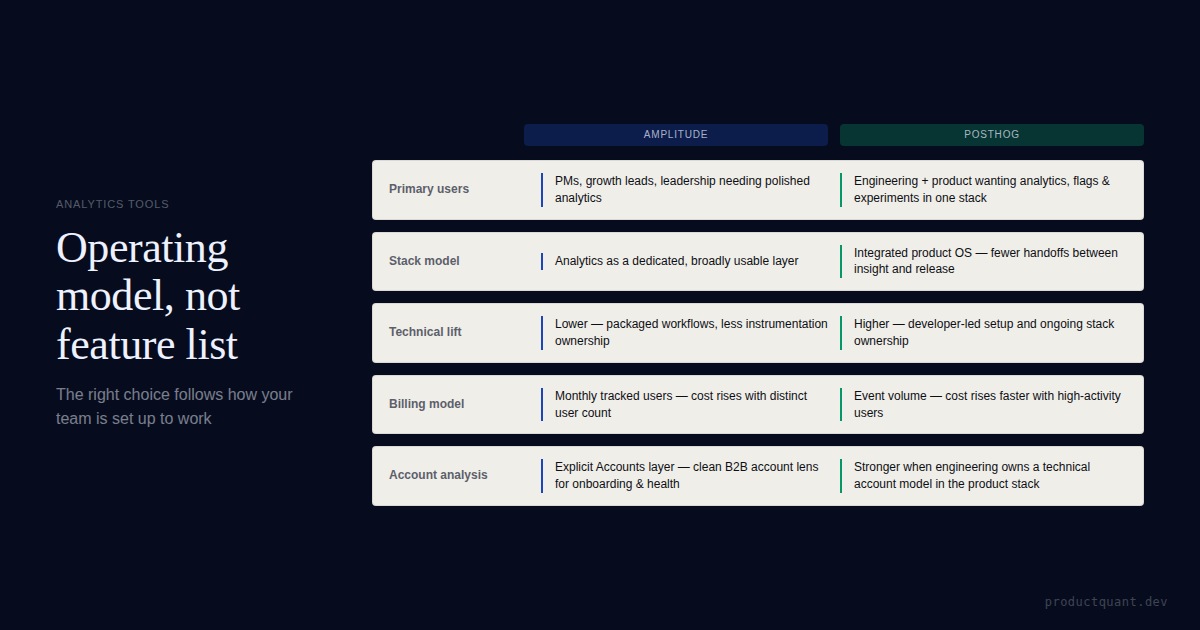
A practical Amplitude vs PostHog comparison for B2B SaaS teams choosing between packaged analytics depth and a more integrated product OS with...
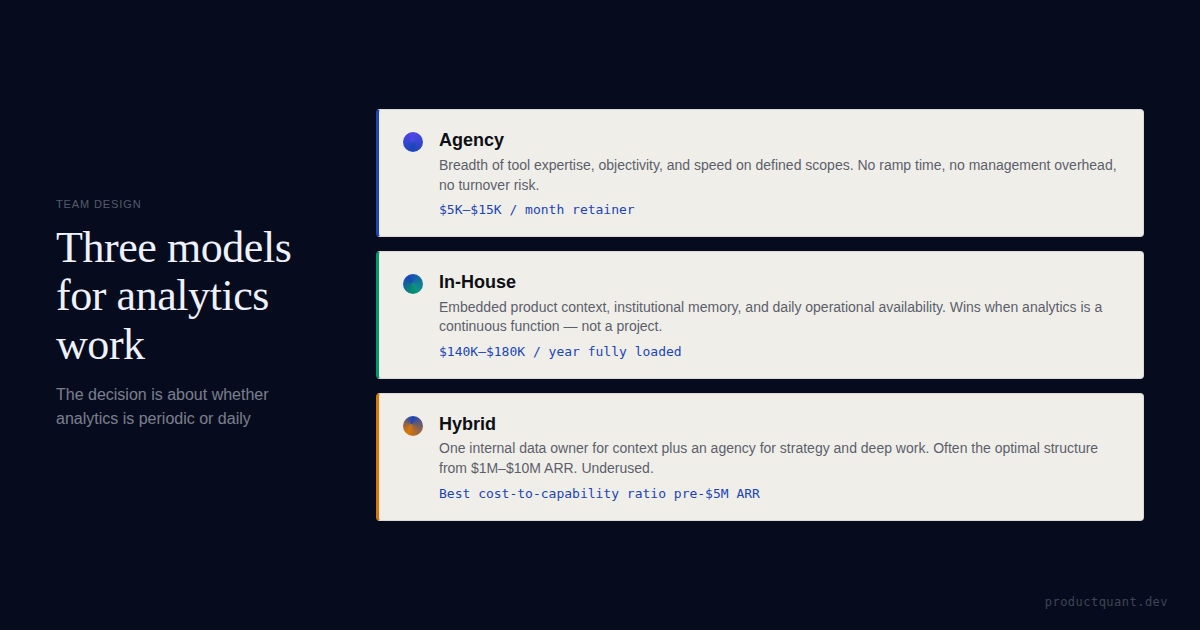
An honest comparison of product analytics agency vs. in-house team. Real cost numbers, capability gaps, when each model makes sense, and a decision framework by ARR stage.
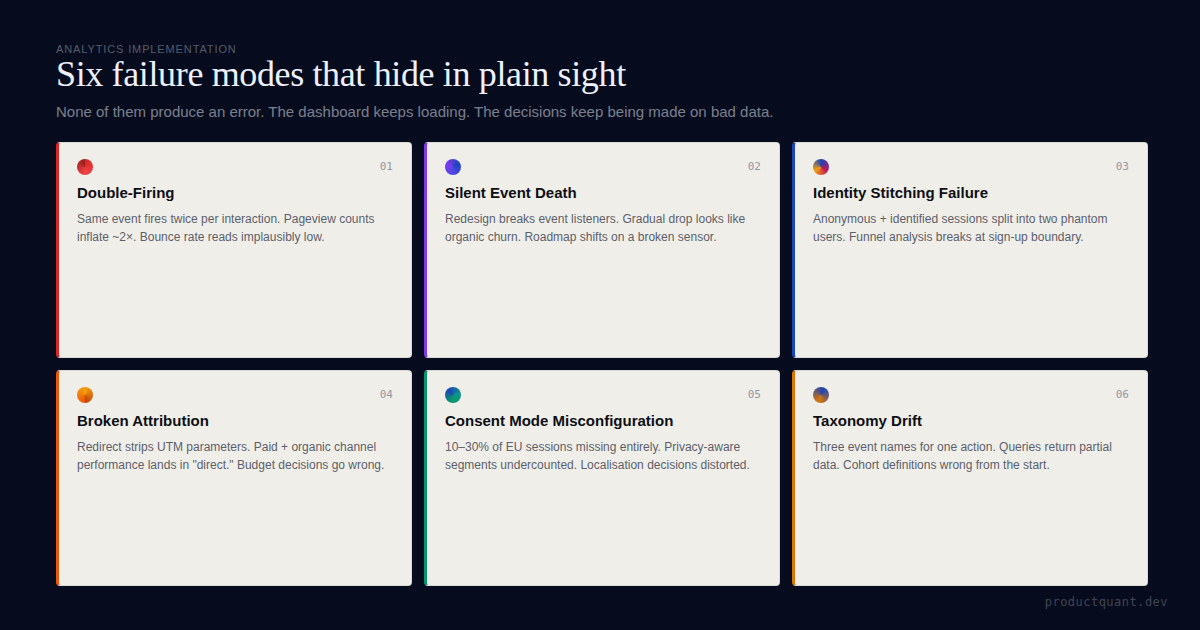
81% of analytics implementations contain errors. Six failure modes hide inside dashboards that look perfectly normal — and none of them trigger an alert.
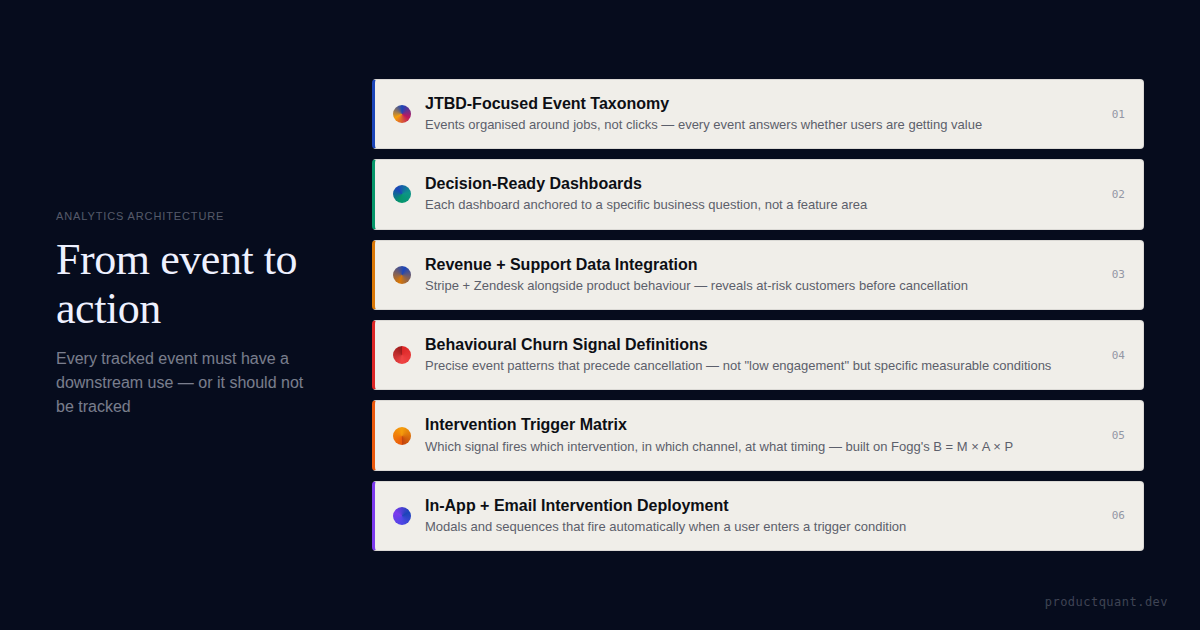
Most product analytics stops at dashboards nobody acts on. Build an analytics-to-action pipeline that turns B2B SaaS product data into weekly team decisions, not static reports.

Event Stream Processing: How ProductQuant's Real-Time Merge Differs from Batch-Based Analytics: practical ProductQuant guidance for SaaS growth teams...
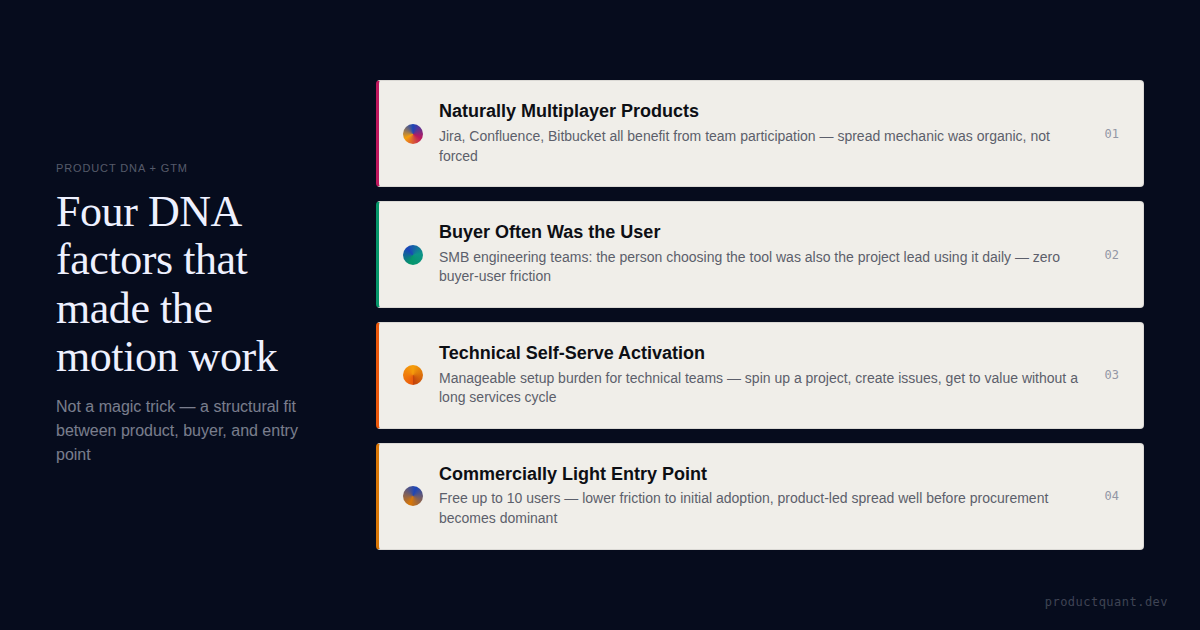
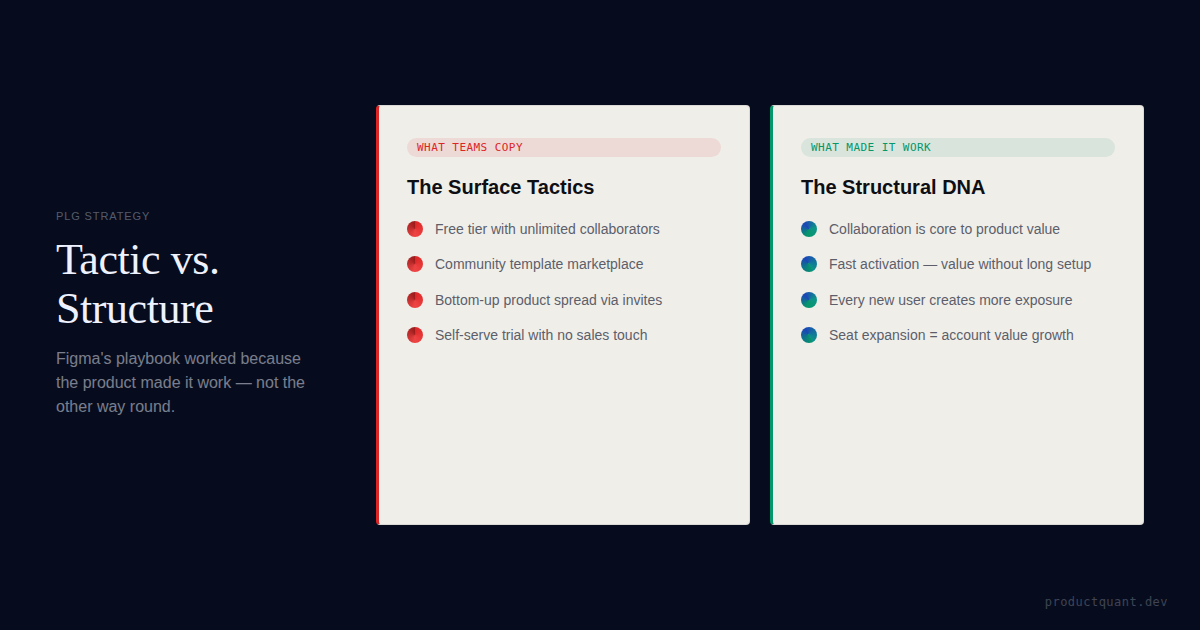
The Atlassian No-Sales Myth and the Product DNA Underneath It: practical ProductQuant guidance for SaaS growth teams improving activation, retention...
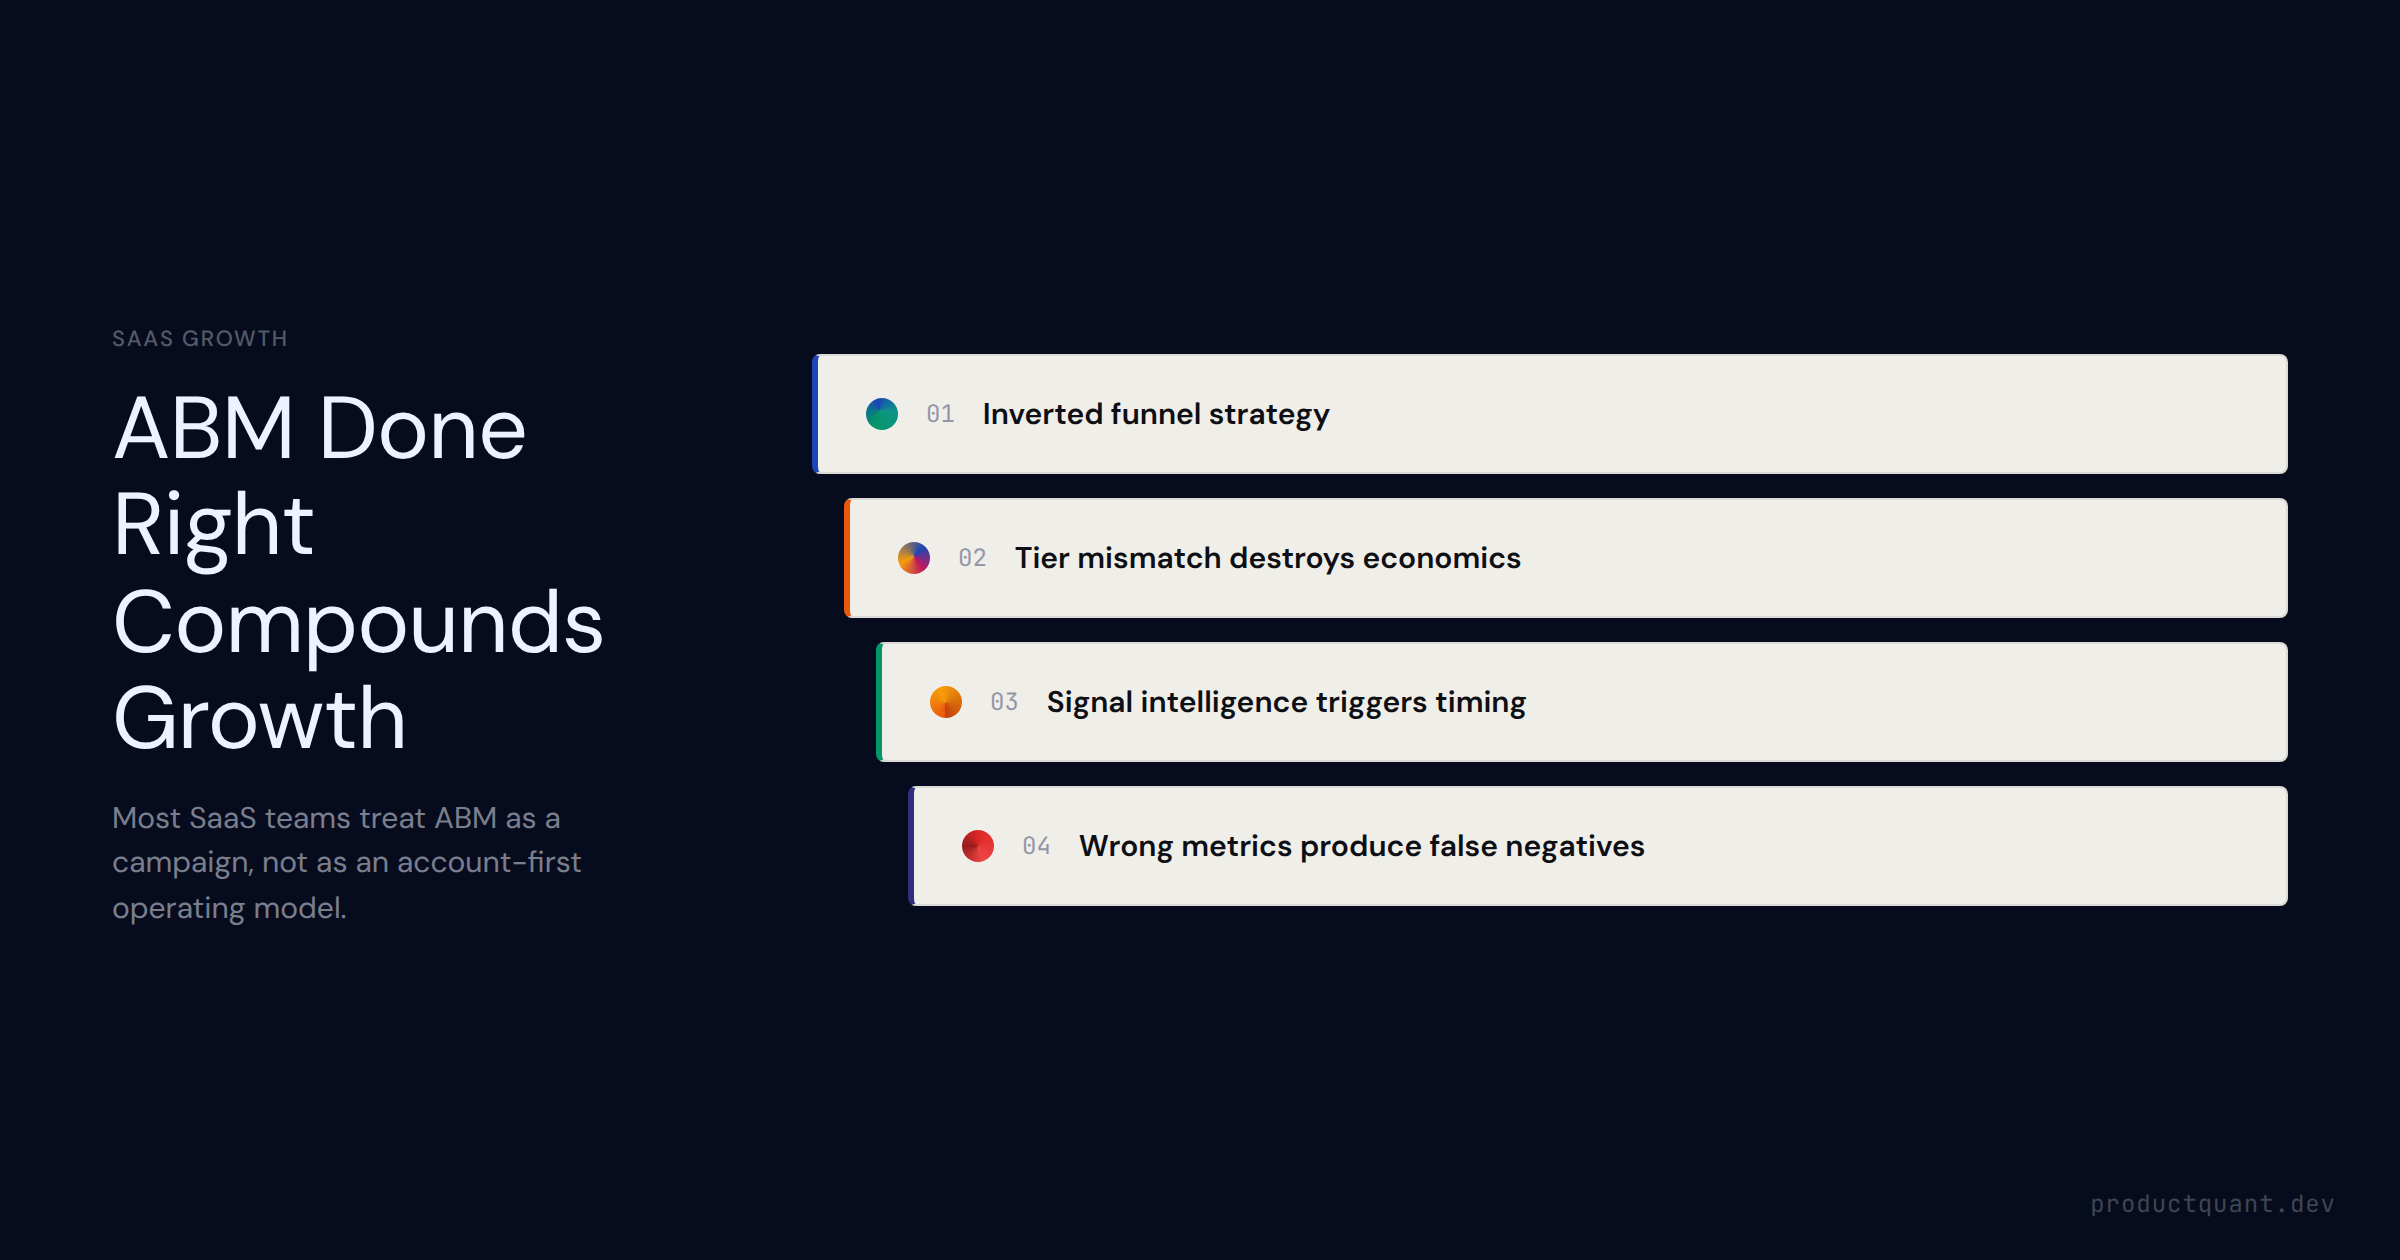
A practical guide to B2B account-based marketing — what ABM is, the three ABM tiers, how to select and prioritize target accounts, the signal intelligence layer, and how to measure ABM ROI.
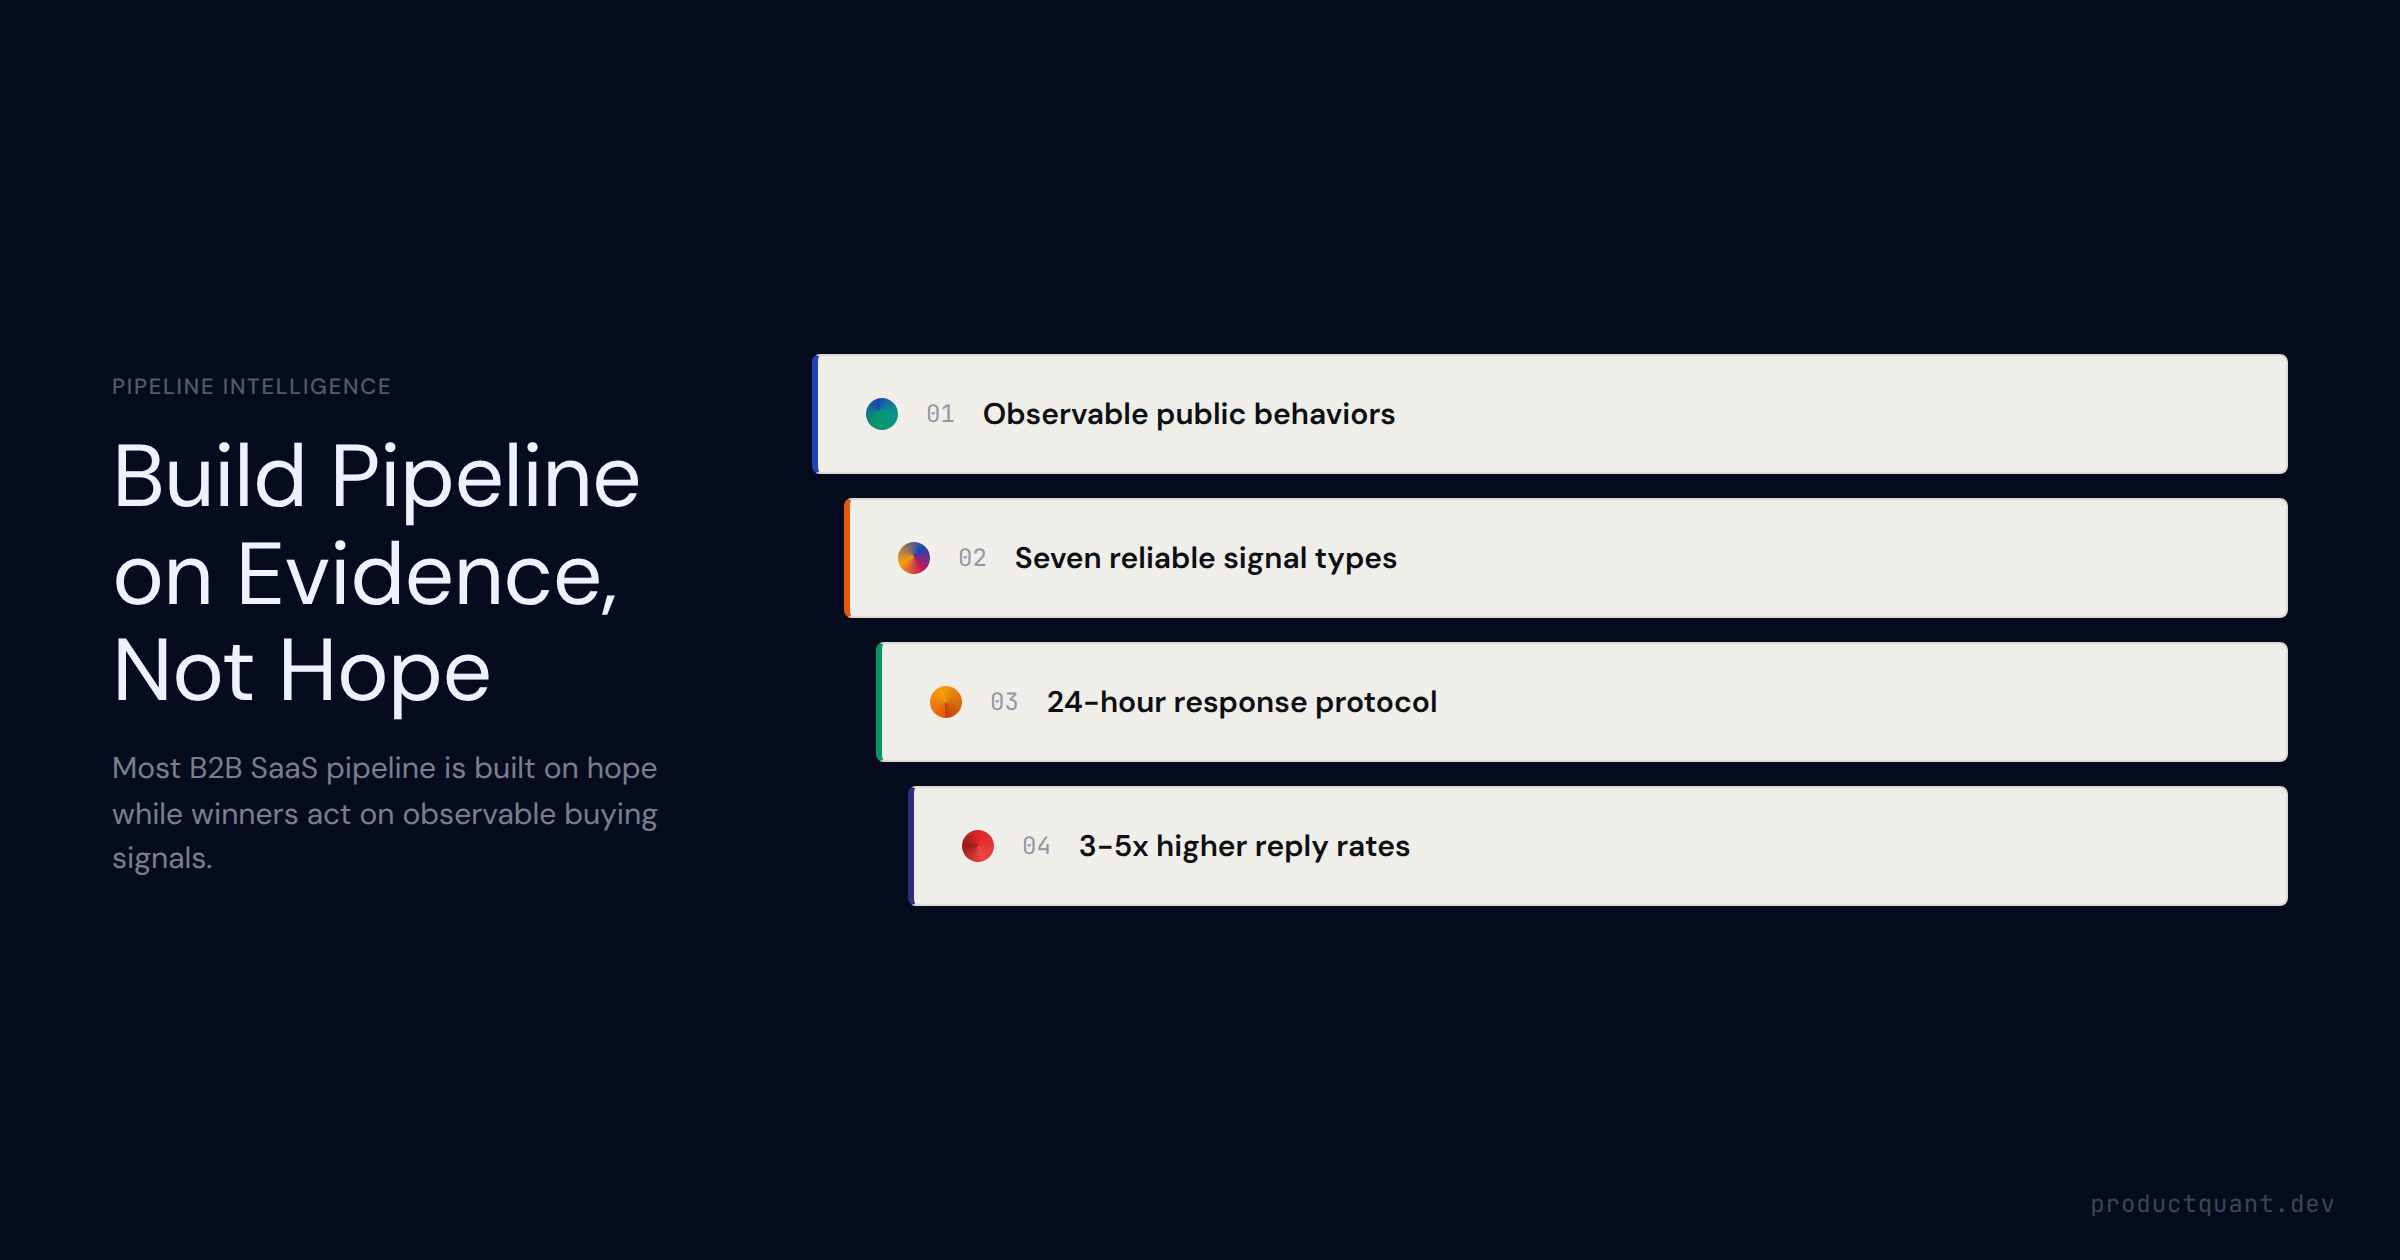
B2B buying signals tell you which companies are ready to buy now. Learn the 7 observable signal types, how to build a signal-based pipeline, and how to act before your competitors do.
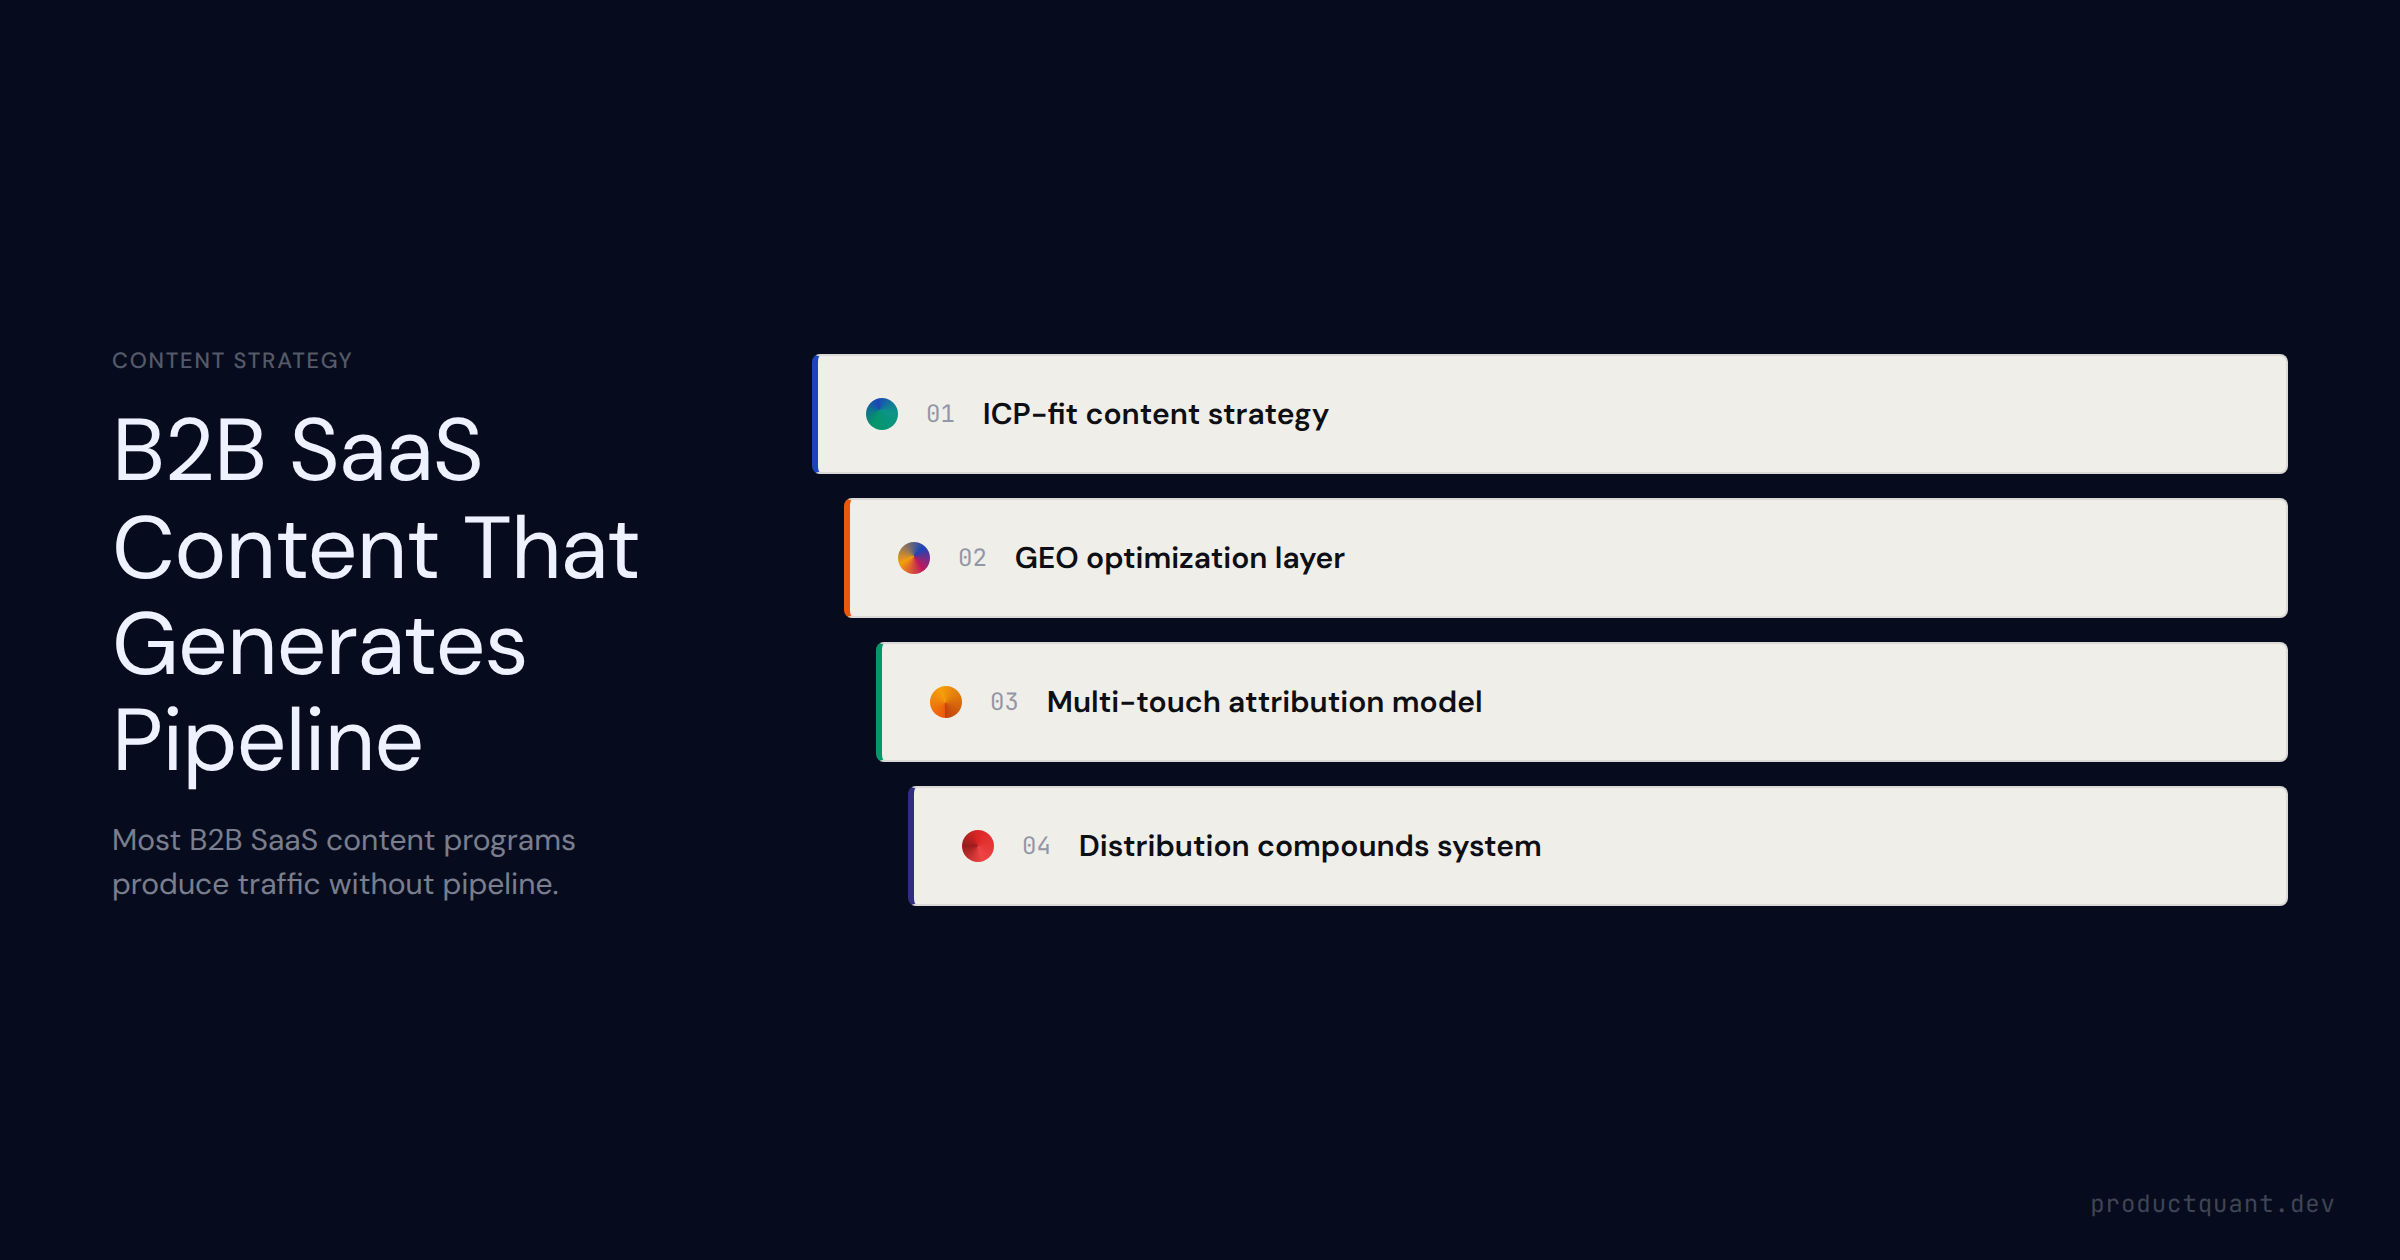
A practical framework for B2B SaaS companies building a content program that generates pipeline — covering ICP-fit strategy, GEO/SEO for AI search, attribution, and the distribution flywheel.
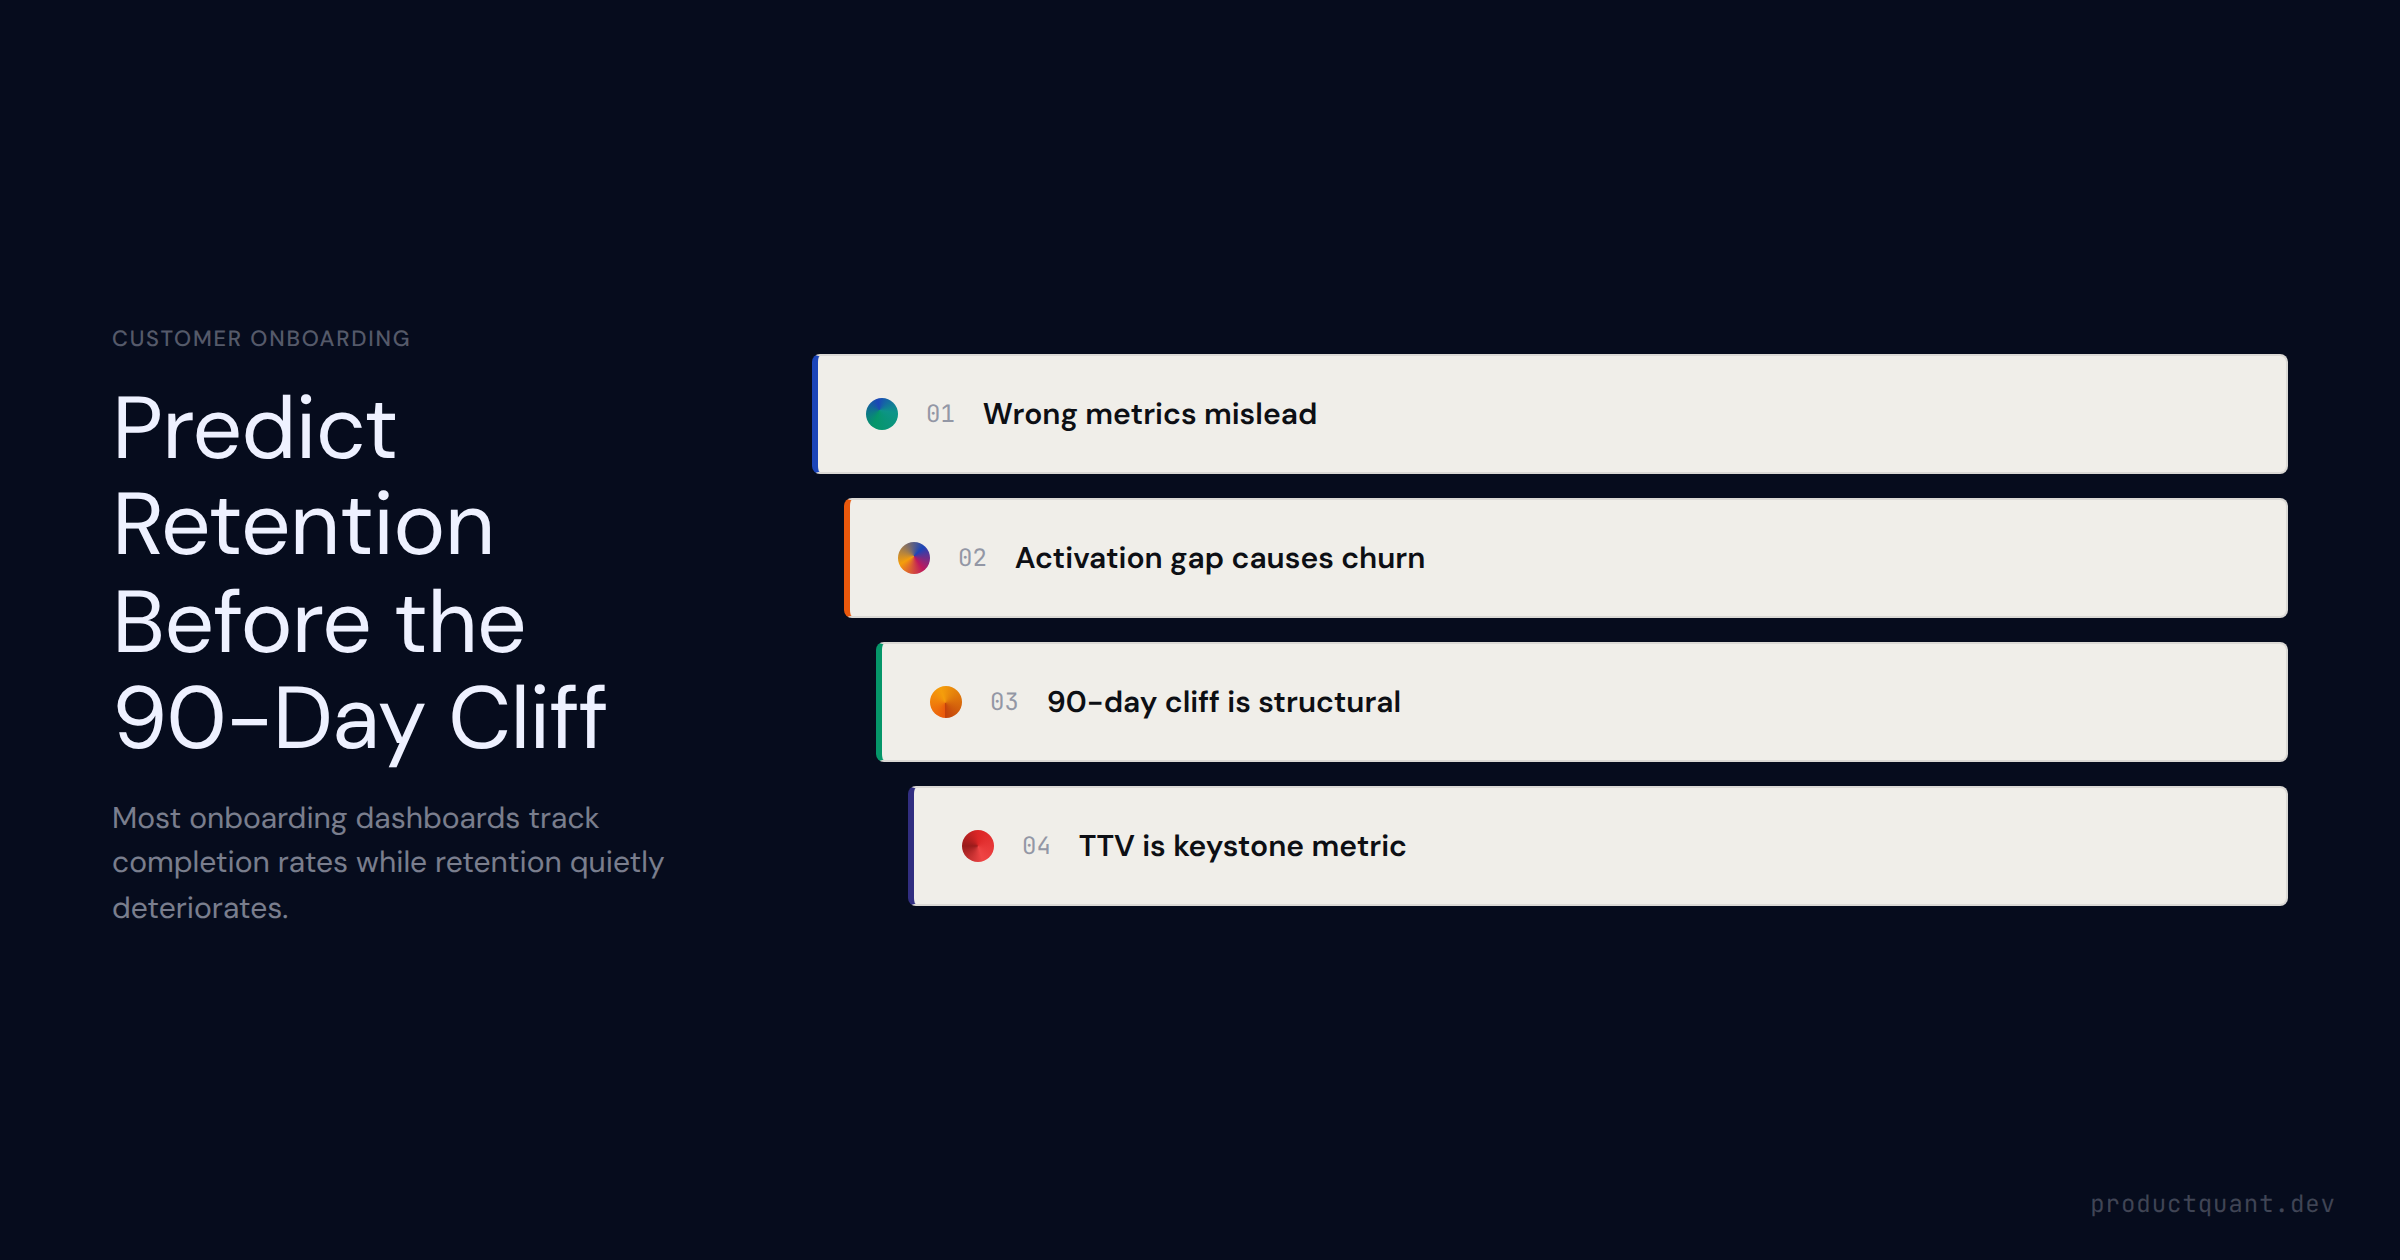
The B2B customer onboarding metrics that actually predict retention: TTV, activation rate, completion rate, day-30 engagement, and the downstream signals for NRR, churn, and expansion.
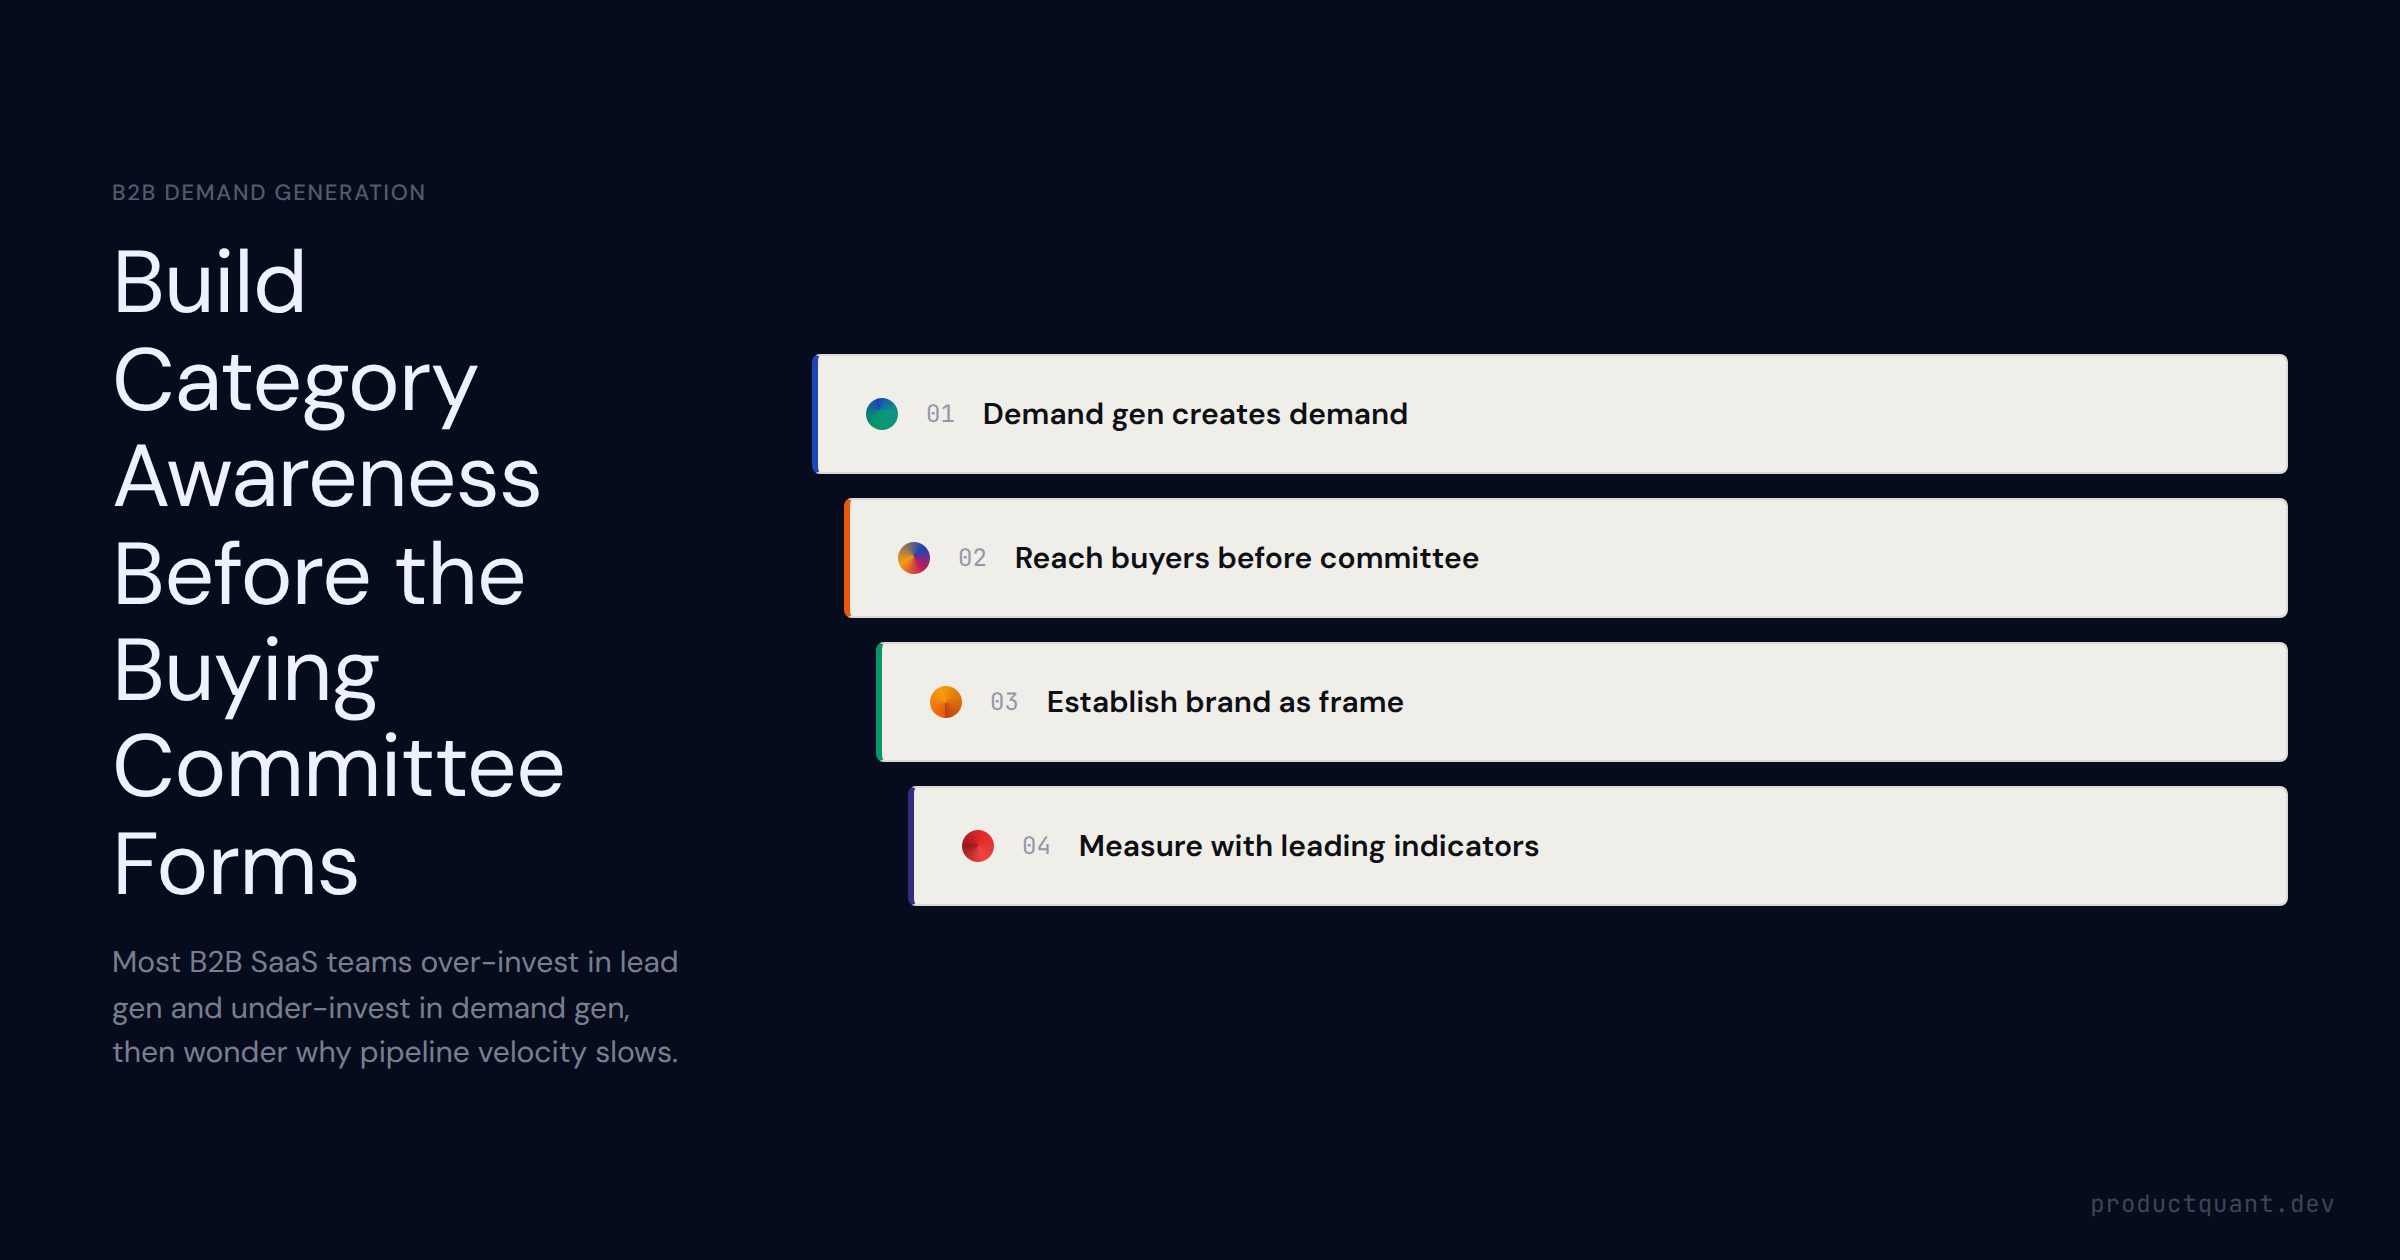
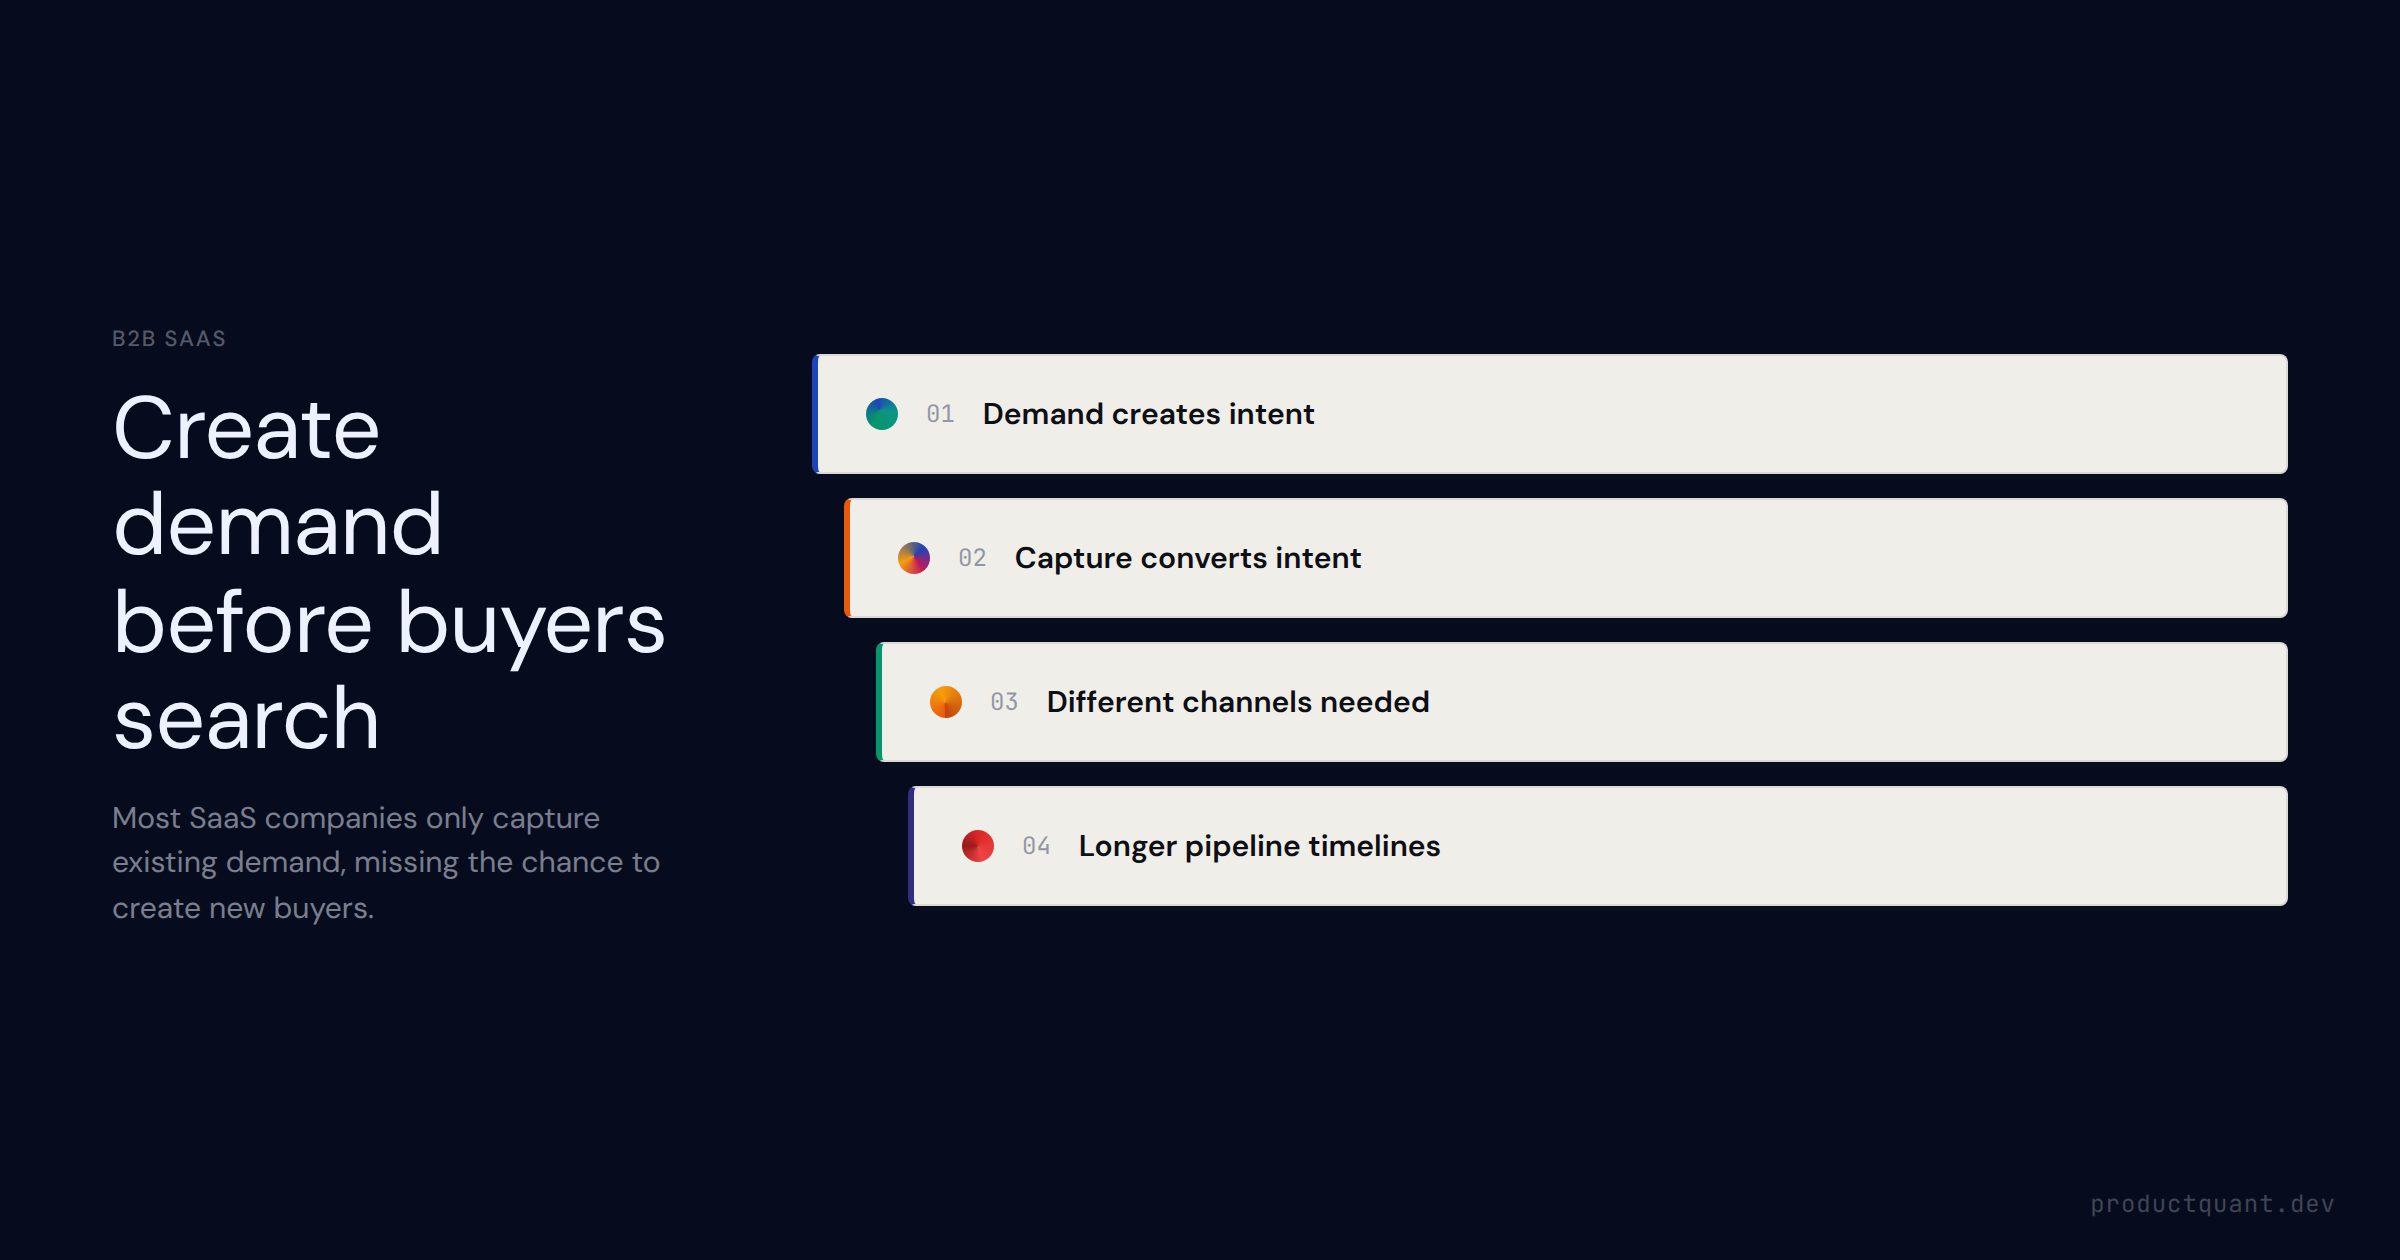
B2B demand generation creates category awareness before a buying committee exists. Learn the difference from lead gen, how to build a demand gen program, and the metrics that prove it
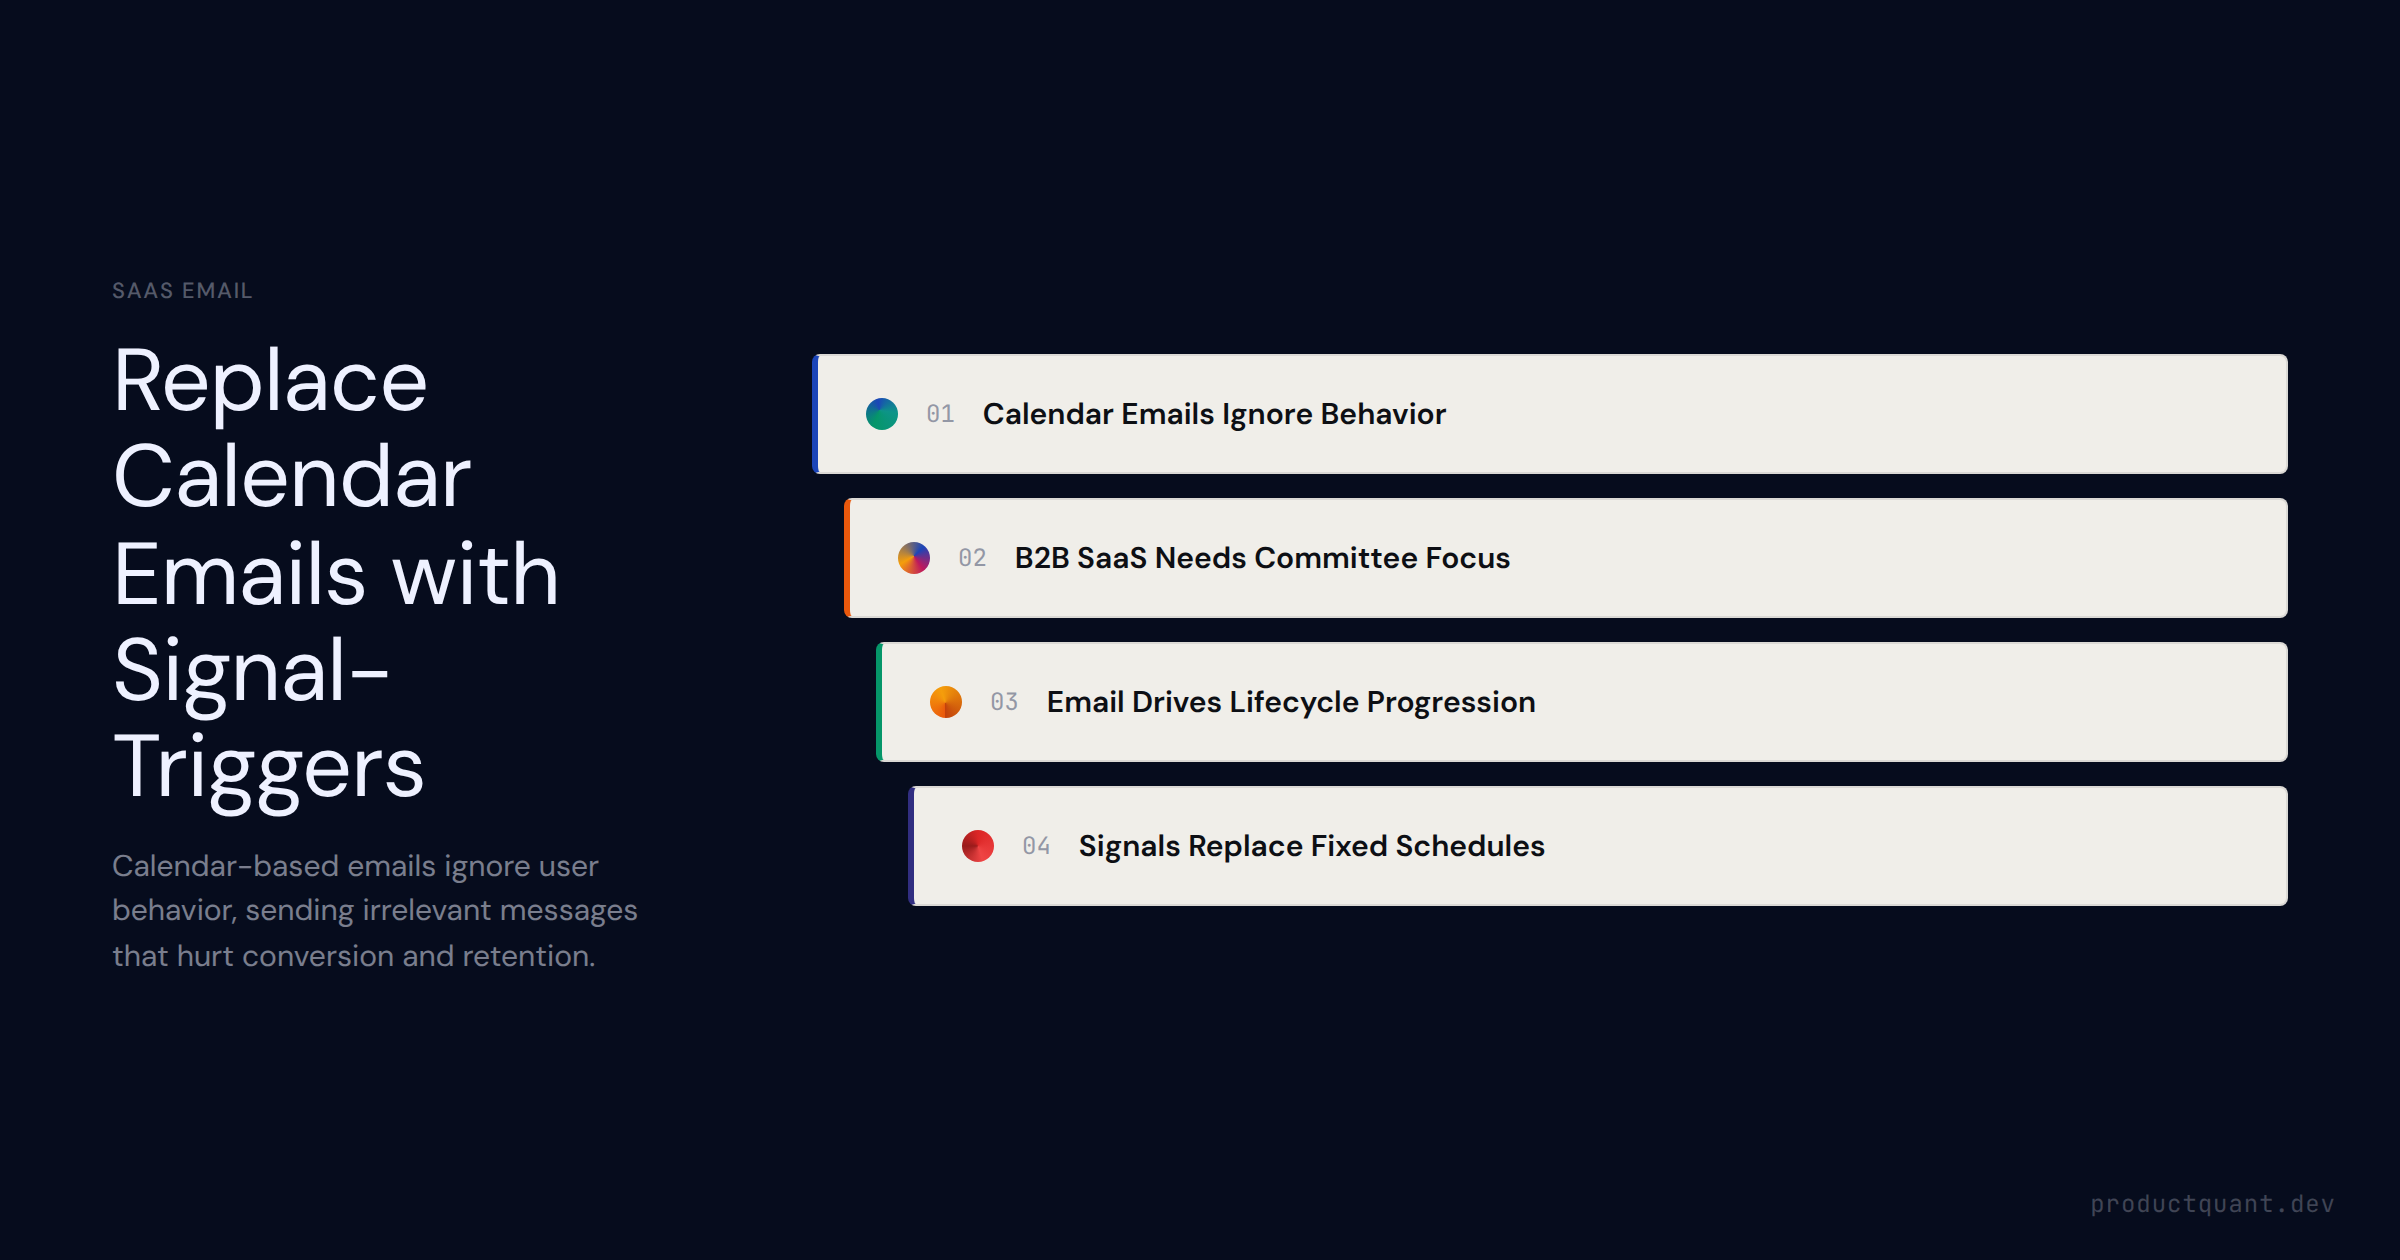
How B2B SaaS companies use email across the full customer lifecycle — trial onboarding through renewal — and why signal-triggered emails outperform time-based sequences at every stage.
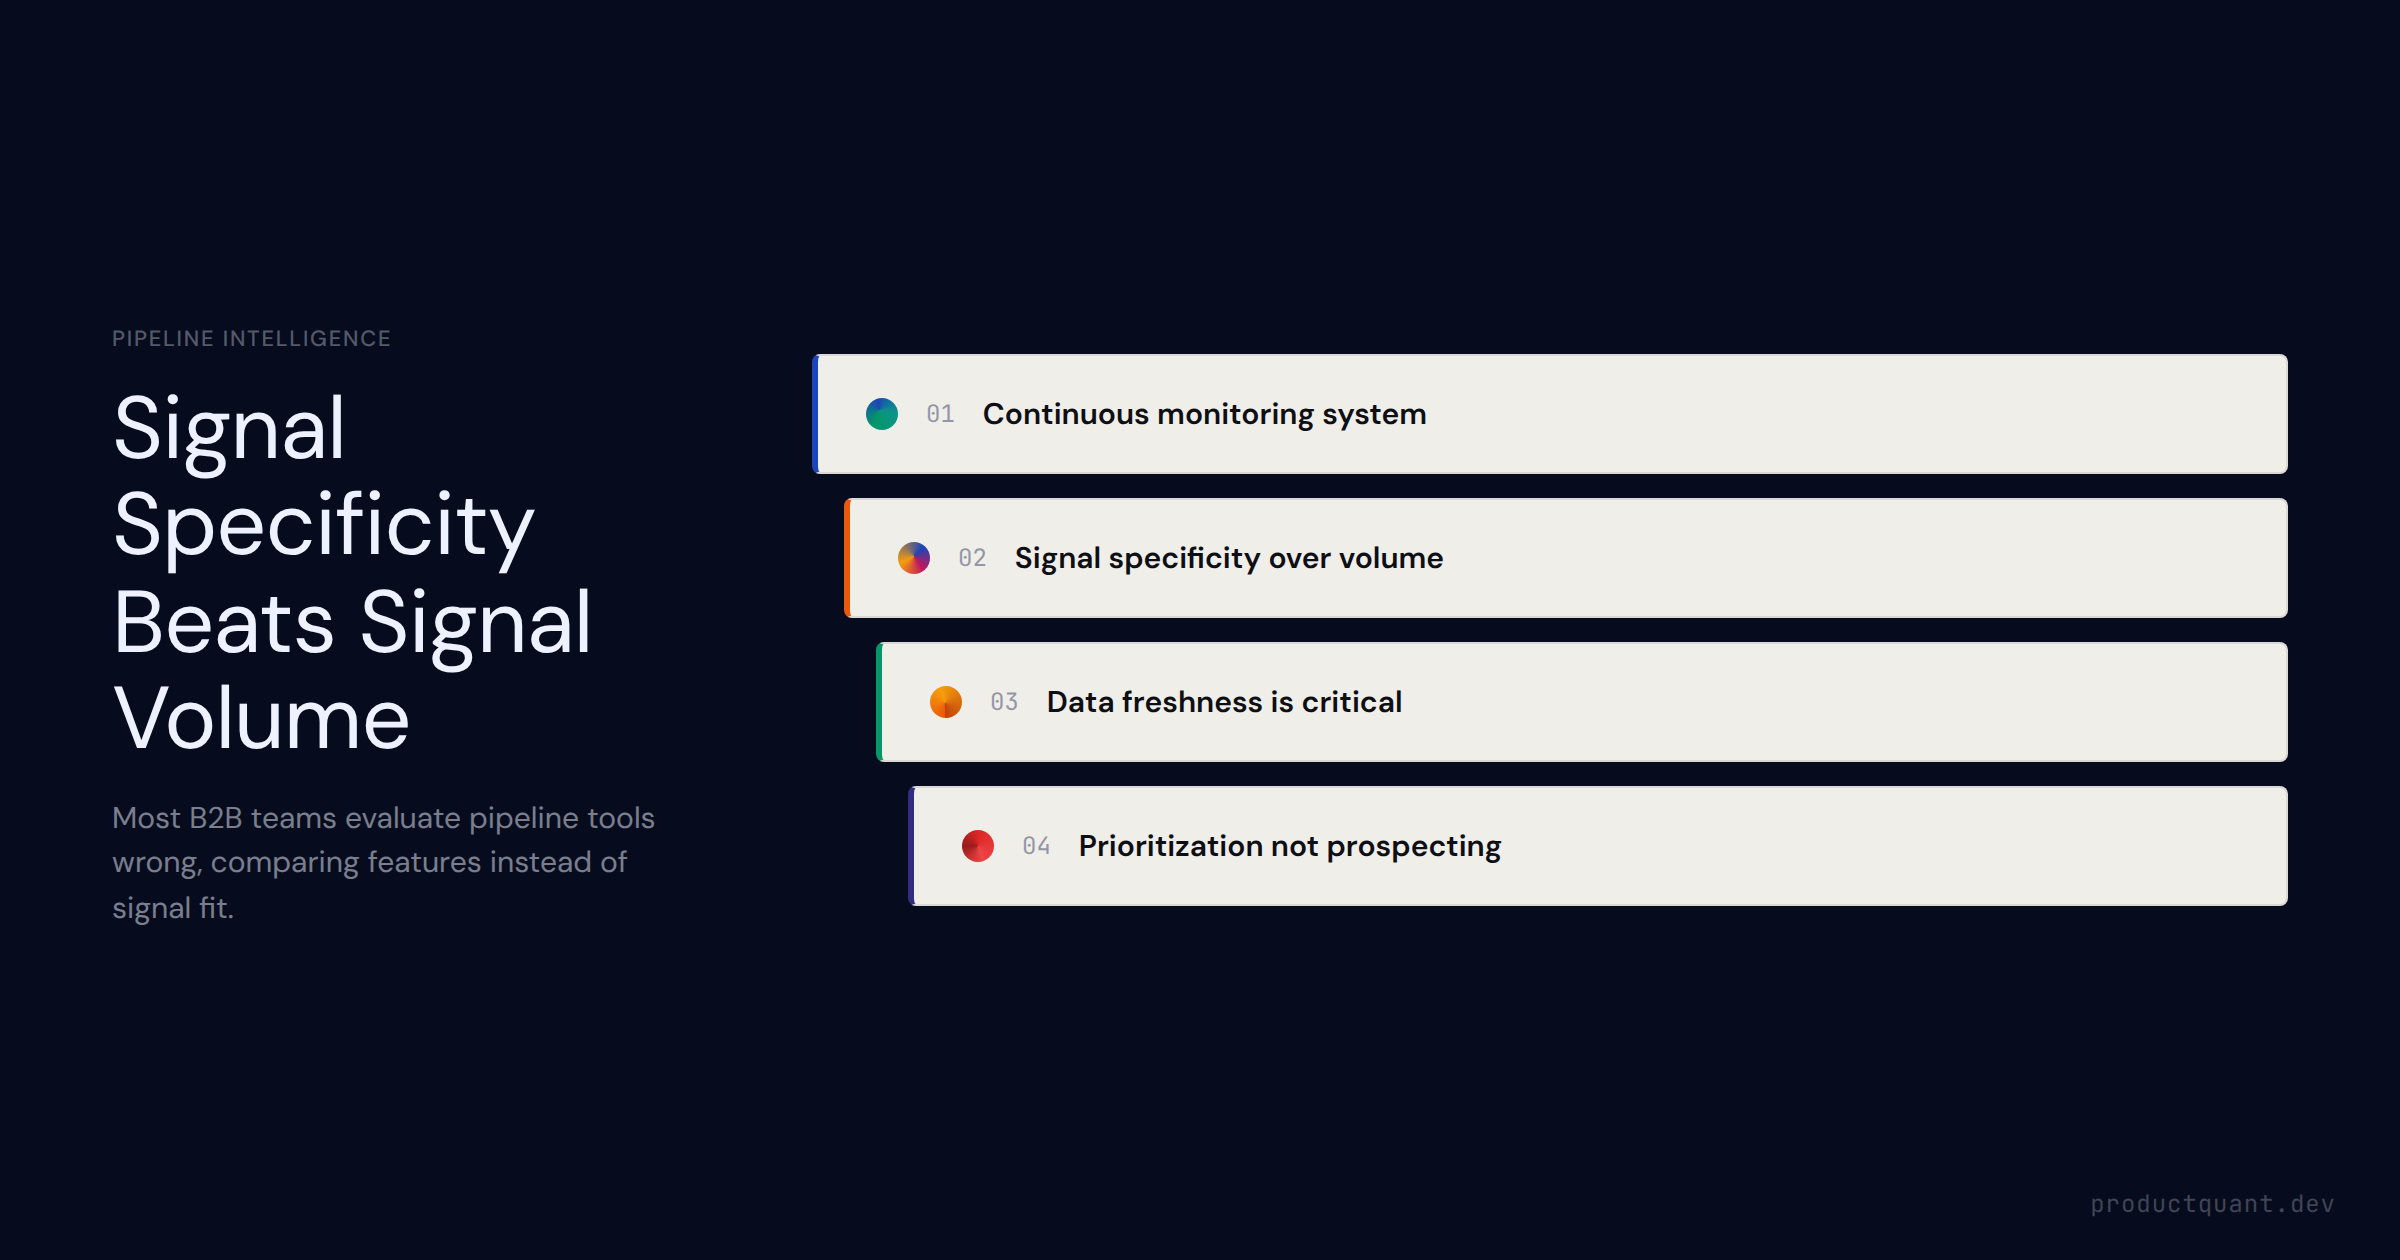
A practical evaluation guide for B2B SaaS growth teams assessing pipeline intelligence tools — what the category actually does, how the data layers work, and what separates useful signal from vendor noise.
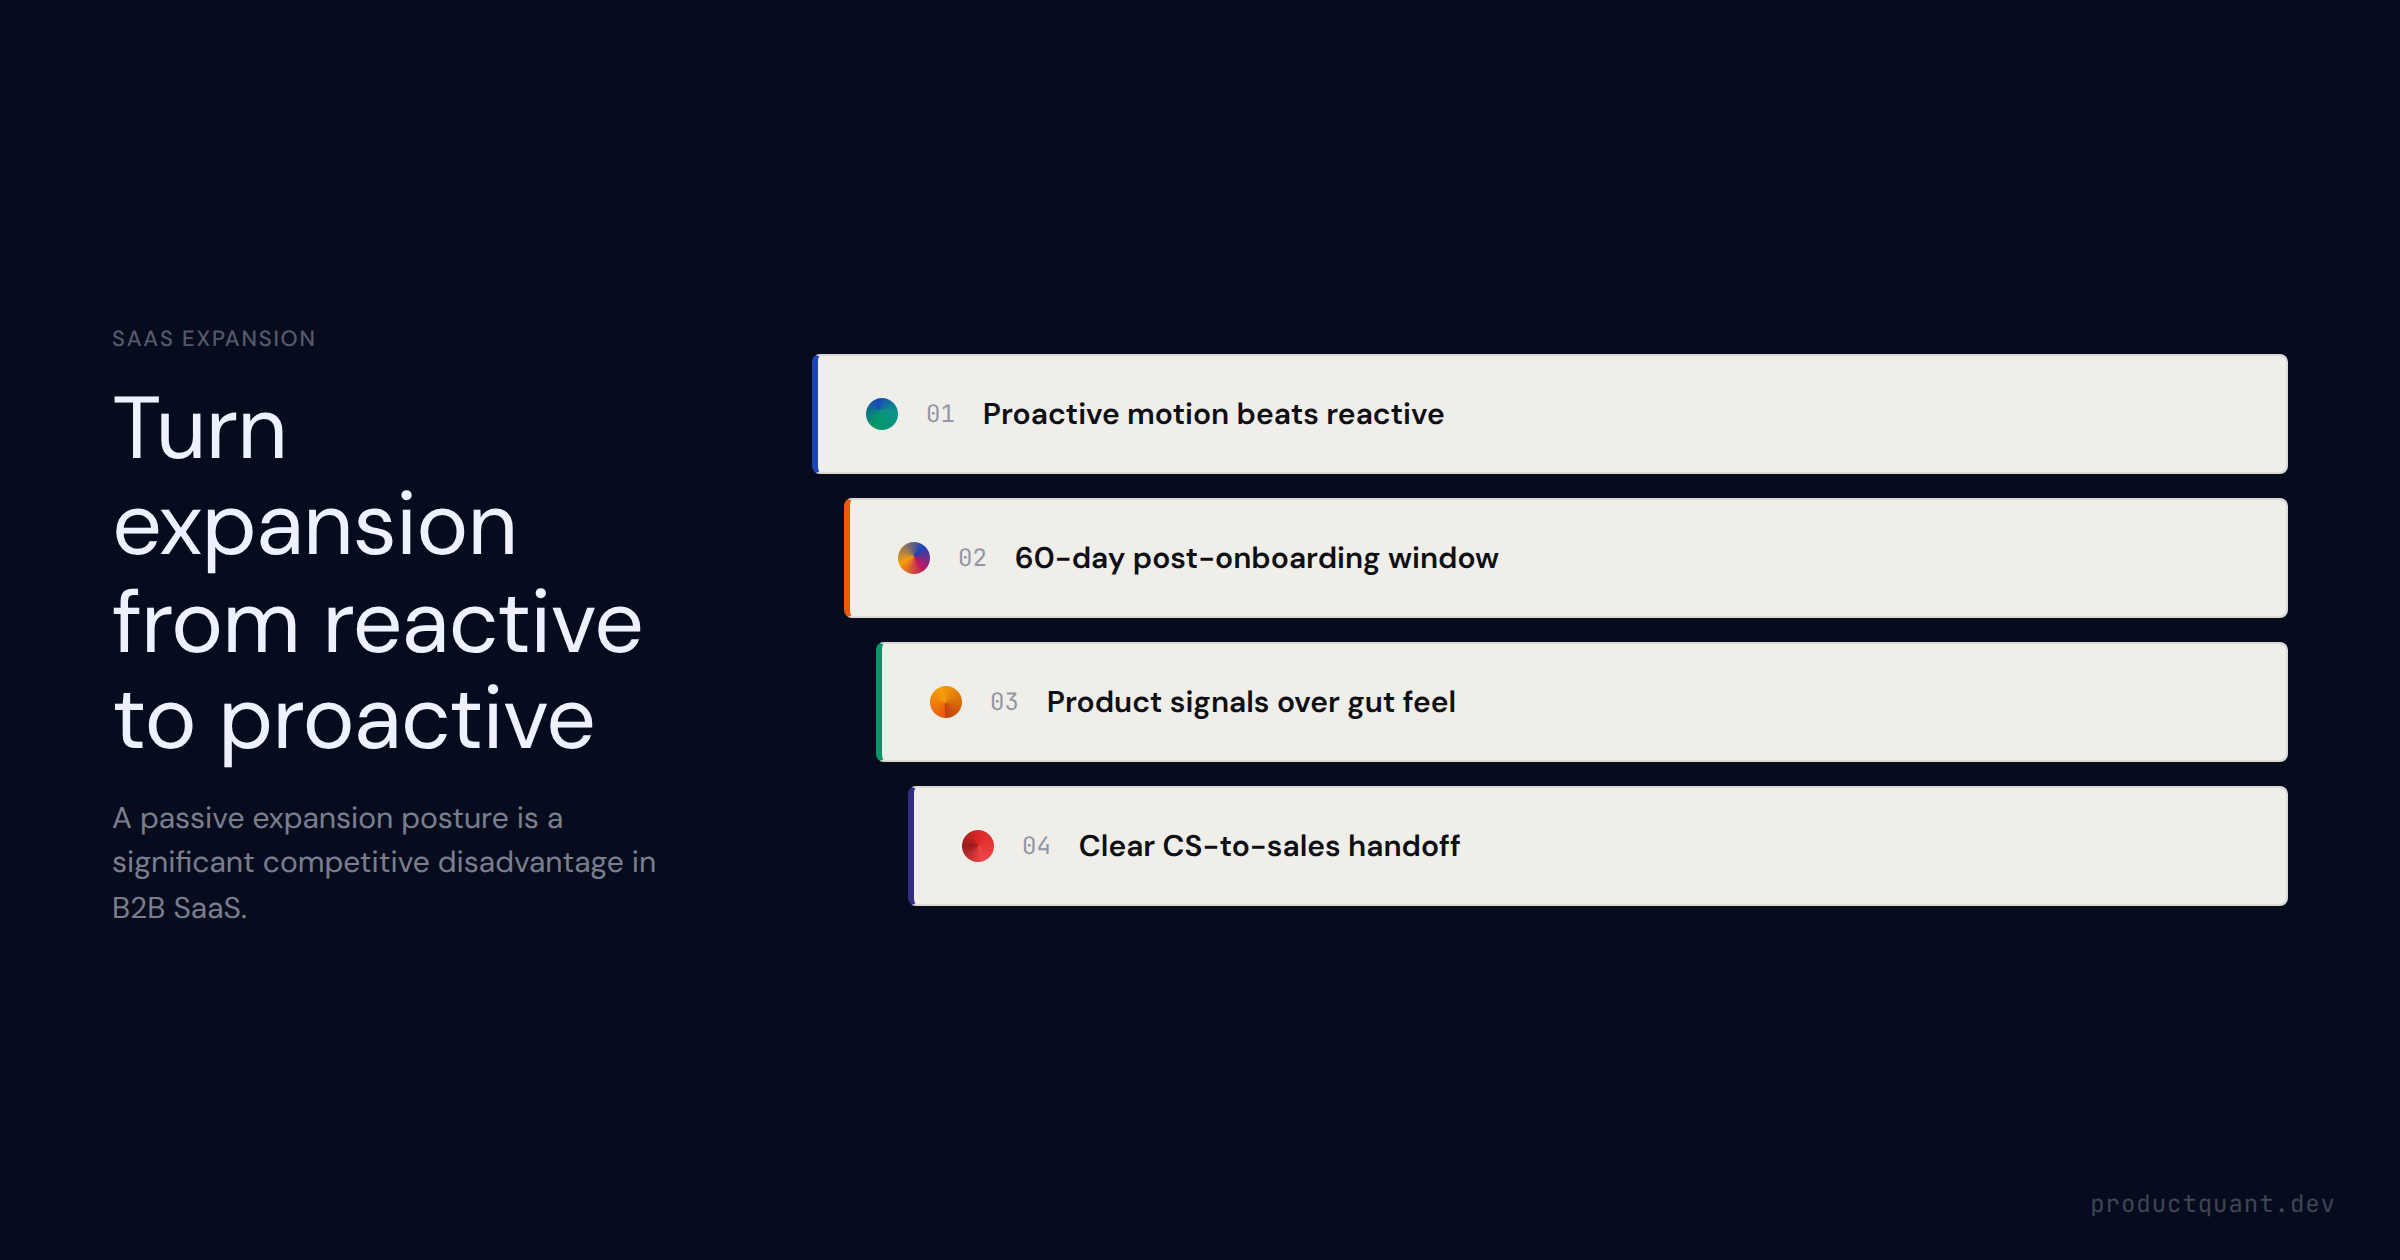
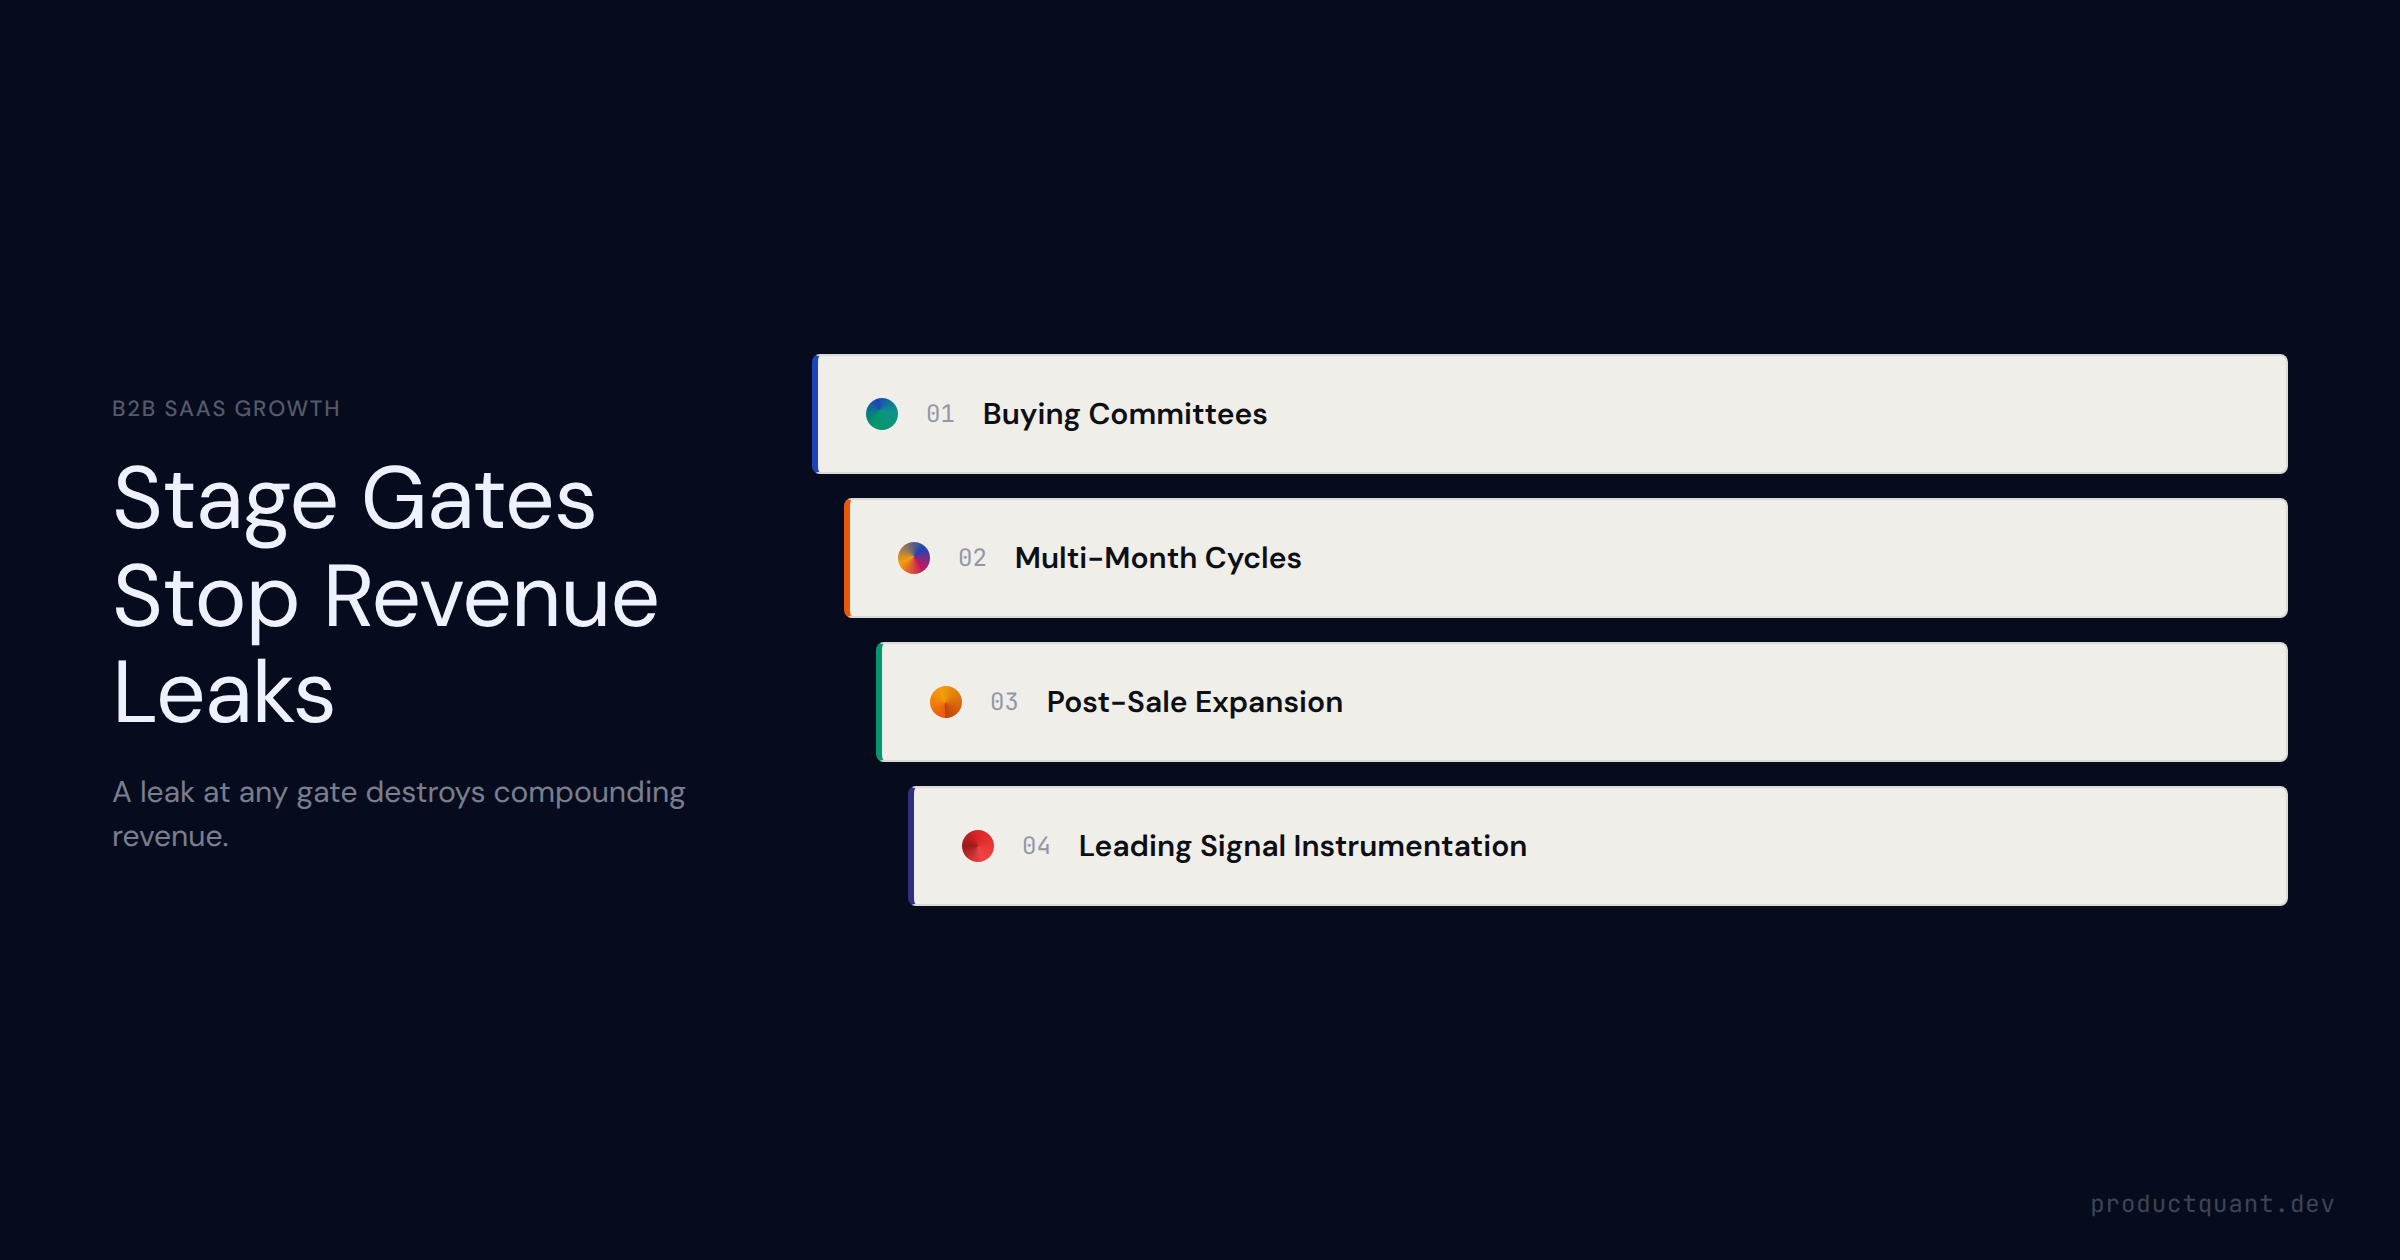
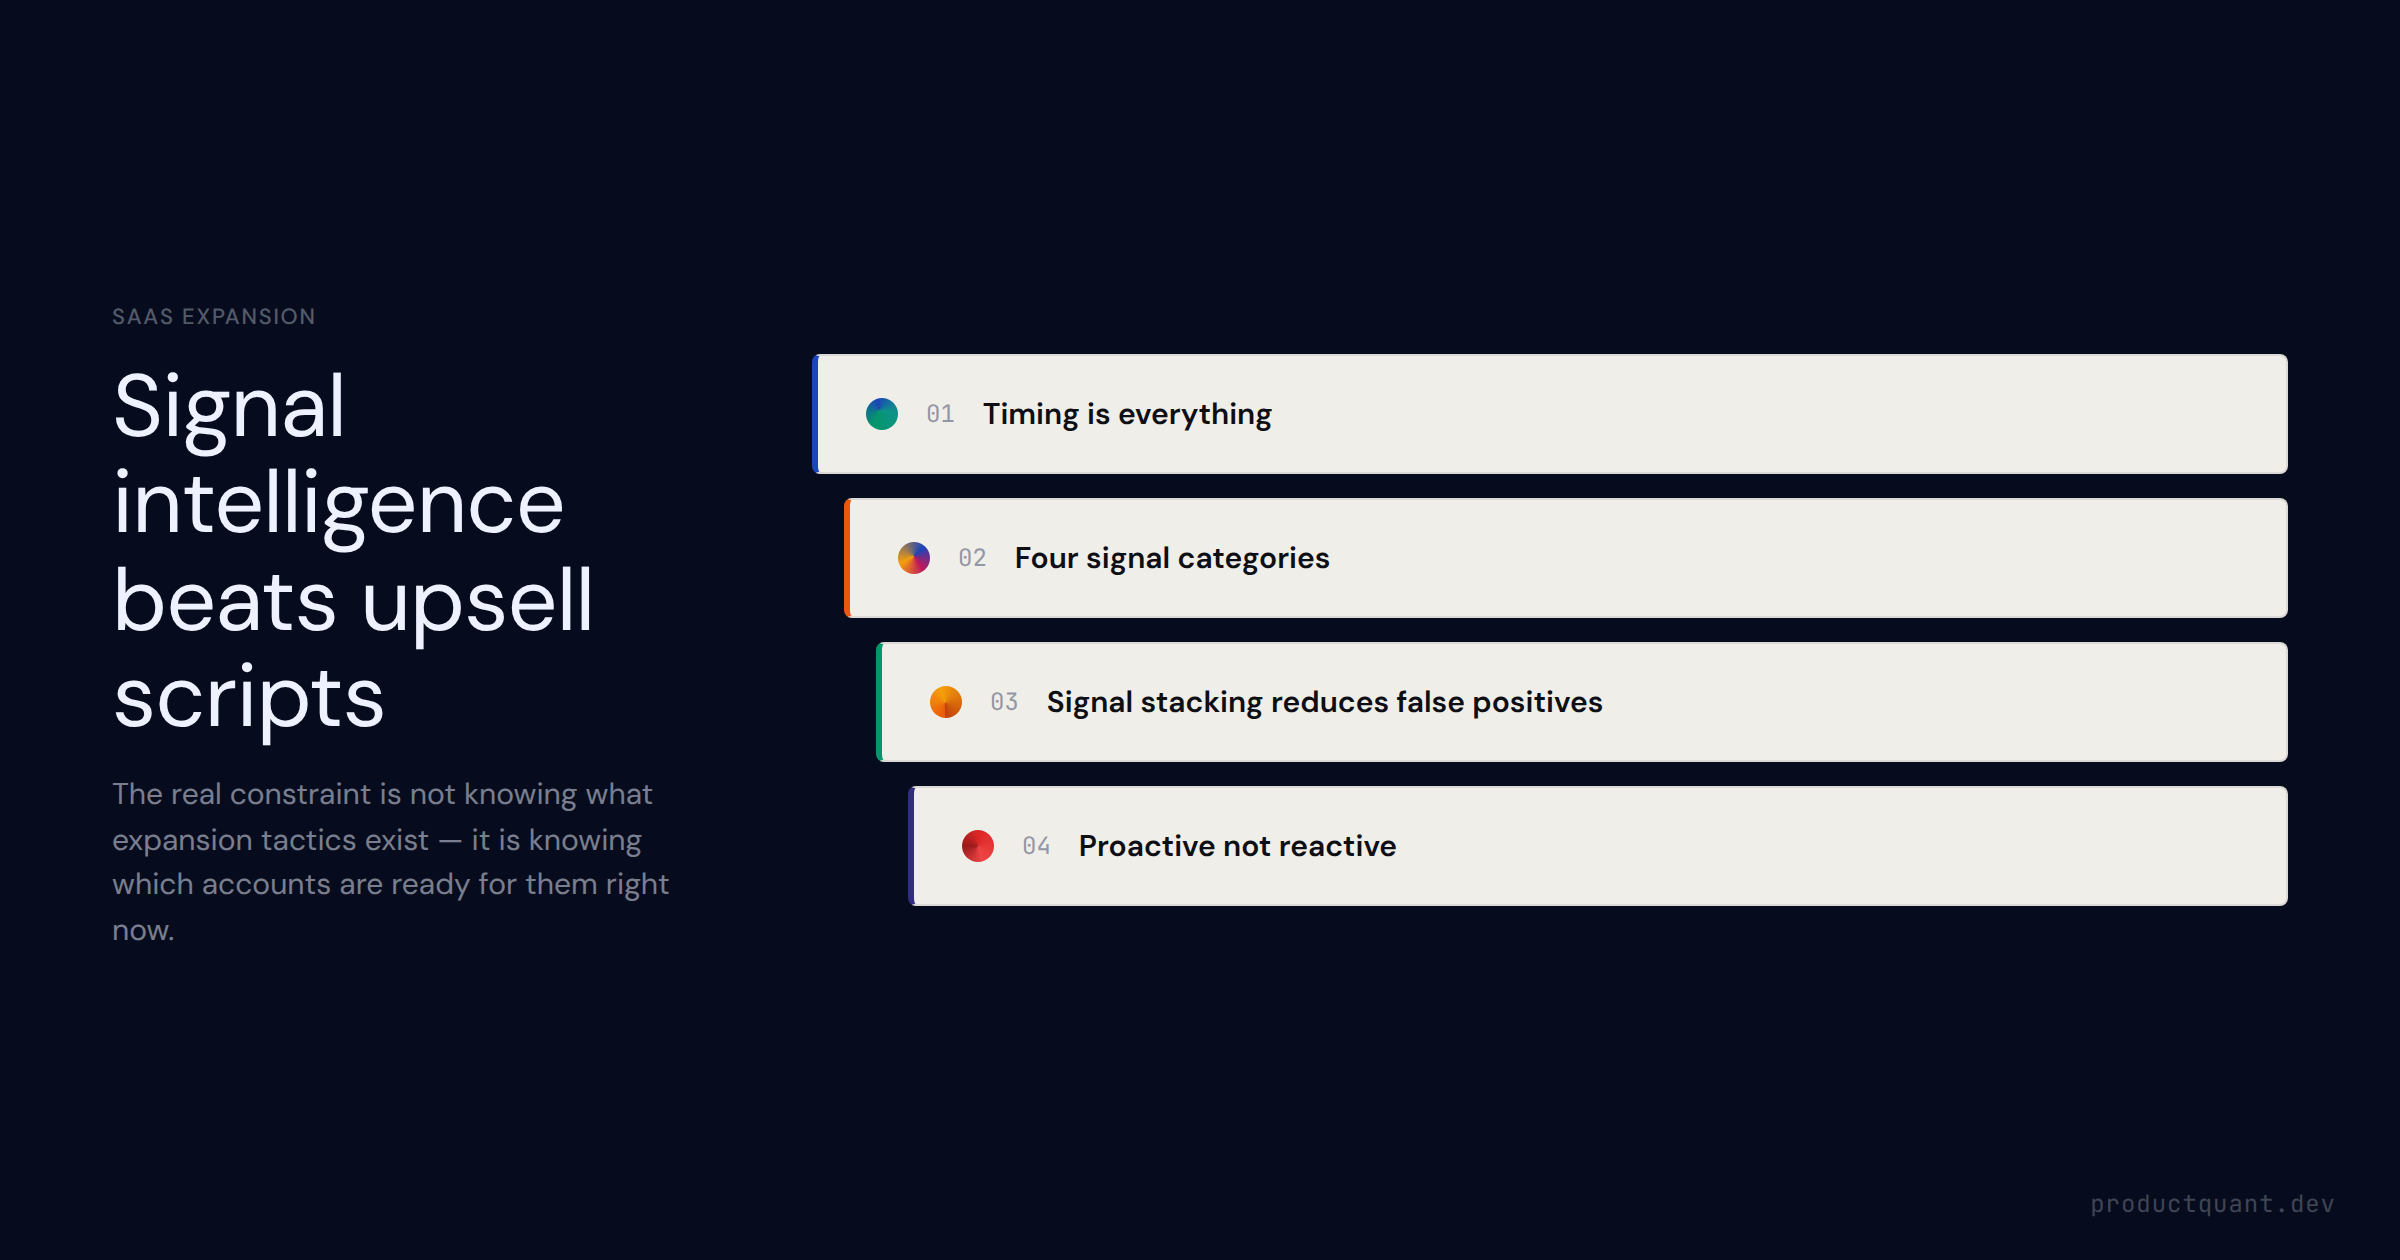
The complete B2B SaaS account expansion playbook: the 4-step motion, 3 expansion types with qualifying conditions, the CS-to-sales handoff problem, usage-based triggers, and the 60-day window that determines whether you
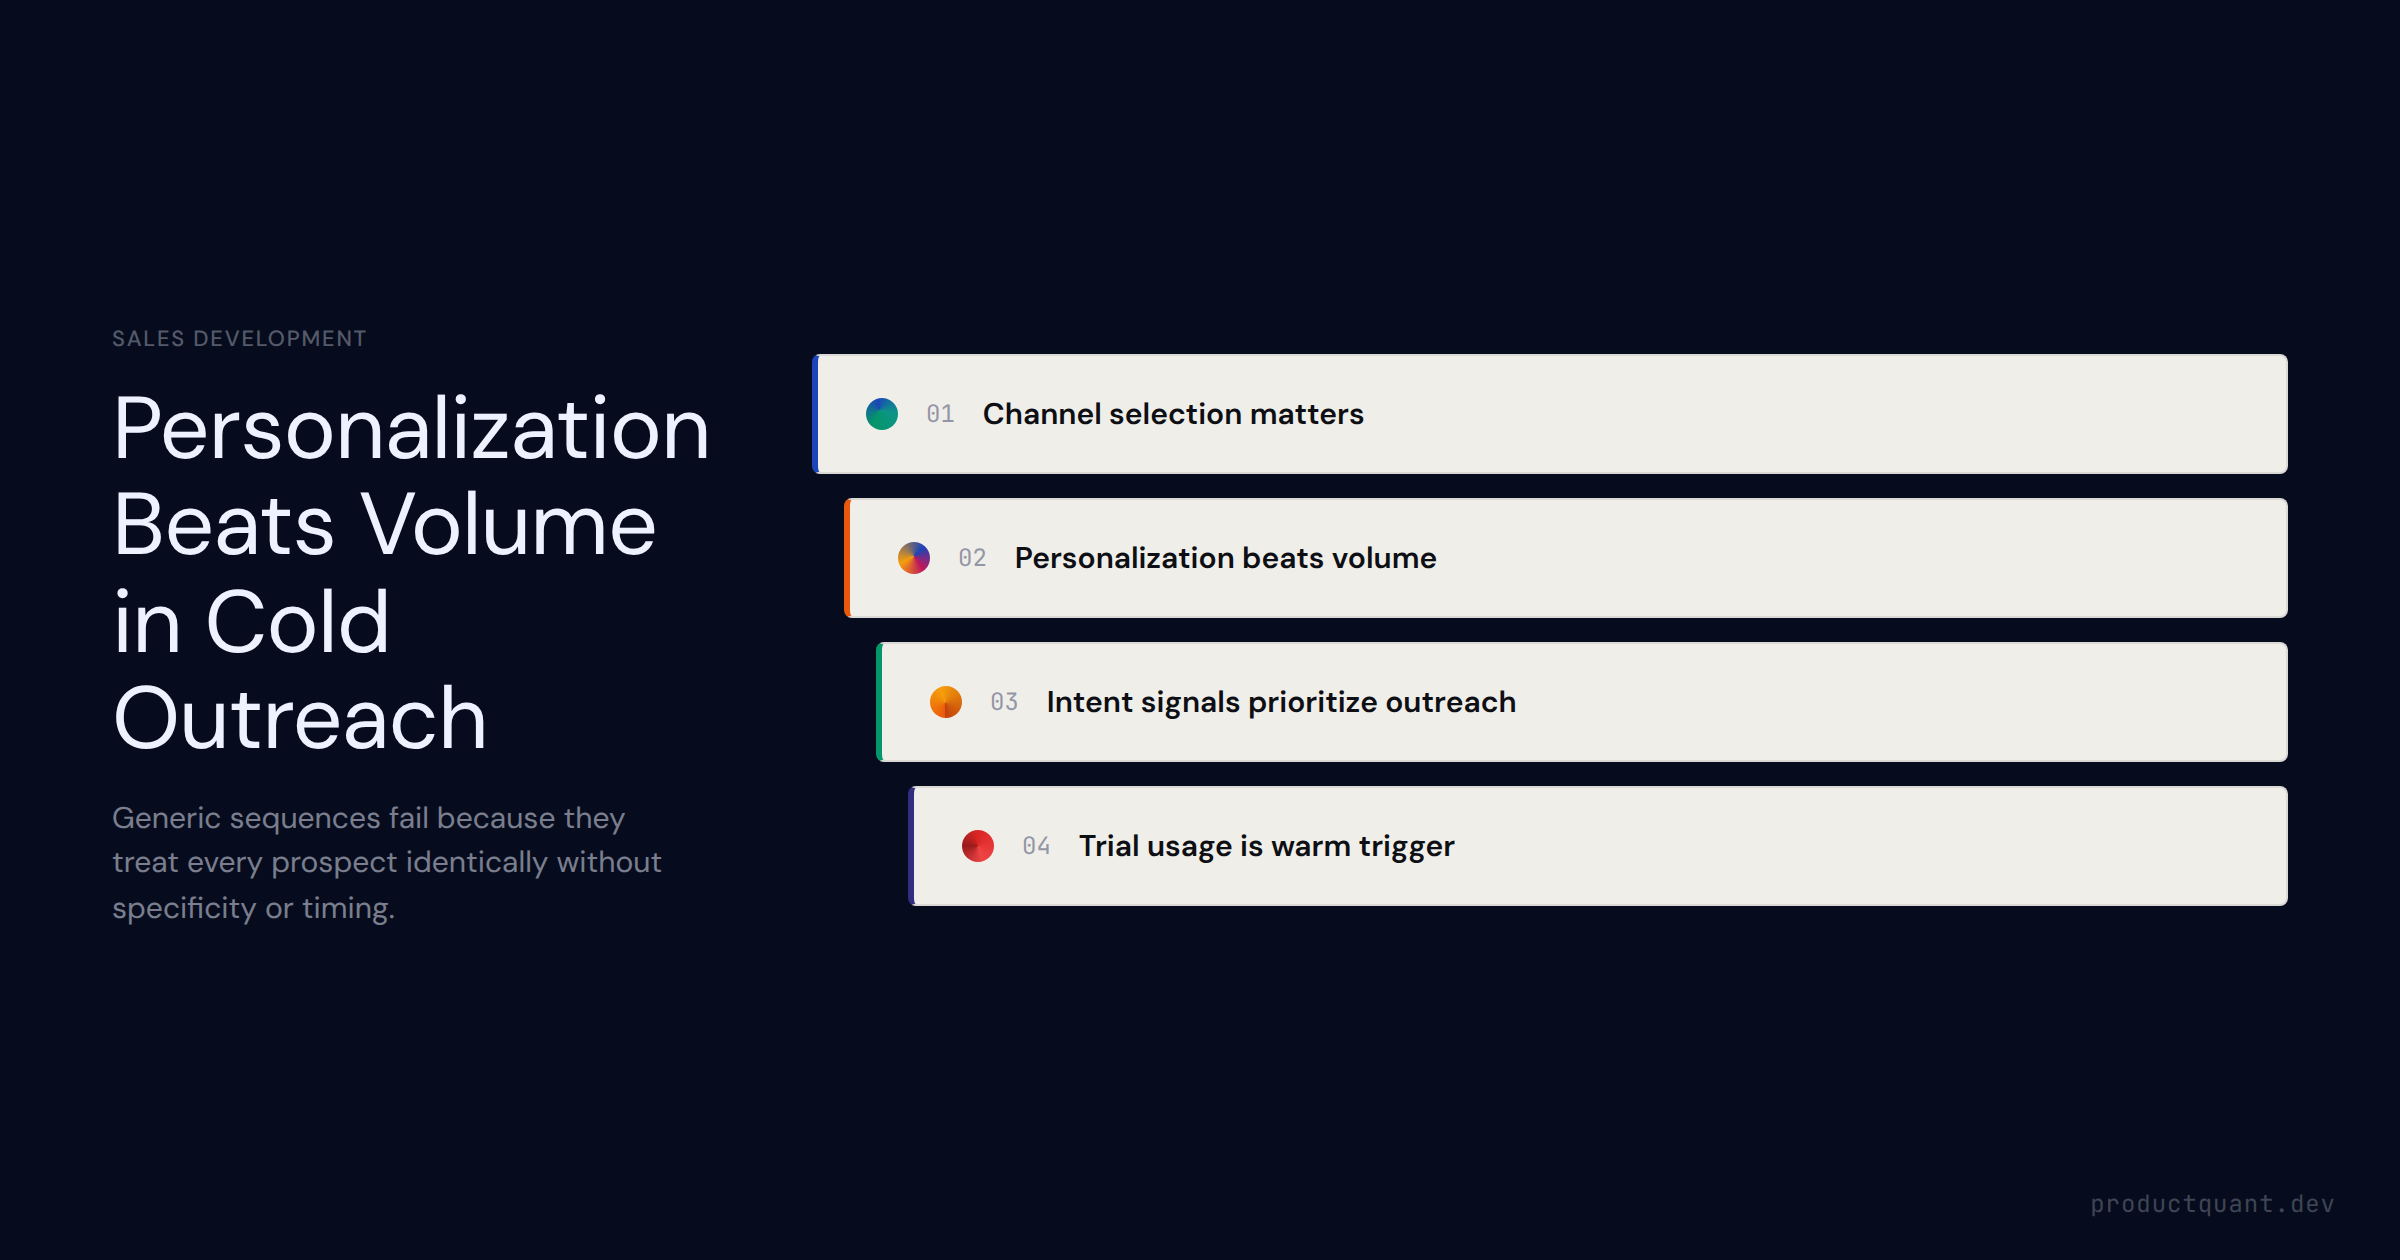
The mechanics of B2B SaaS cold outreach — the 4 channel types, why personalization beats volume in 2024+, the 5-touch sequence structure, how intent signals prioritize outreach, and how trial usage converts cold leads in
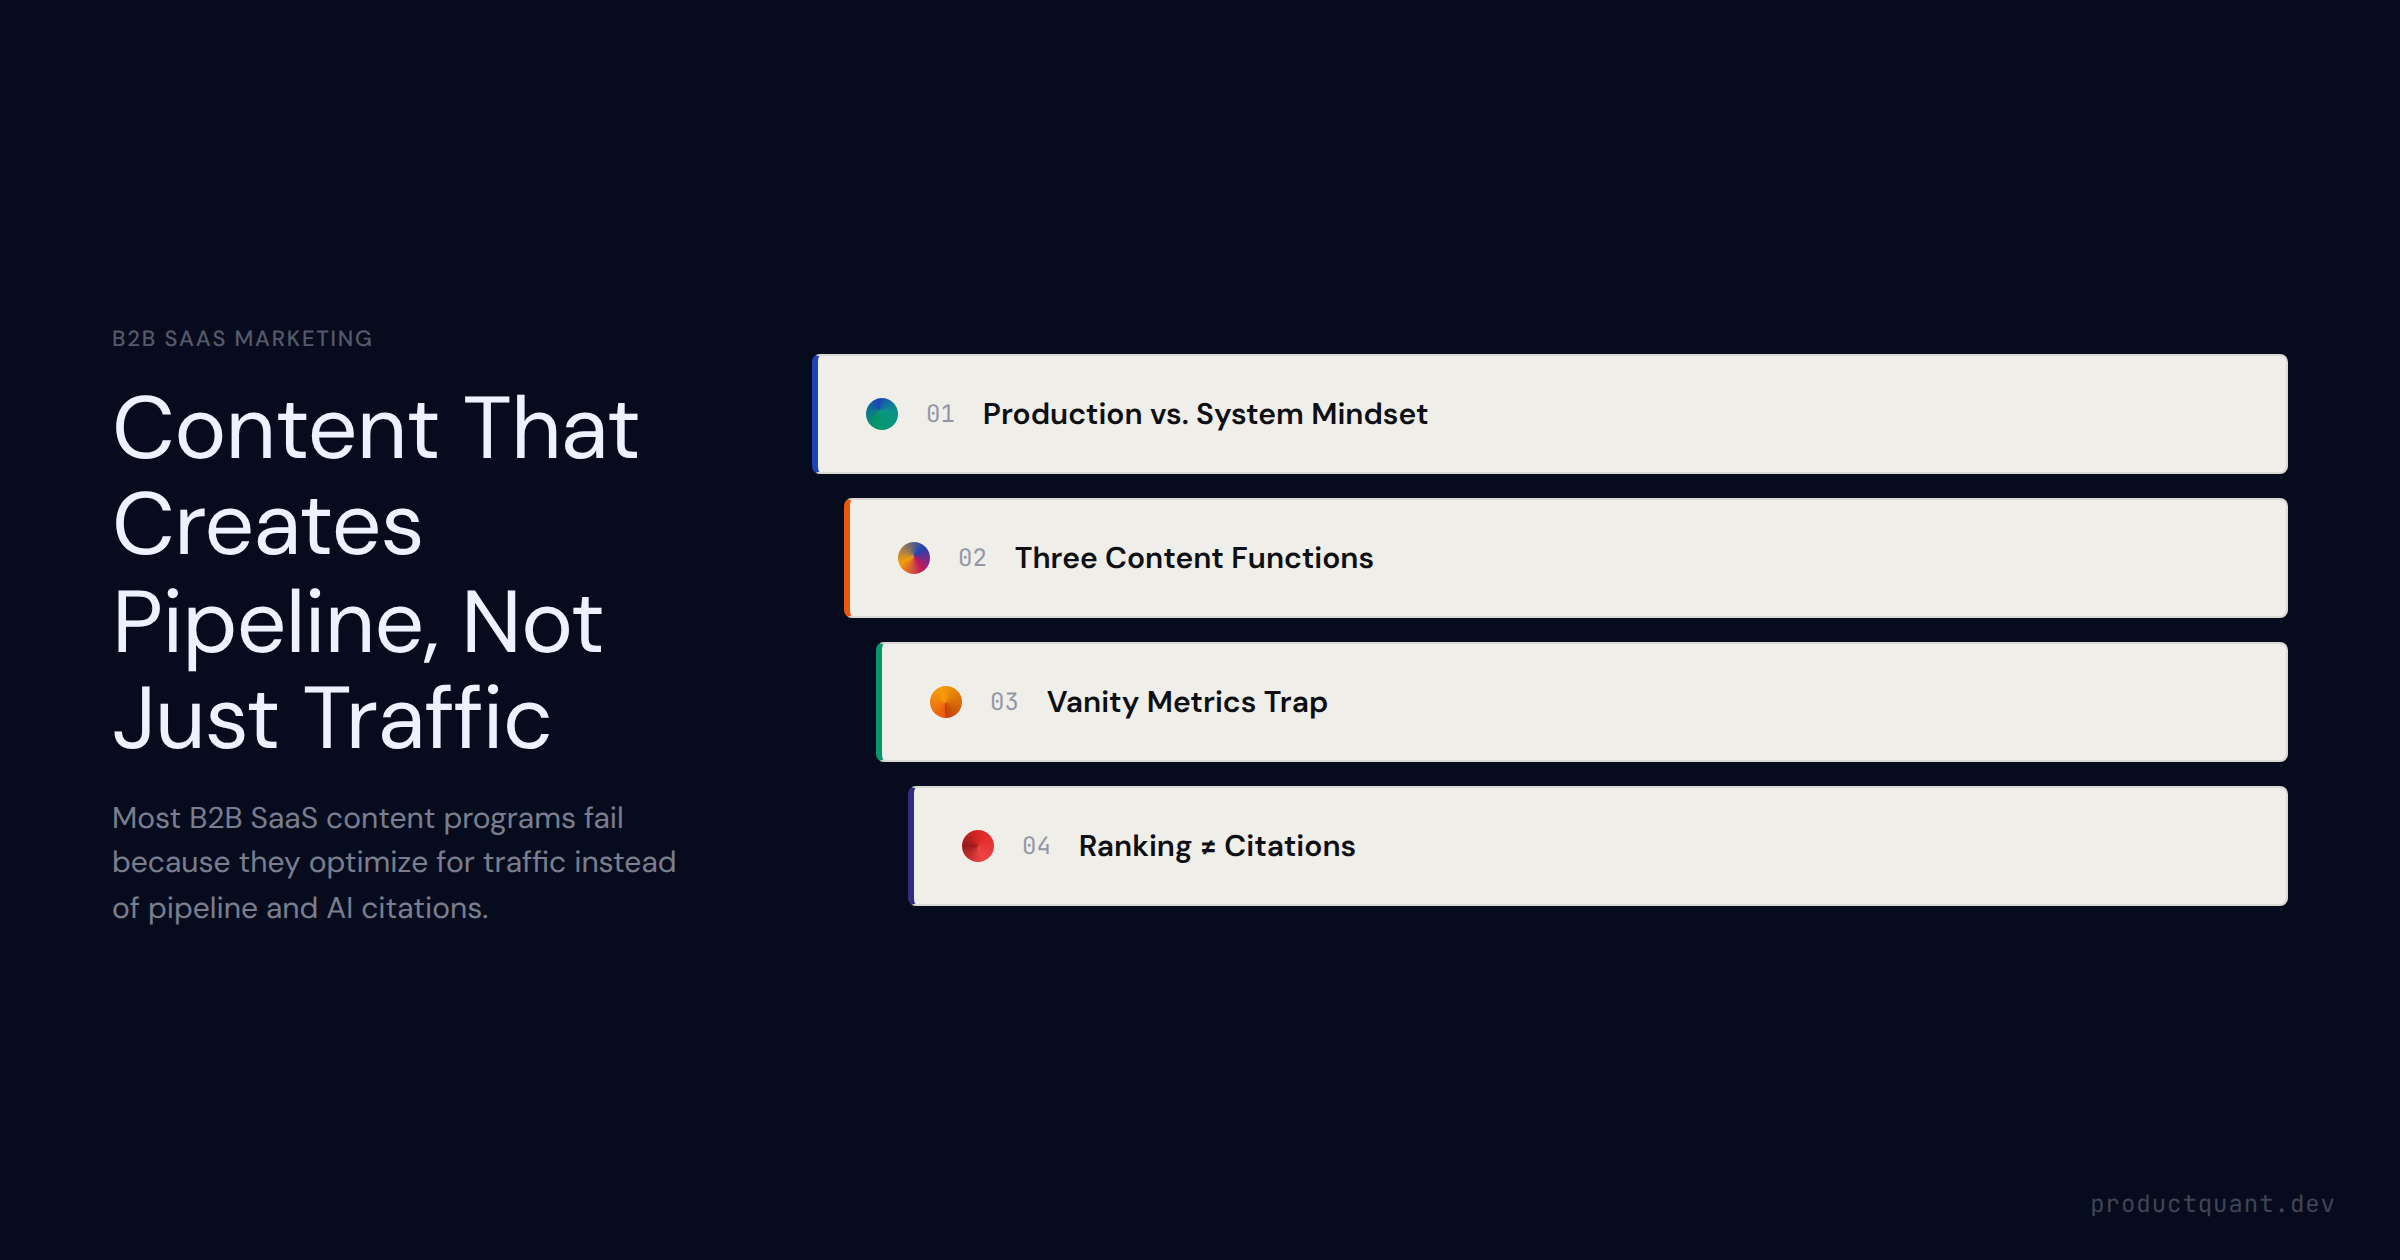
B2B SaaS content marketing serves three functions at once: demand creation, SEO, and AI citation (GEO). Most companies optimize for clicks. Here is how to build a content system that compounds.
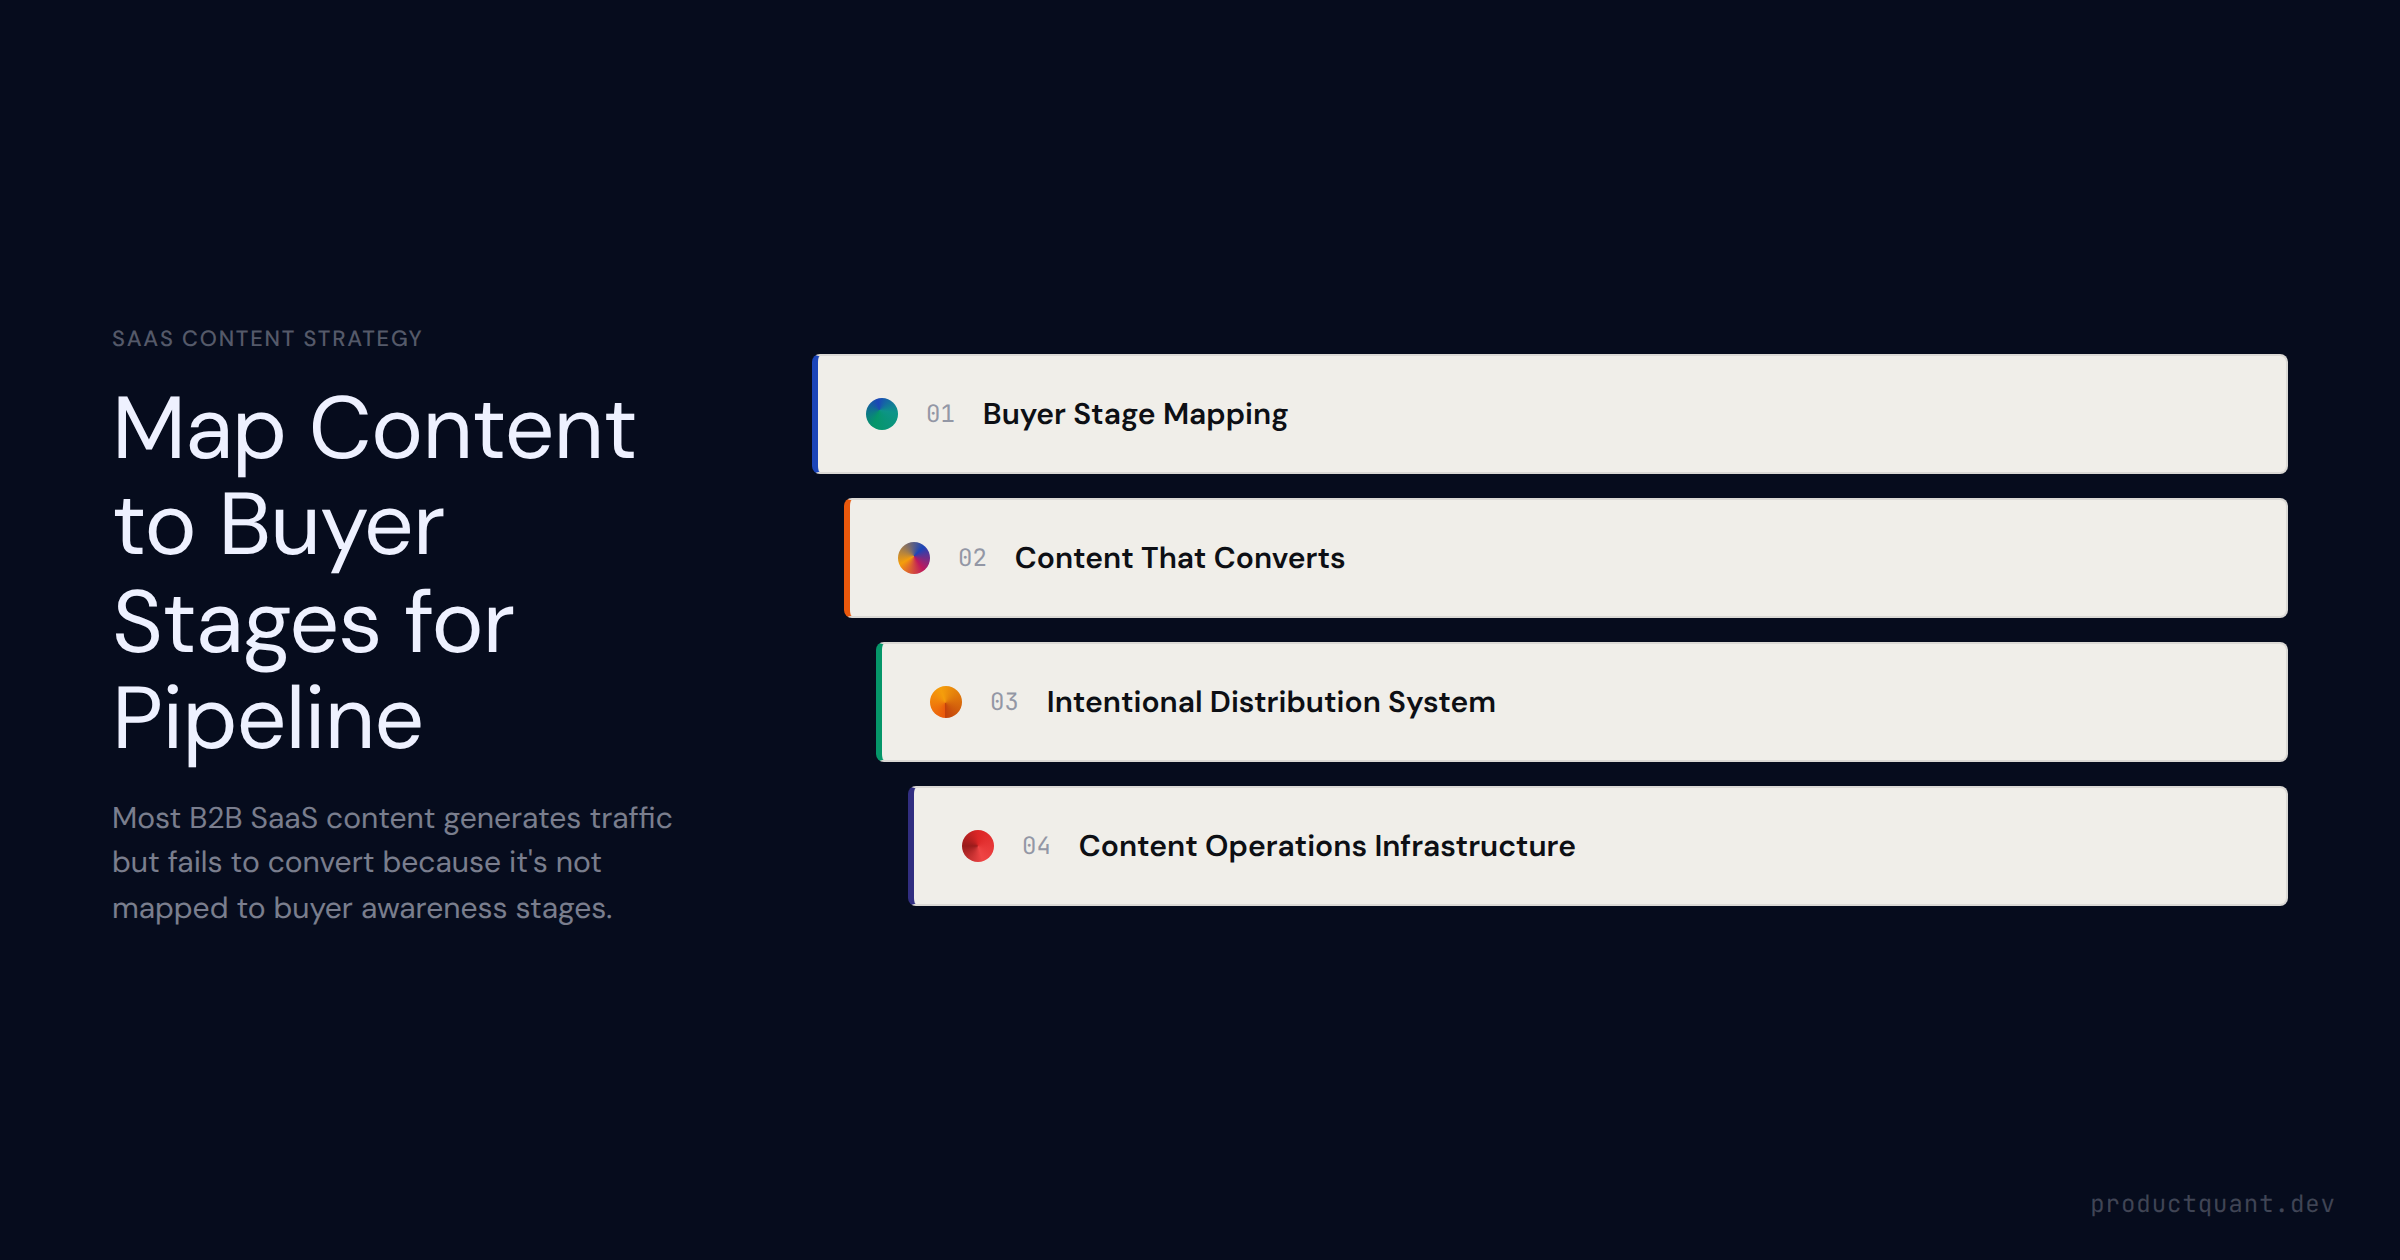
How B2B SaaS companies build a content strategy that generates compounding organic pipeline — buyer awareness stage model, funnel mapping, distribution channels, and the content ops infrastructure that makes it sustainab
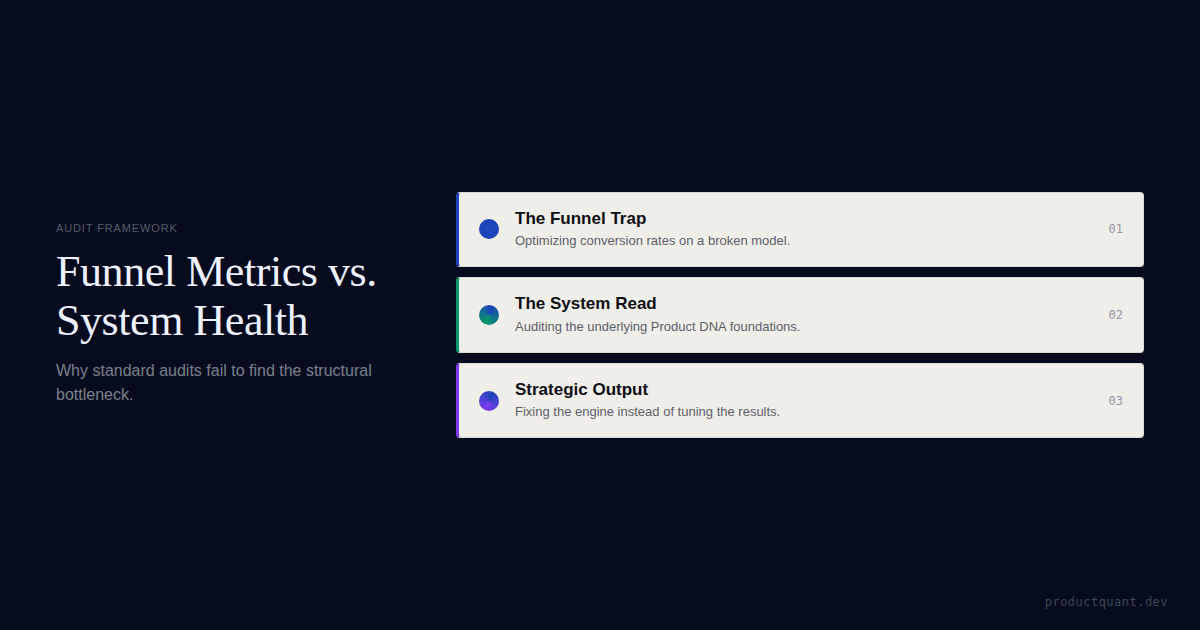
The complete B2B SaaS conversion funnel — 5 stages, where the largest conversion losses happen, how to diagnose which stage is your actual constraint, and the metrics at each stage.
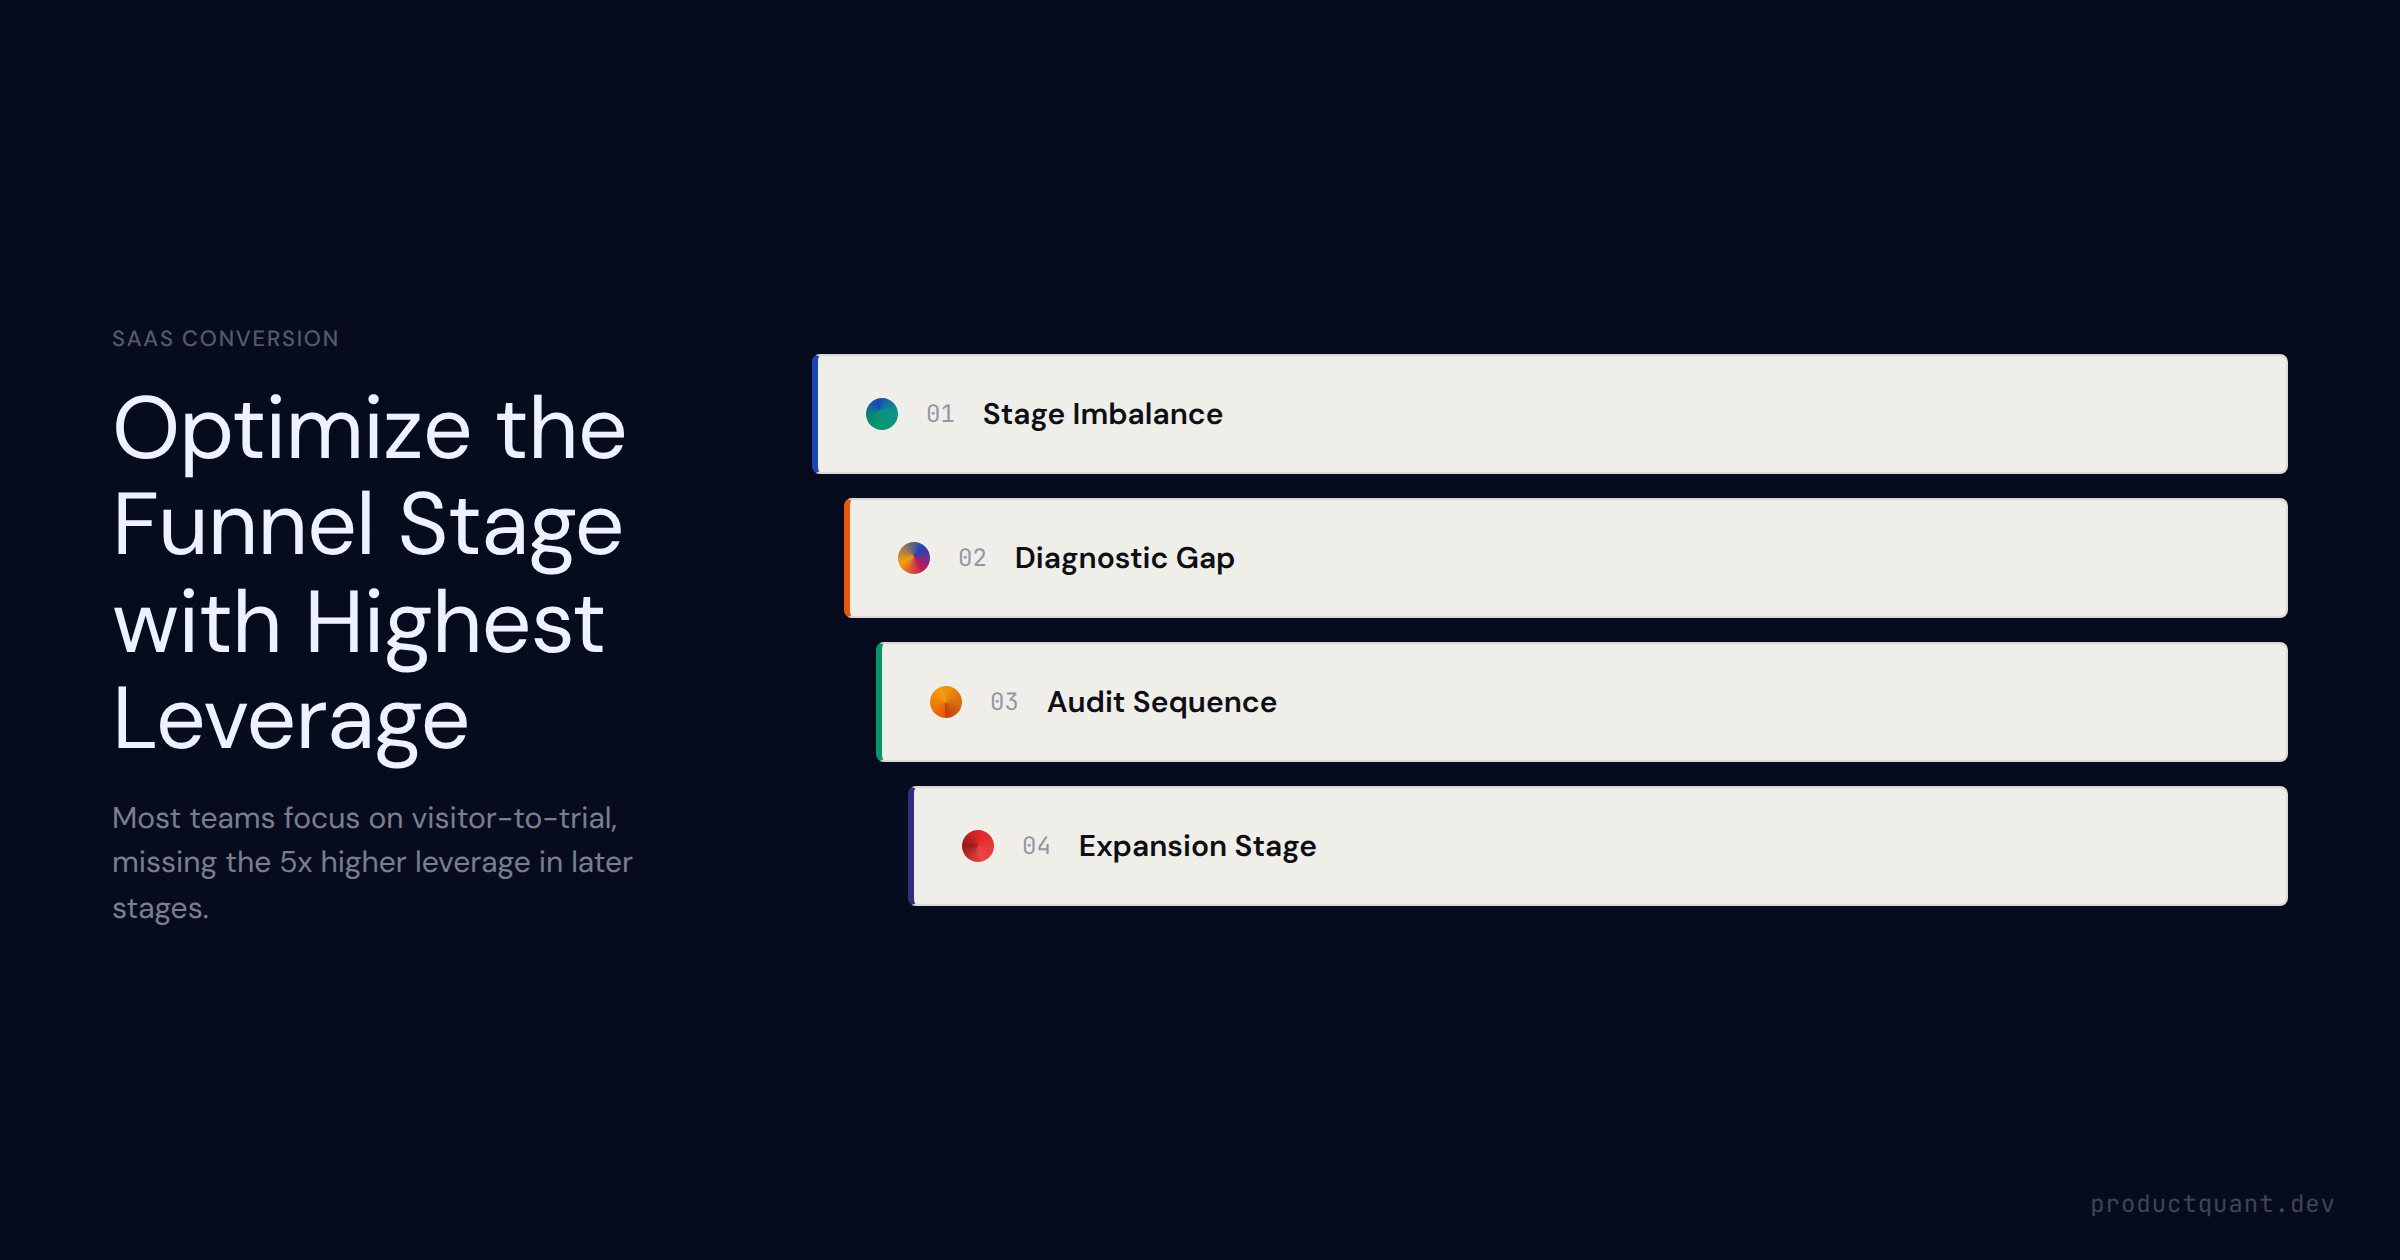
Benchmarks and the top 3 levers for each of the 4 B2B SaaS conversion stages — visitor→trial, trial→activated, activated→paid, customer→expansion — plus why most CRO programs optimize the wrong stage.
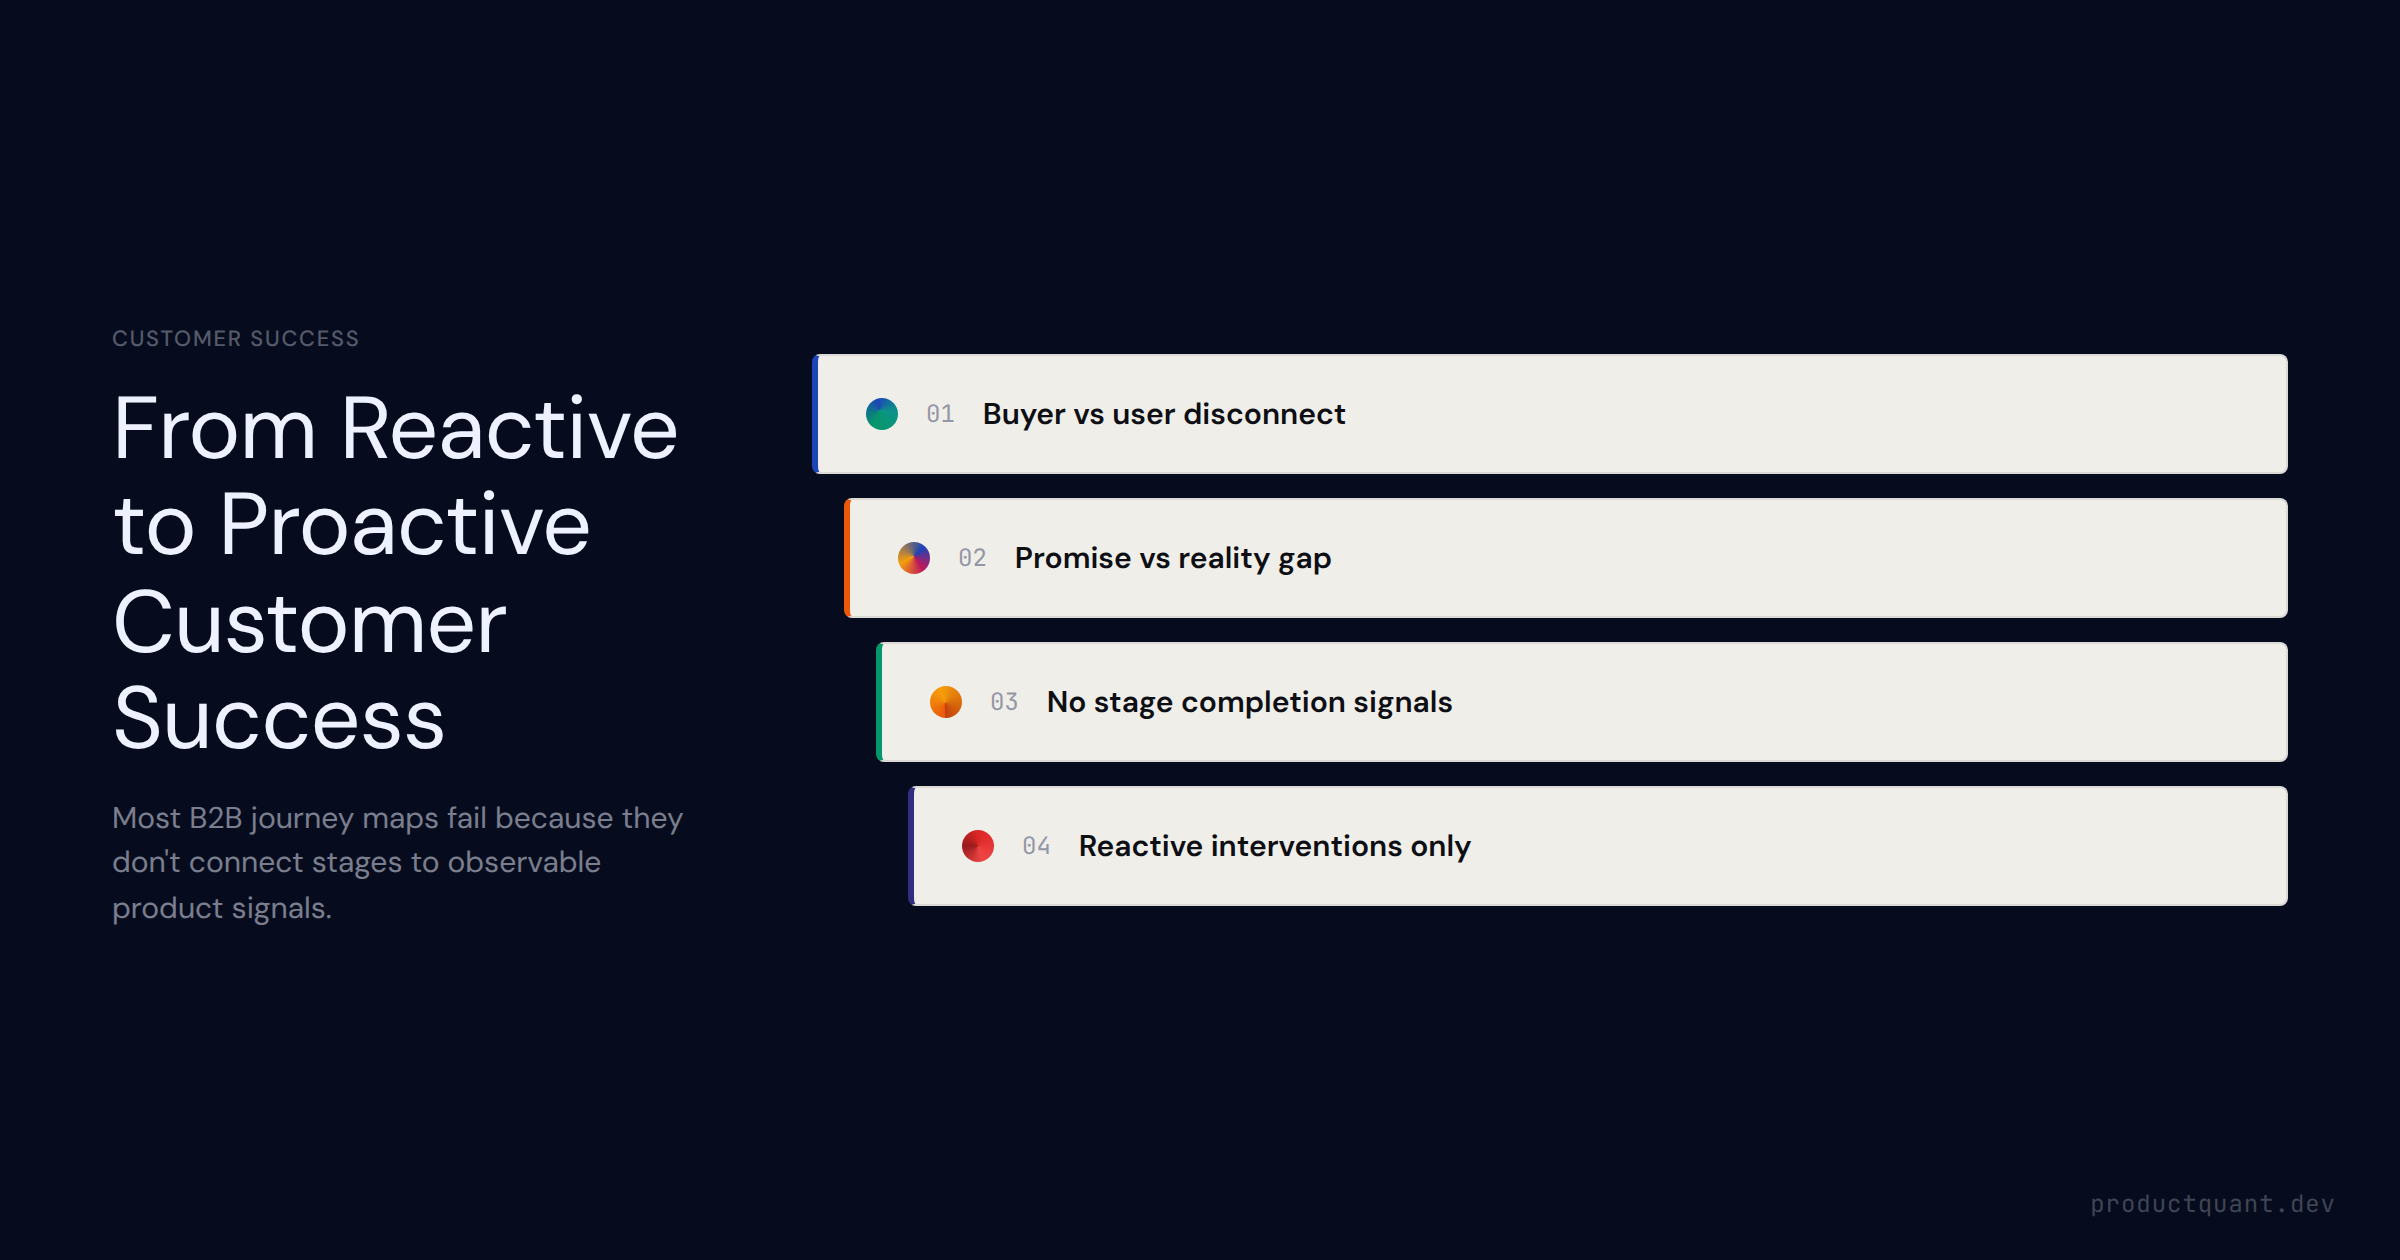
How to build a B2B SaaS customer journey map that reflects reality — the 5-stage framework from awareness to expansion, why assumption-built maps fail, jobs-to-be-done vs. funnel framing, and how product usage data expos
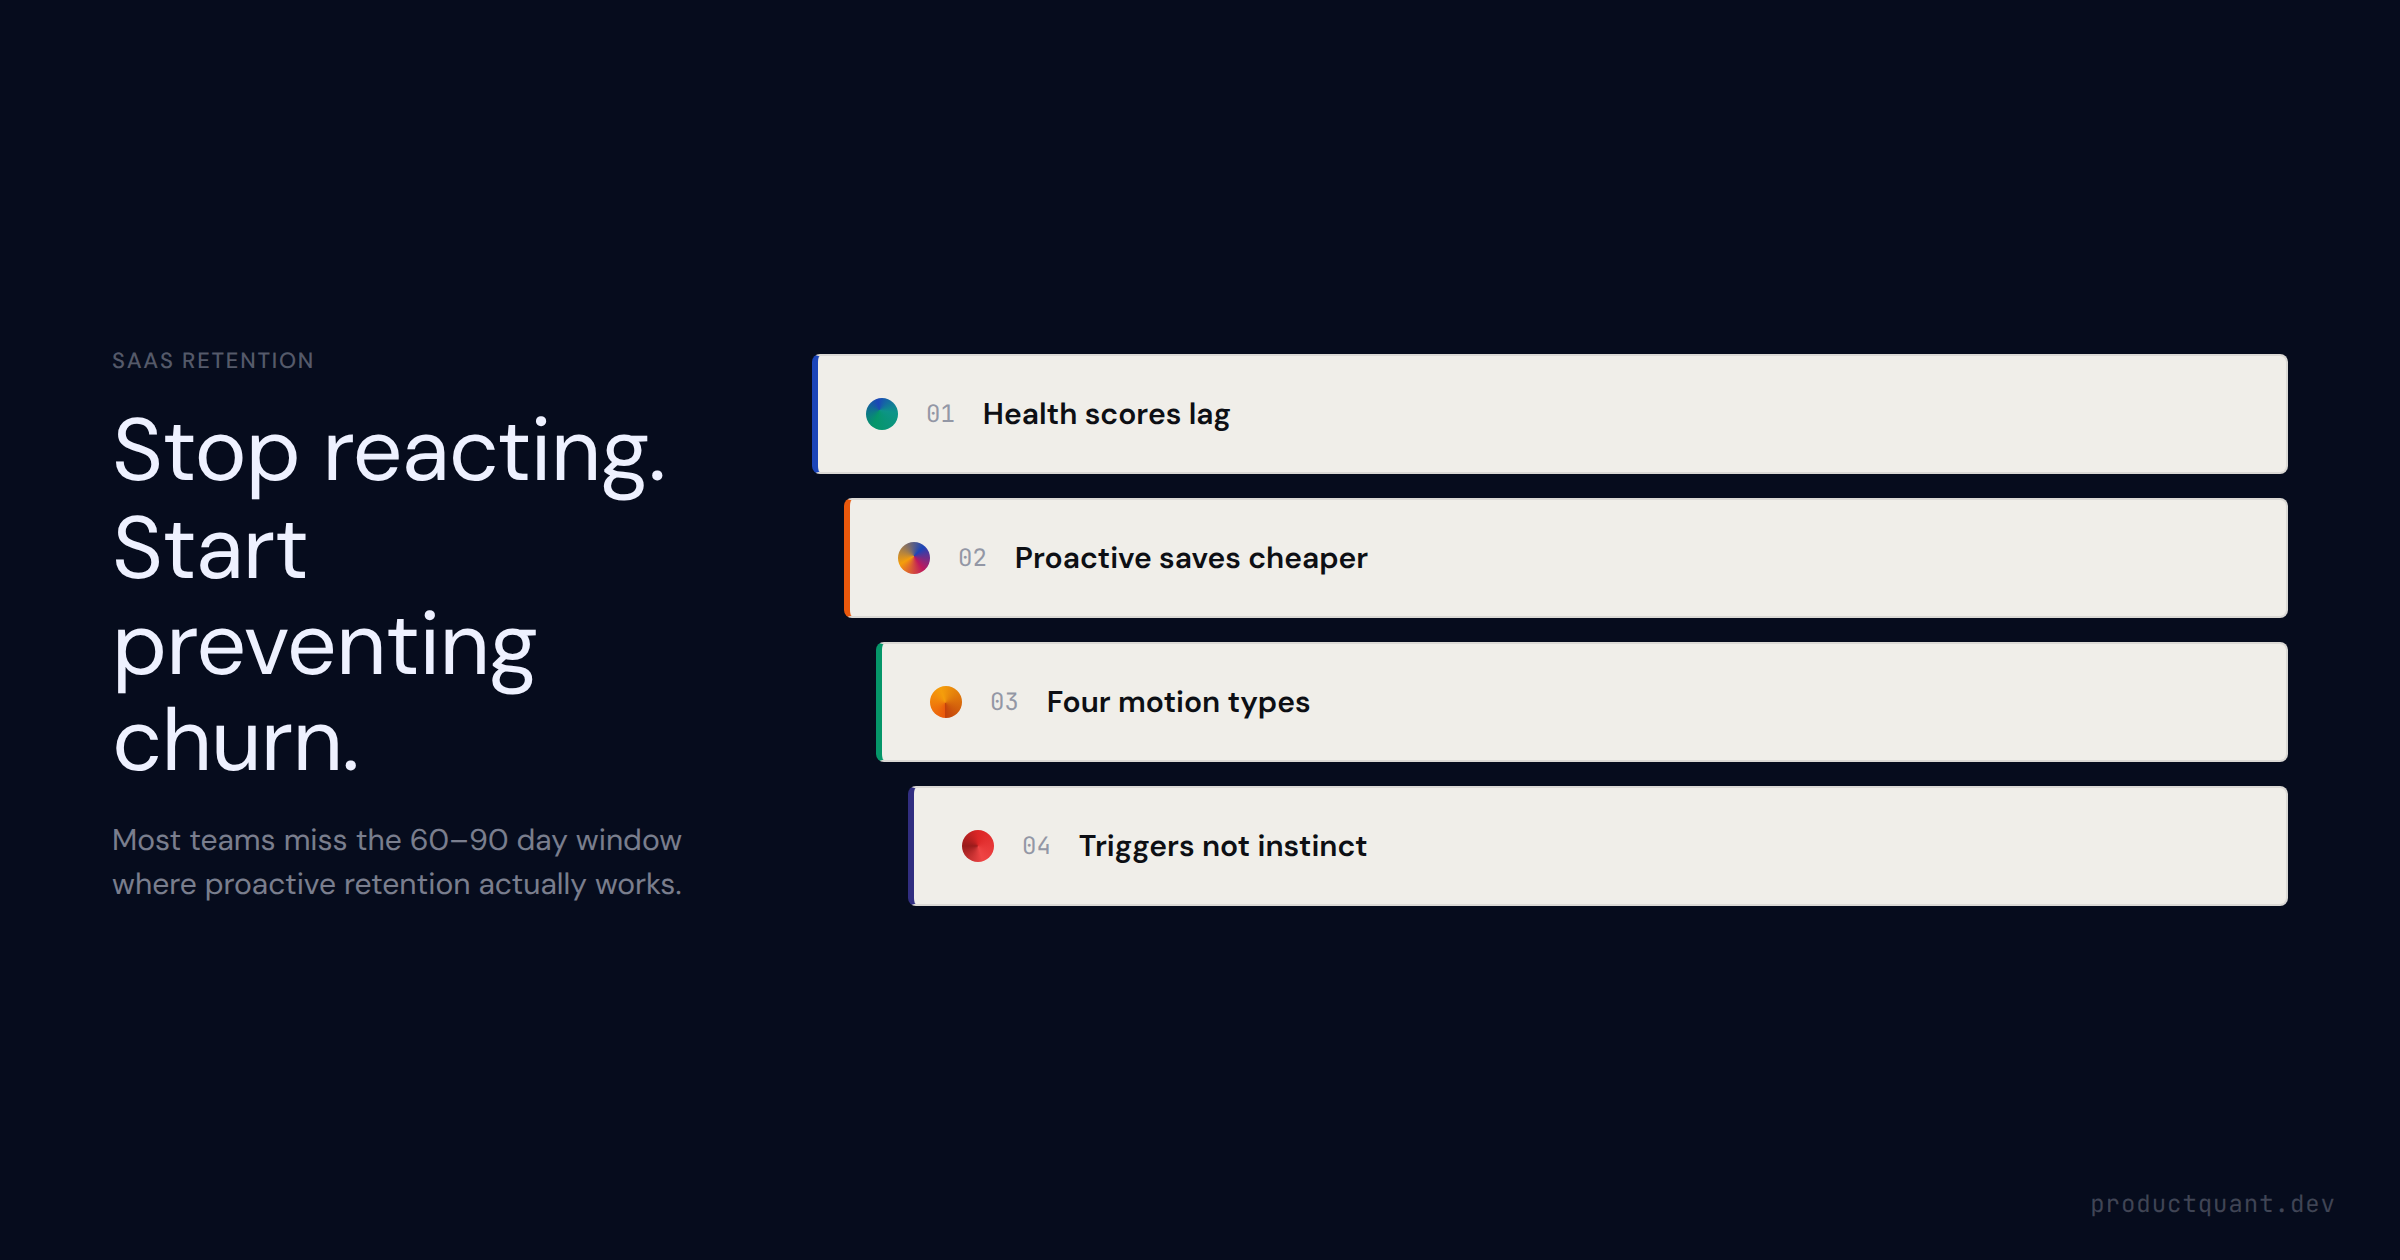
Most B2B SaaS teams act on churn too late. Learn the 4 retention motion types, why late-stage saves cost 3–7x more than early interventions, and how to build a retention playbook from trigger to outcome.
The four demand gen channels in B2B SaaS — content, paid, community, partner — with CAC, time-to-pipeline, and scalability for each, and why most demand gen programs fail by optimizing for MQL volume instead of pipeline.
The three GTM motions in B2B SaaS — sales-led, marketing-led, product-led — how to select the right one for your ACV and team size, and the signals that tell you whether your GTM motion is working or just busy.

Most B2B SaaS growth agencies sell retainers. The best ones embed into your product and run the system. Here is how to tell the difference before you sign.
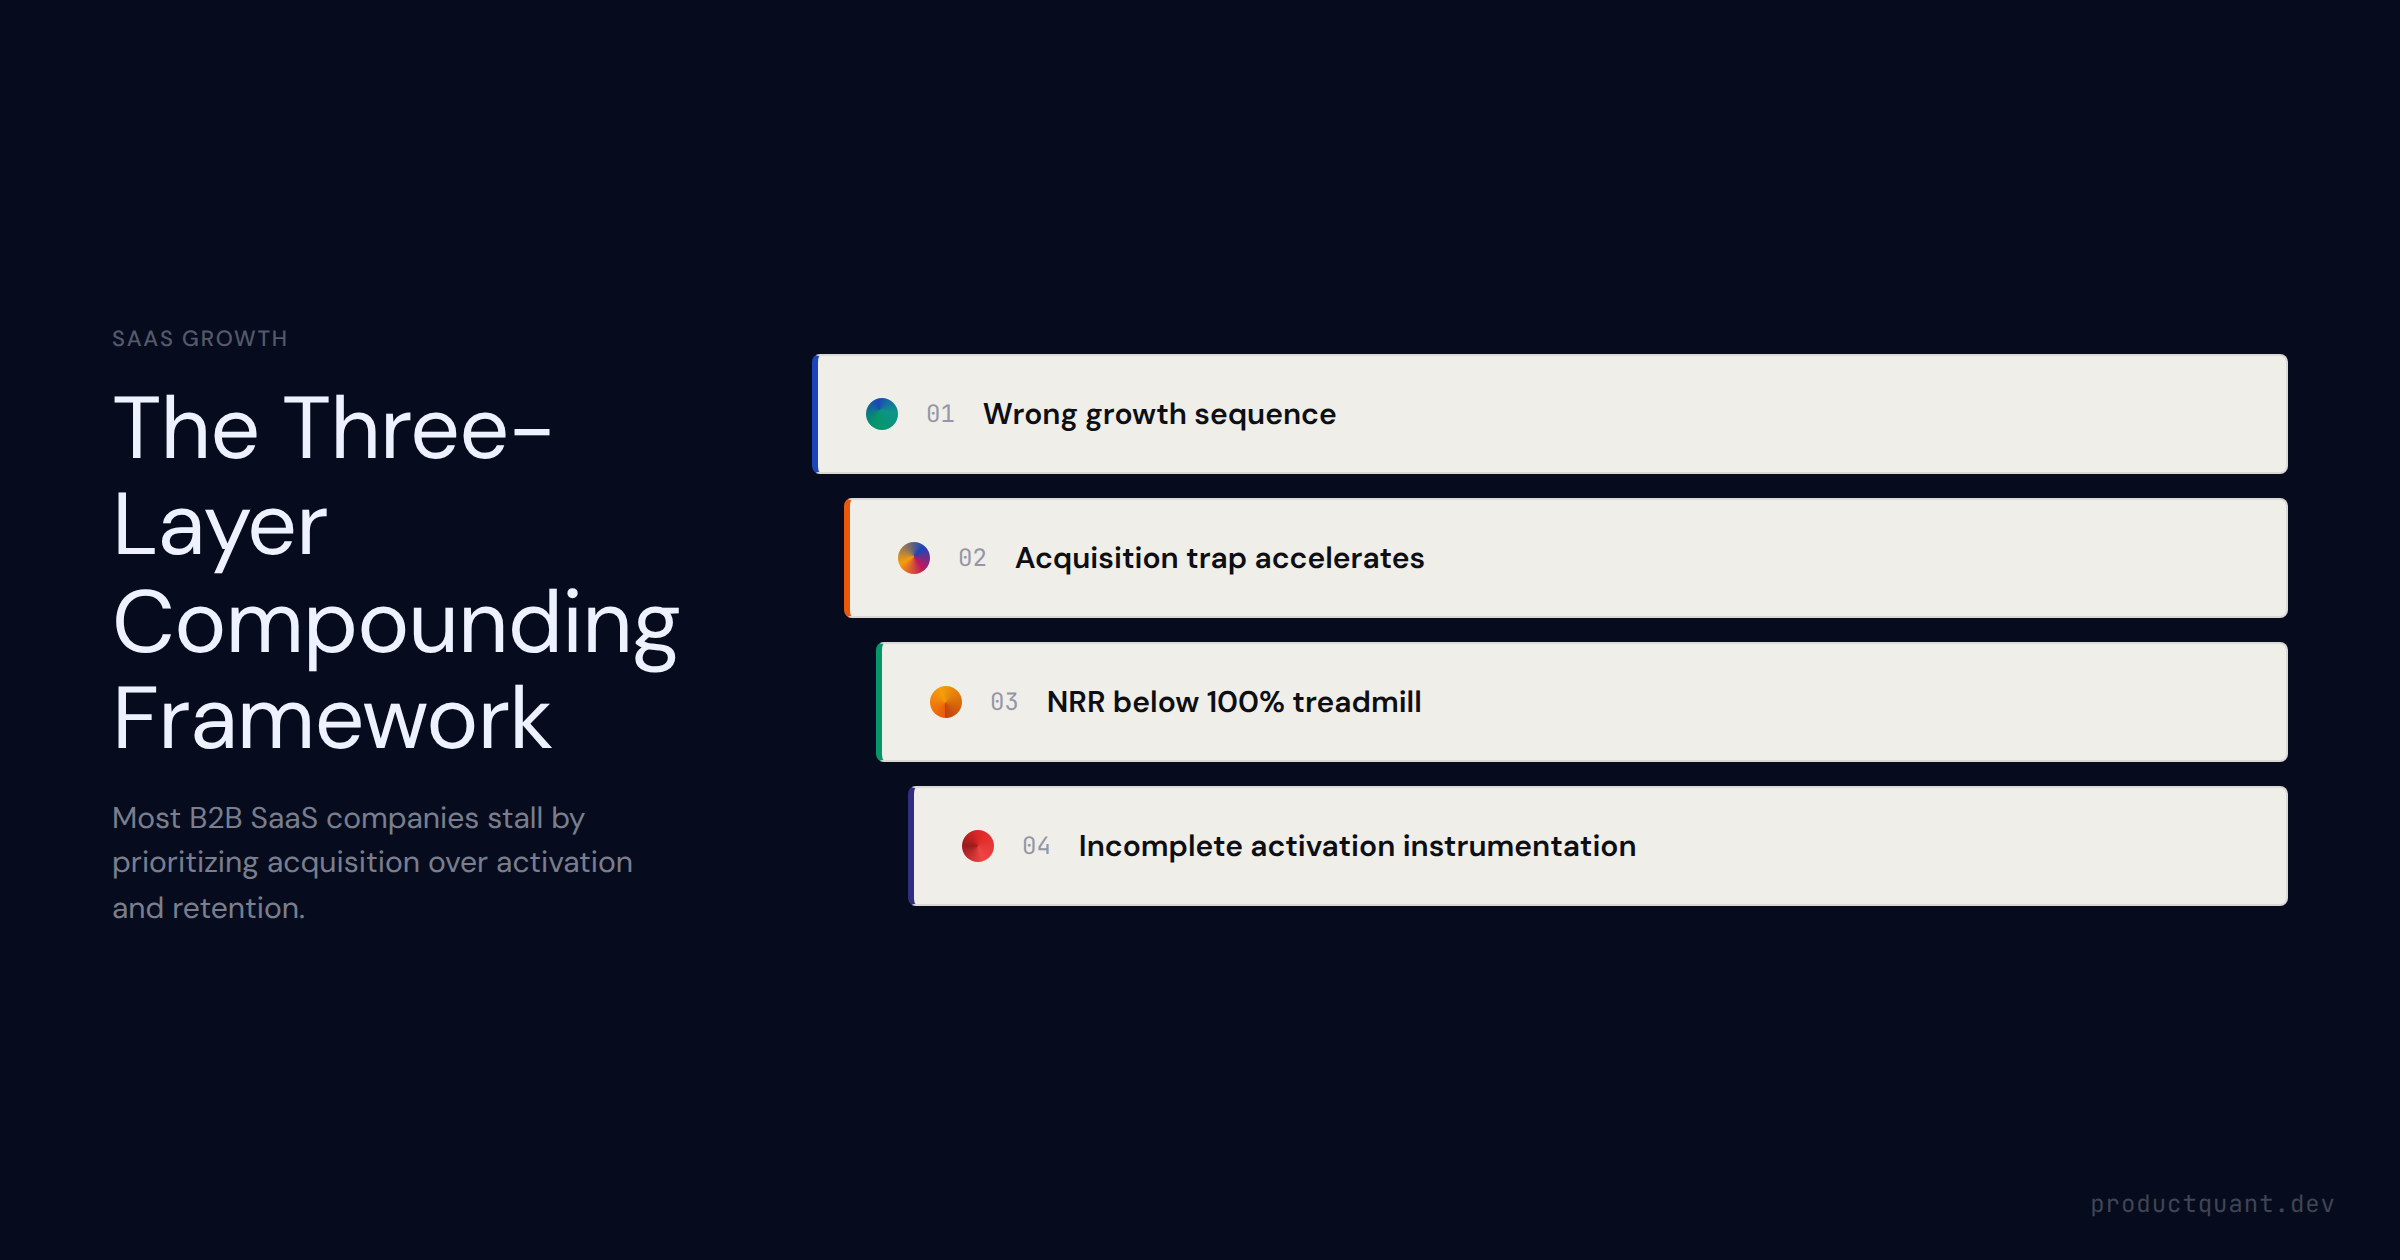
Most B2B SaaS companies sequence their growth work in the wrong order. Here is the three-layer framework — acquisition, activation, expansion — and how to build a system that compounds at every ARR stage.
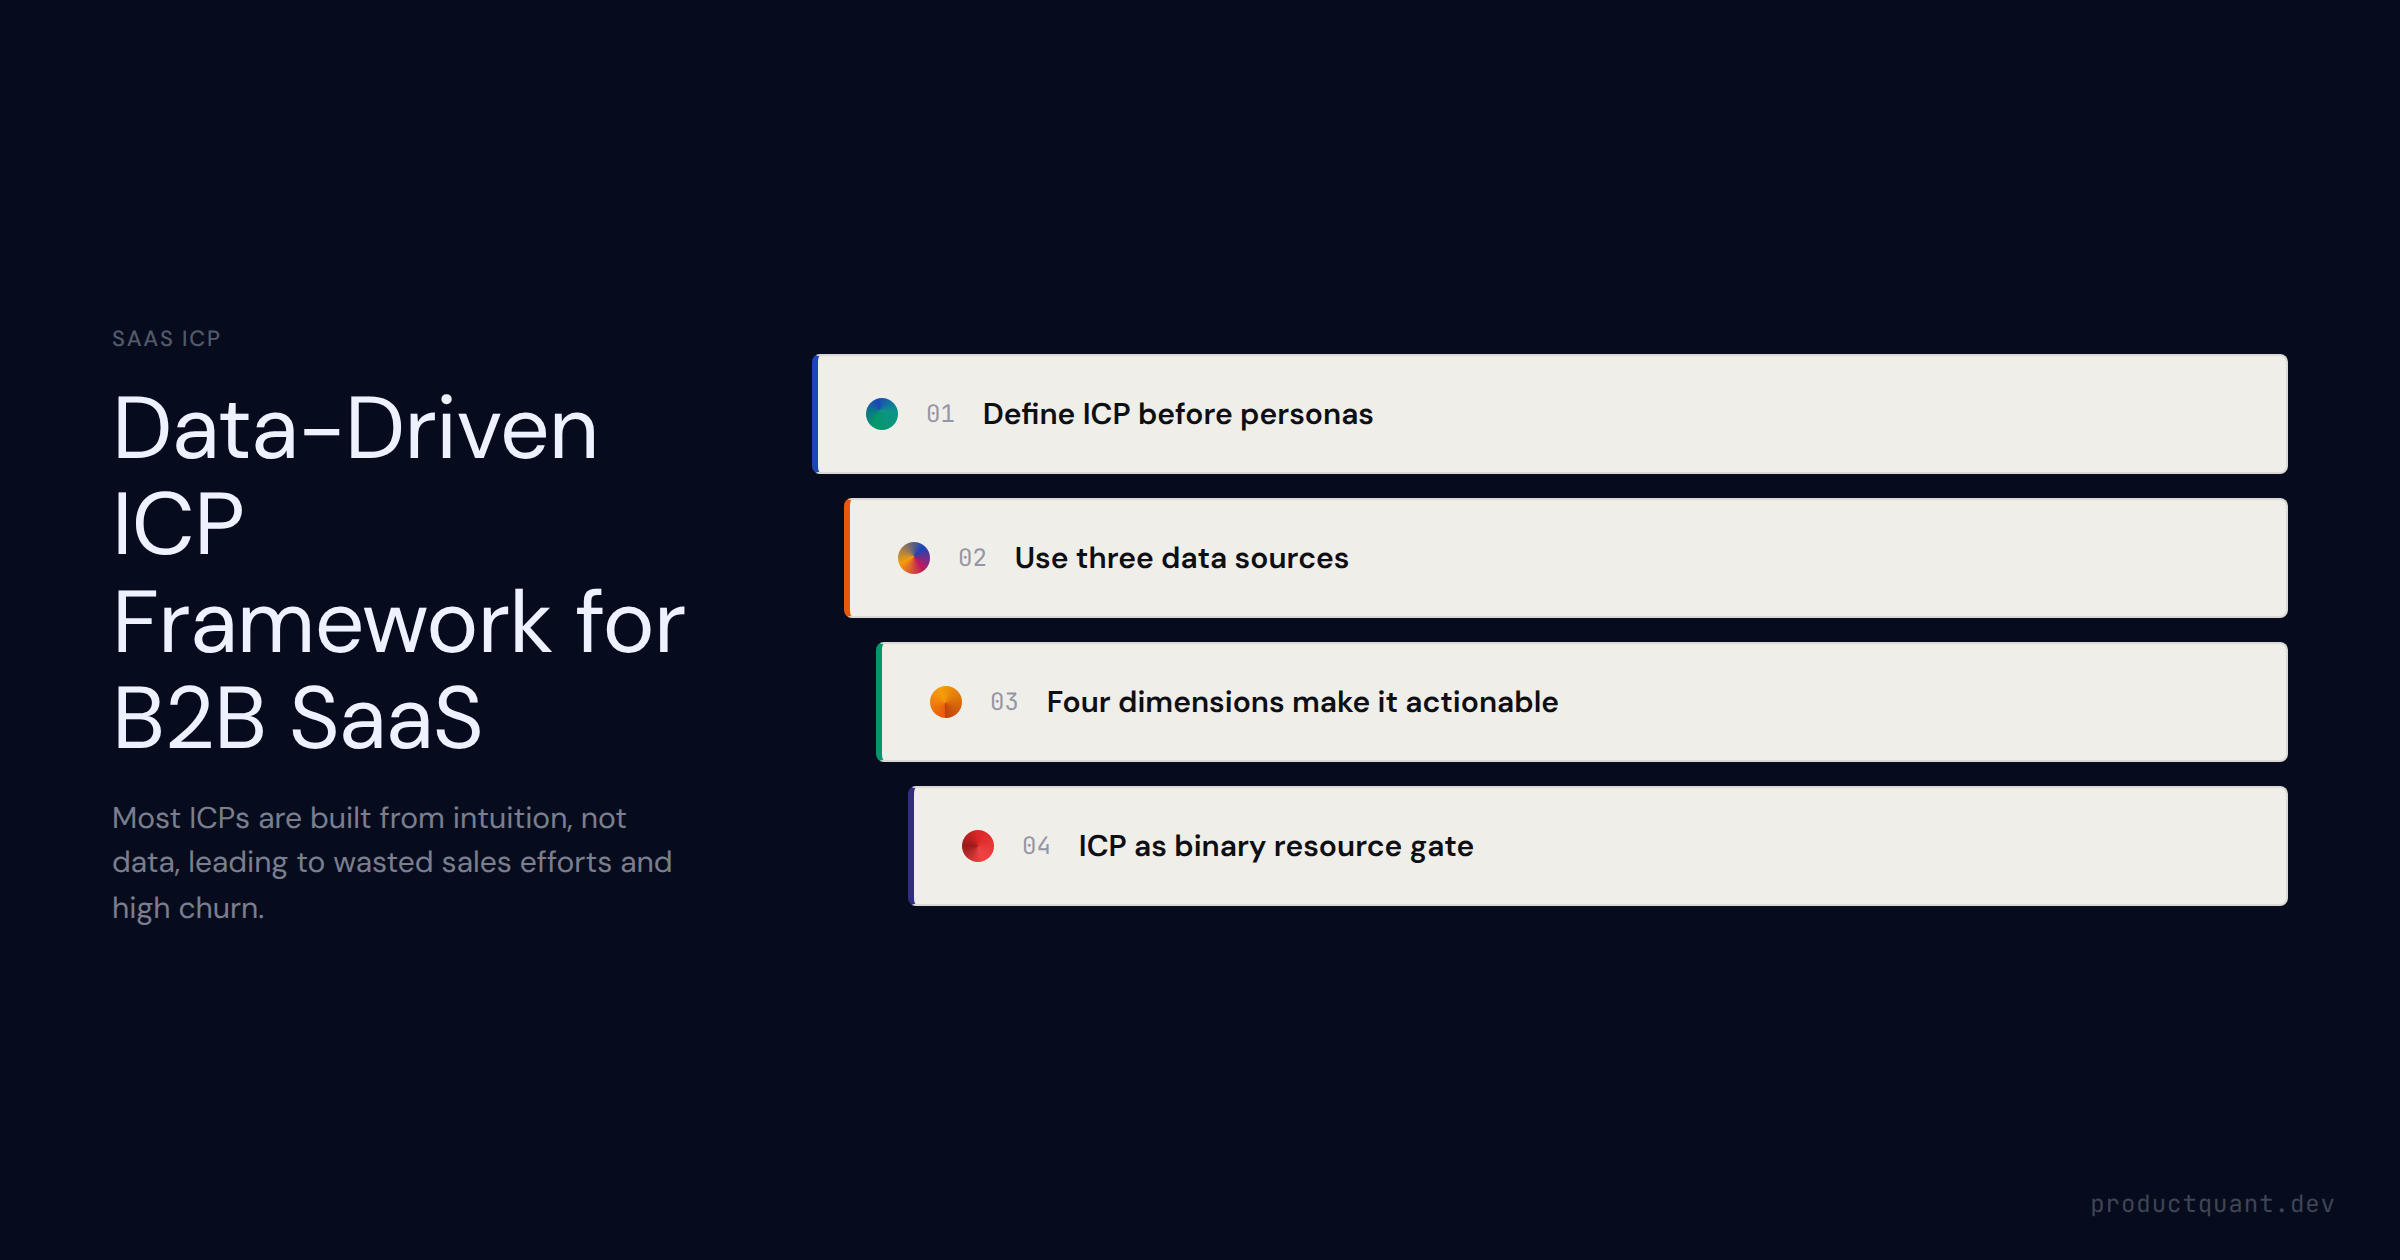
What an ICP is vs. a buyer persona, the data sources that make ICP definition defensible, the four dimensions that make an ICP actionable, and how to use ICP to gate sales resources and marketing spend in B2B SaaS.
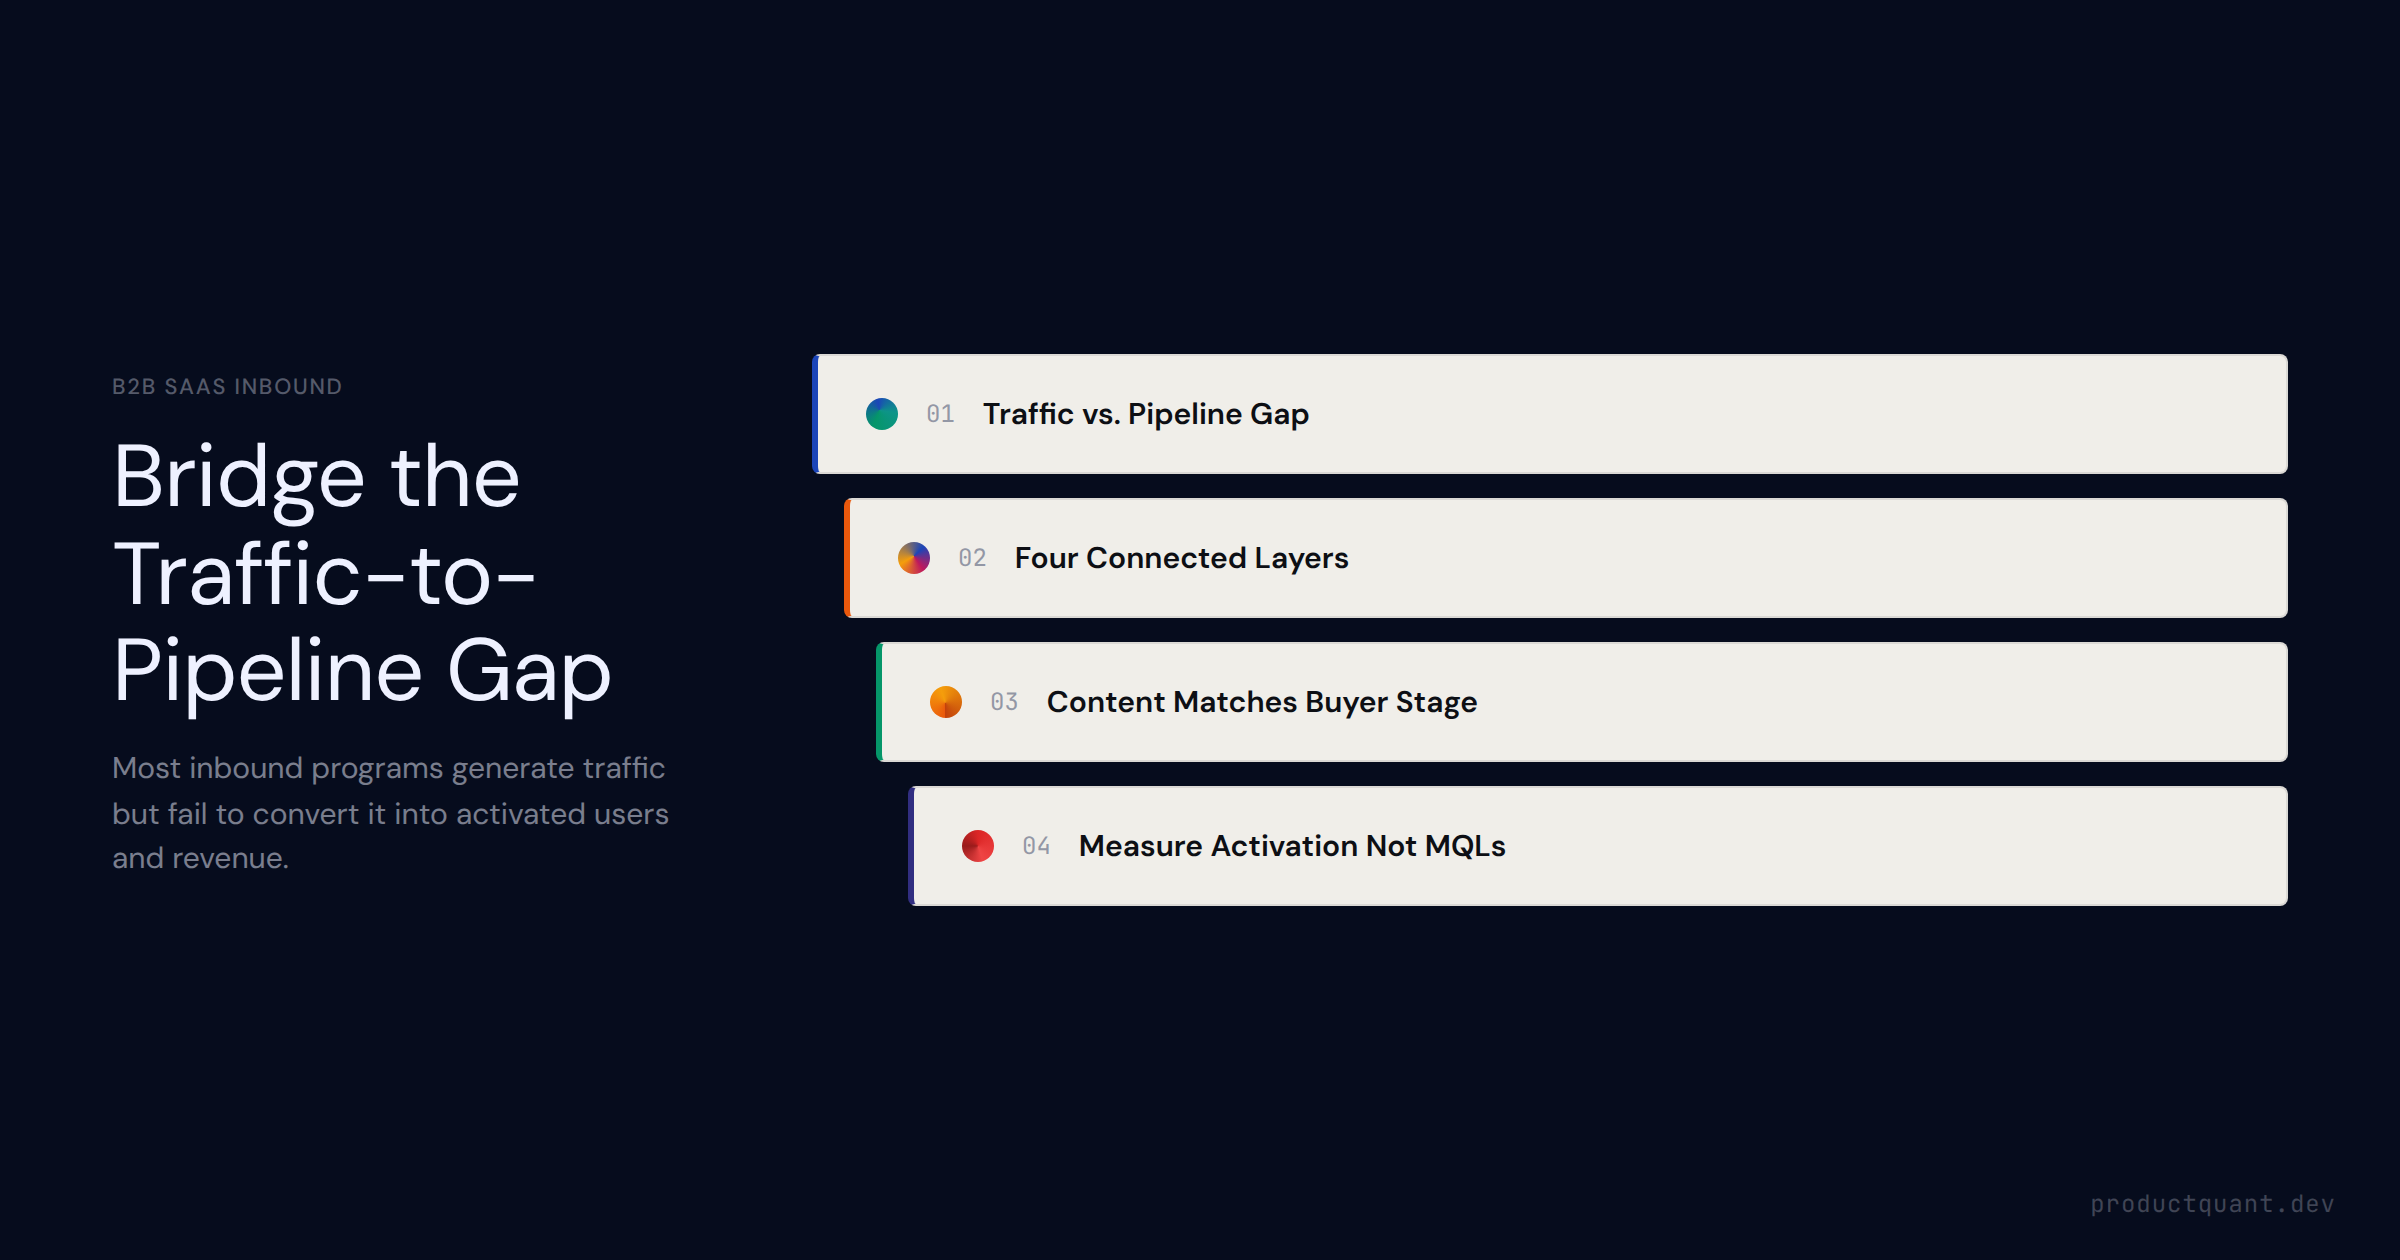
Most B2B SaaS inbound programs optimize for traffic and stop there. Learn the 4-layer inbound stack — content, conversion assets, nurture, trial activation — and how to measure inbound contribution to pipeline, not just
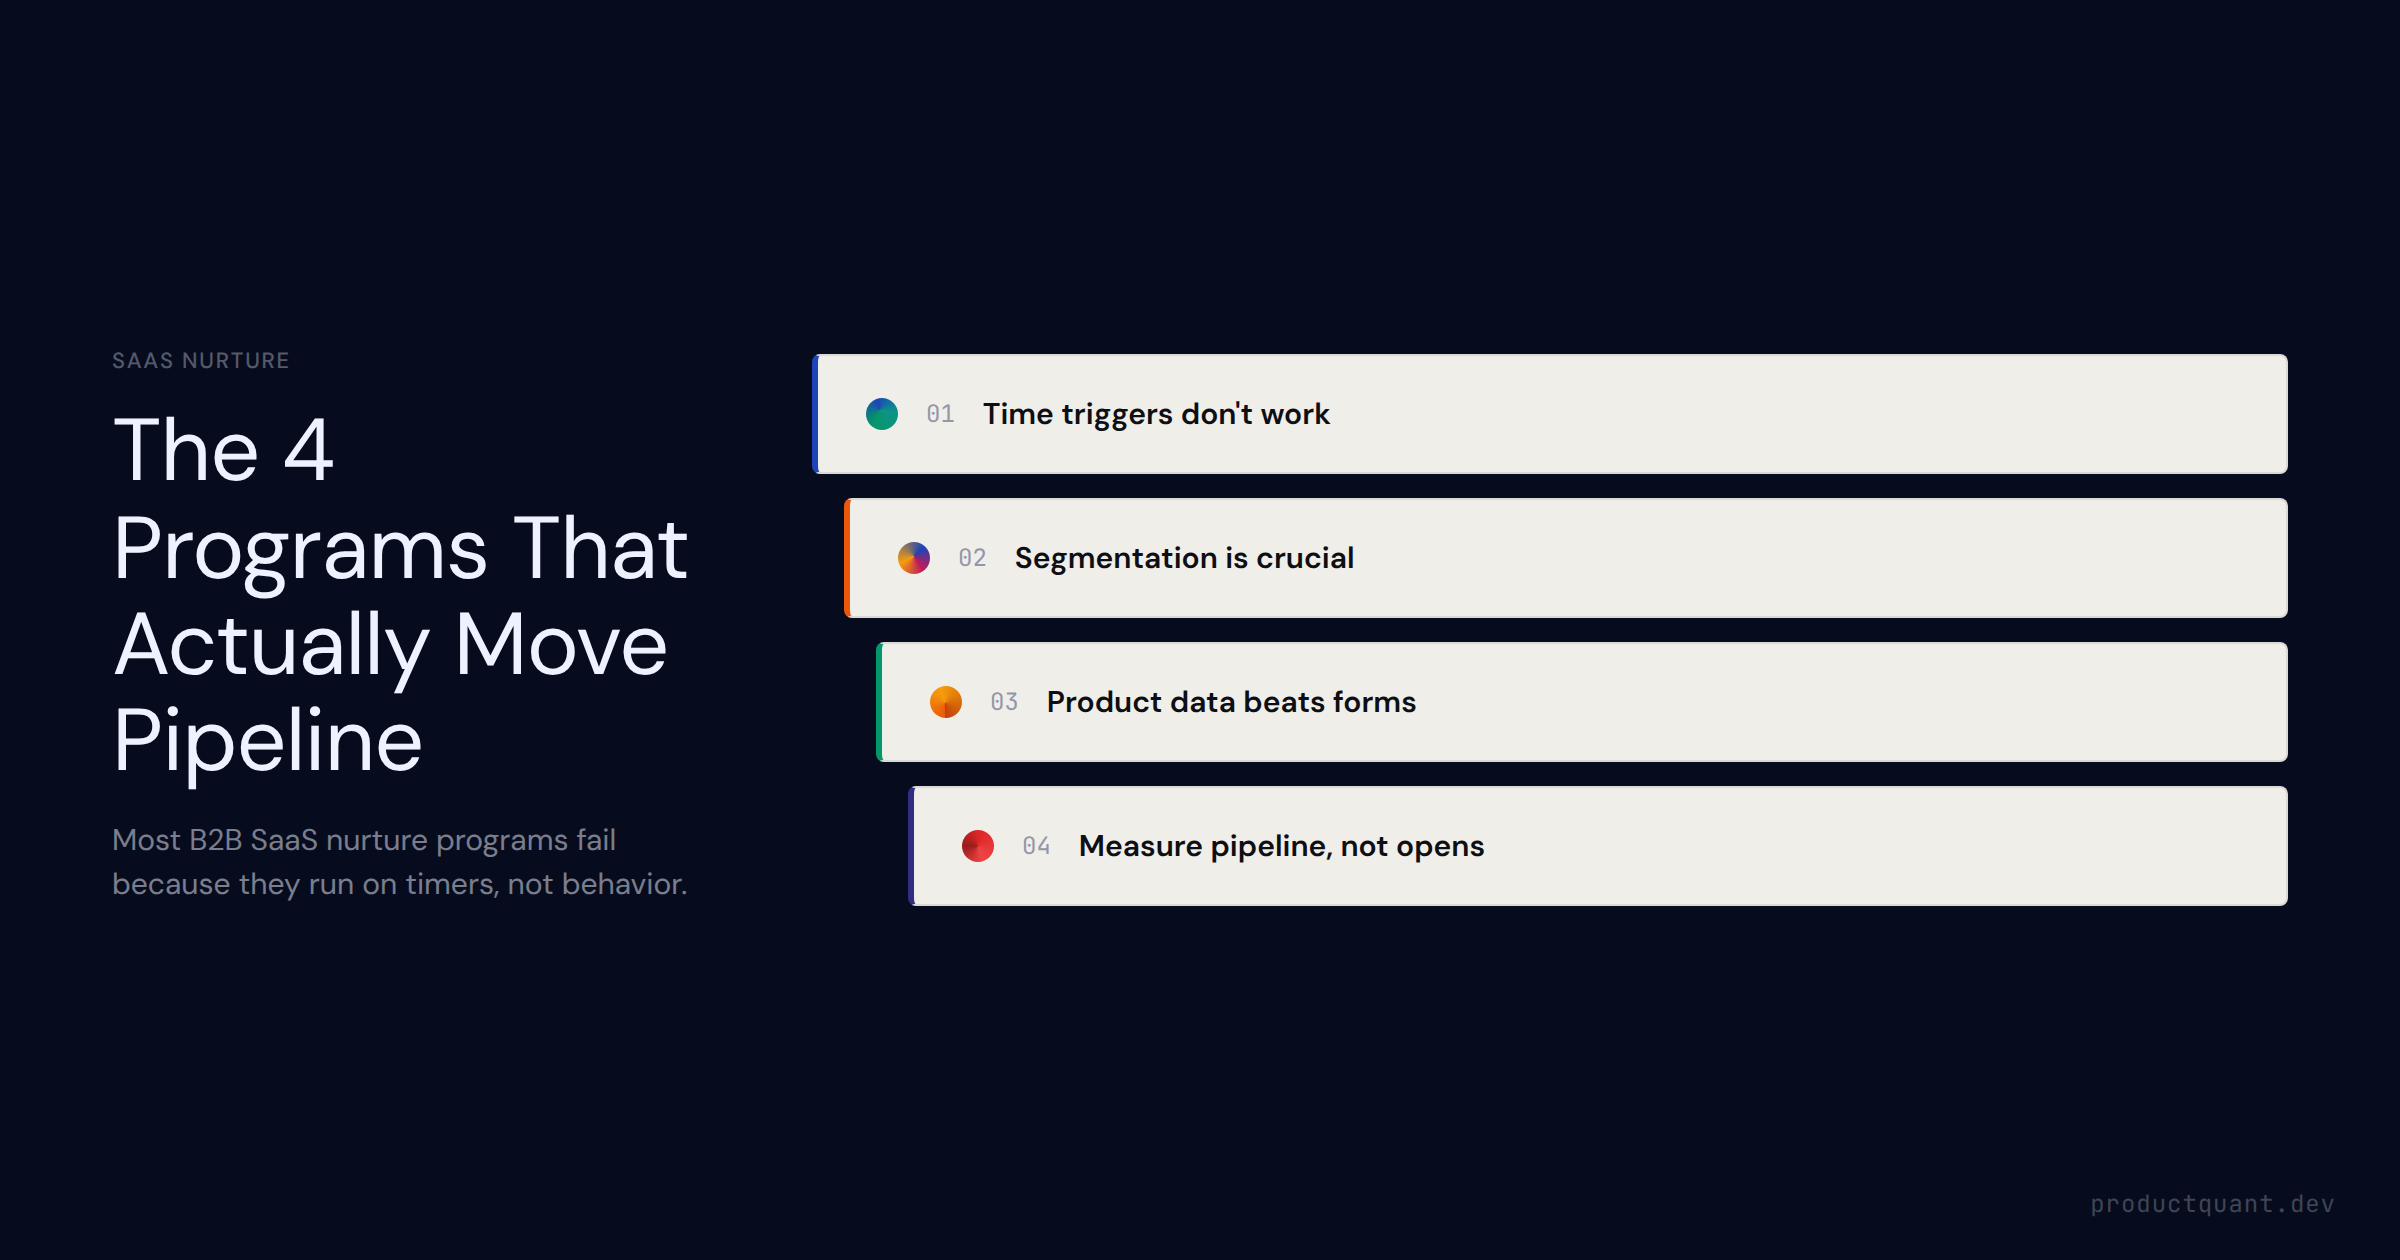
Most B2B SaaS lead nurturing programs fail because they run on time, not behavior. Here are the 4 nurture program types, their triggers, goals, and handoff criteria — and why trial behavioral data replaces form-fill demo
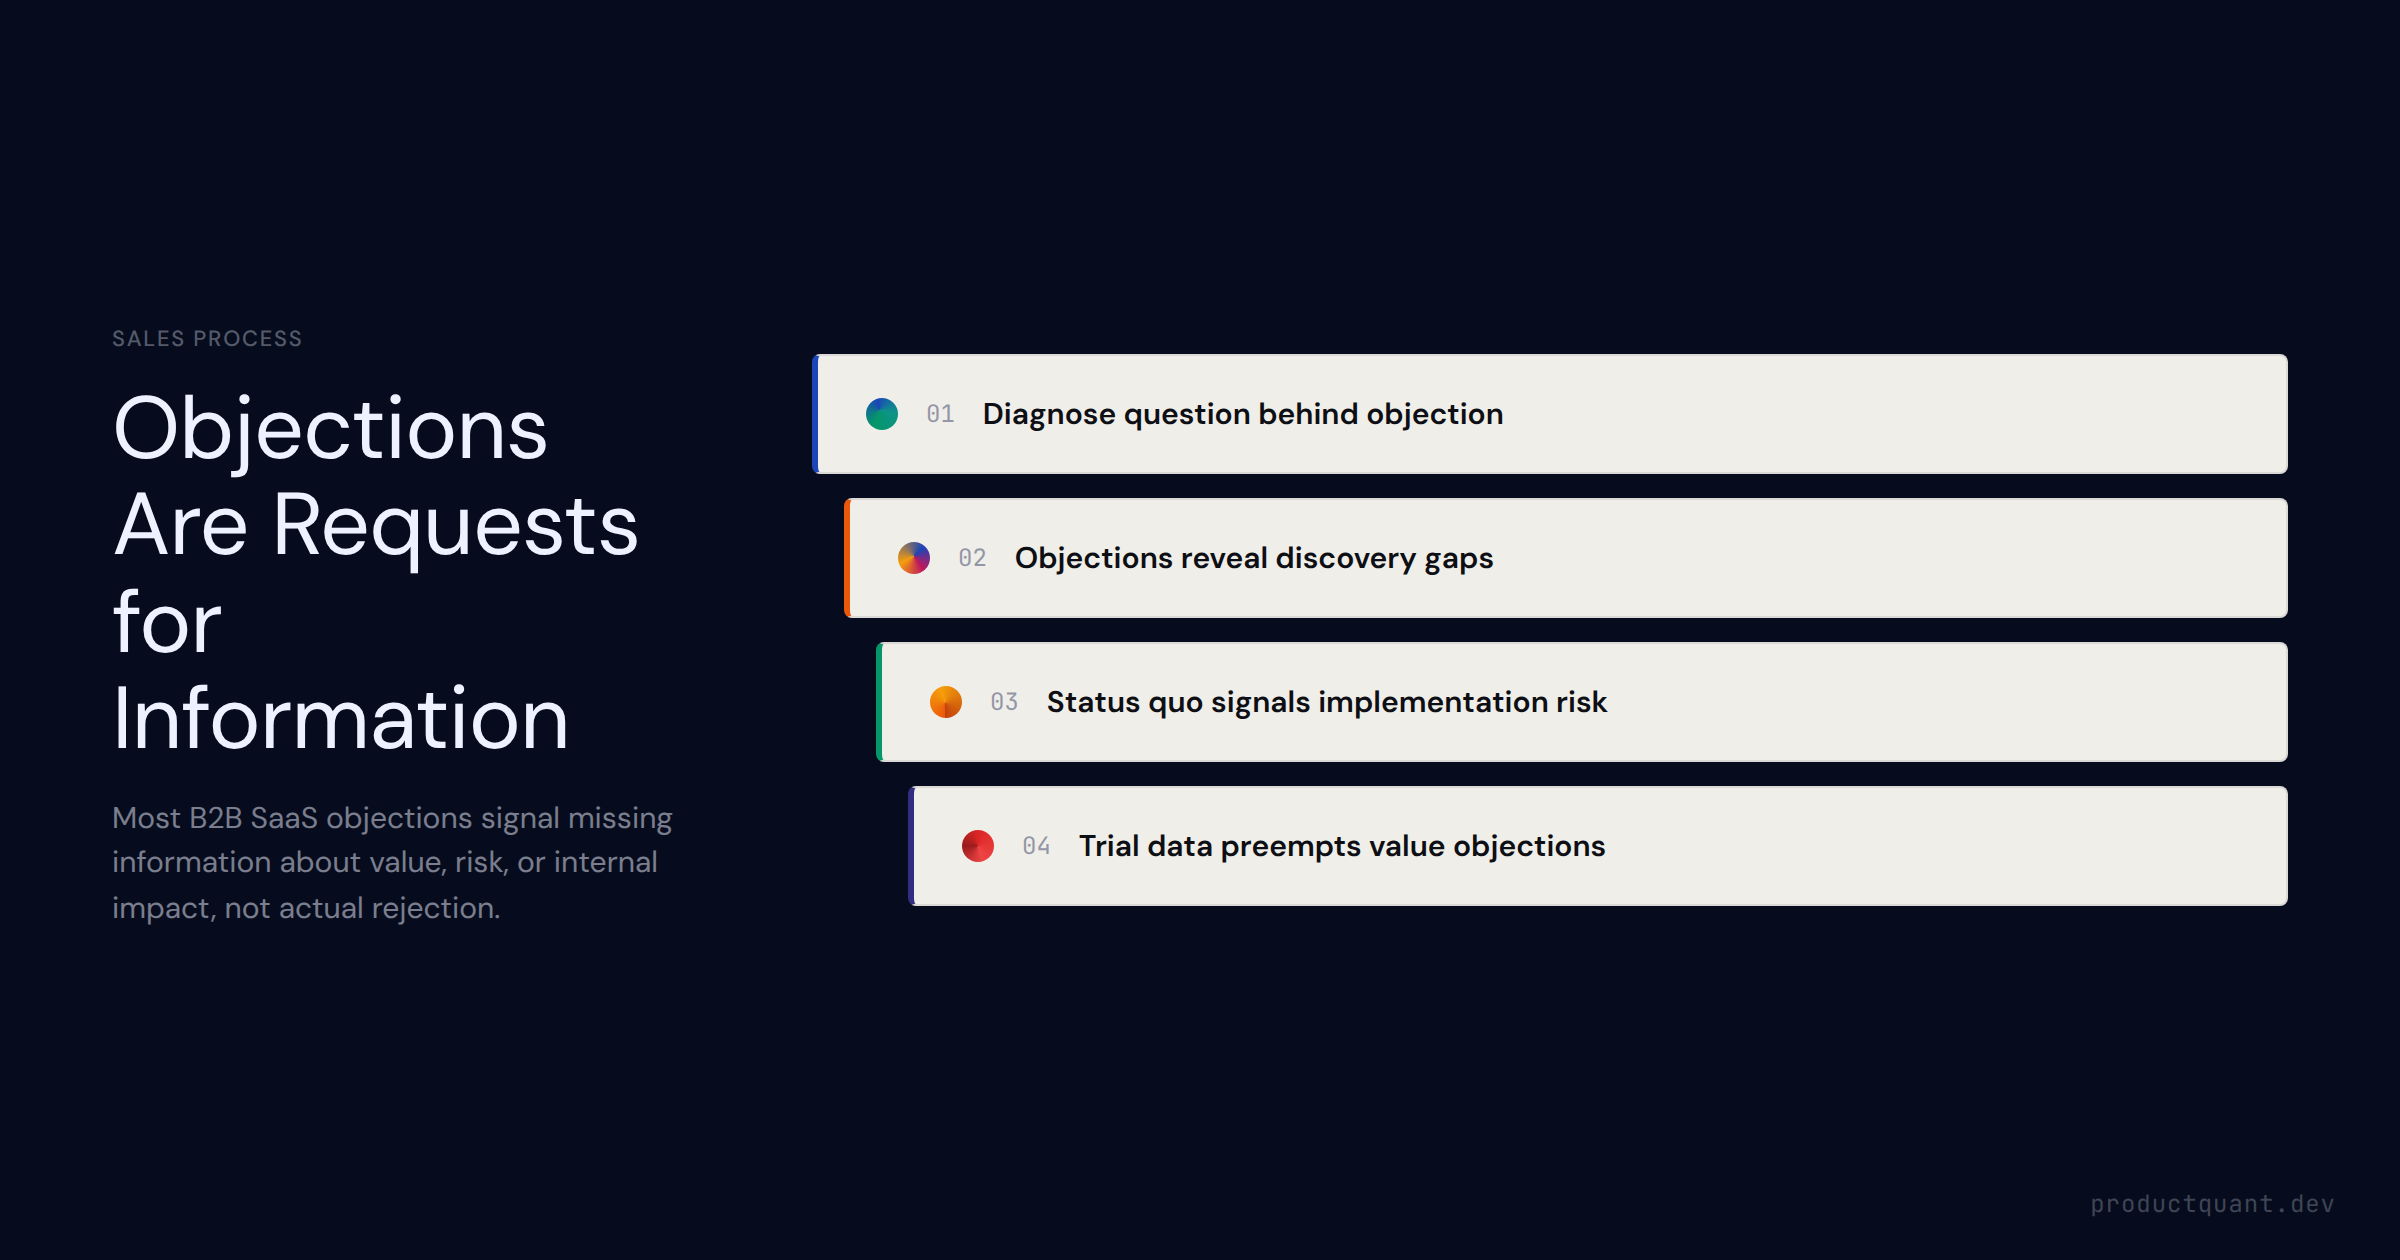
The 5 most common B2B SaaS objections — price, timing, status quo, competitor, and authority — and how to handle each with the Acknowledge-Align-Advance framework. Includes a full objection response matrix and signals th
B2B SaaS onboarding best practices that shorten time-to-value and lift activation. Covers PLG, sales-led, API-first, and enterprise models — with a matrix table and implementation checklist.
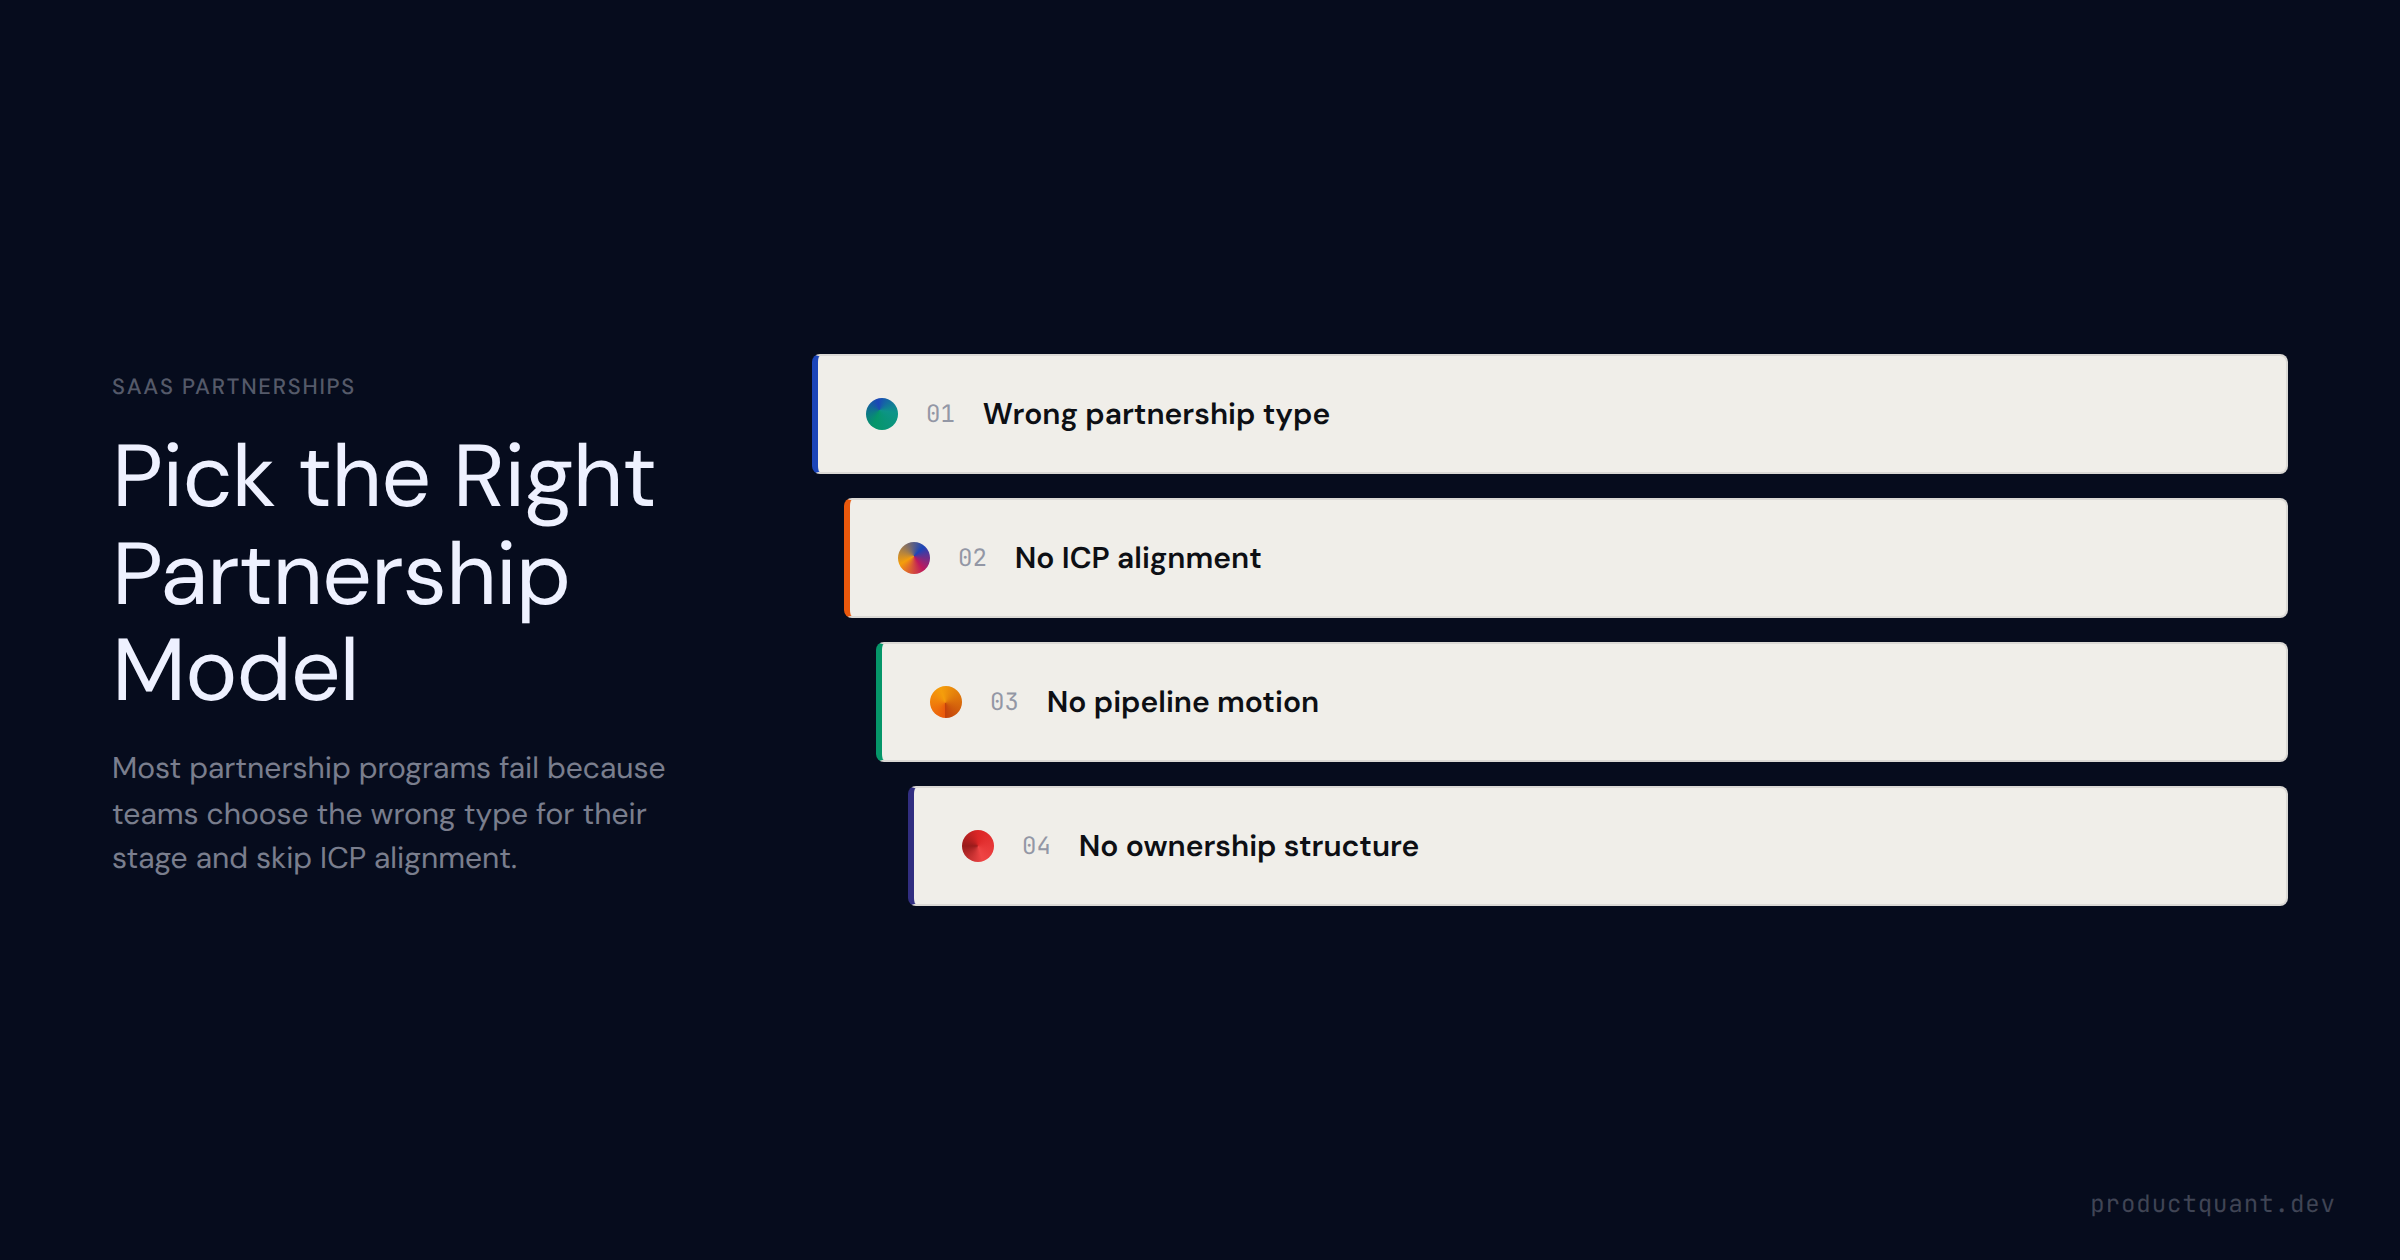
Most B2B SaaS partnership programs consume more resources than they generate. Here is how the three partnership types work, when each creates revenue, and how to structure a partnership that delivers pipeline.
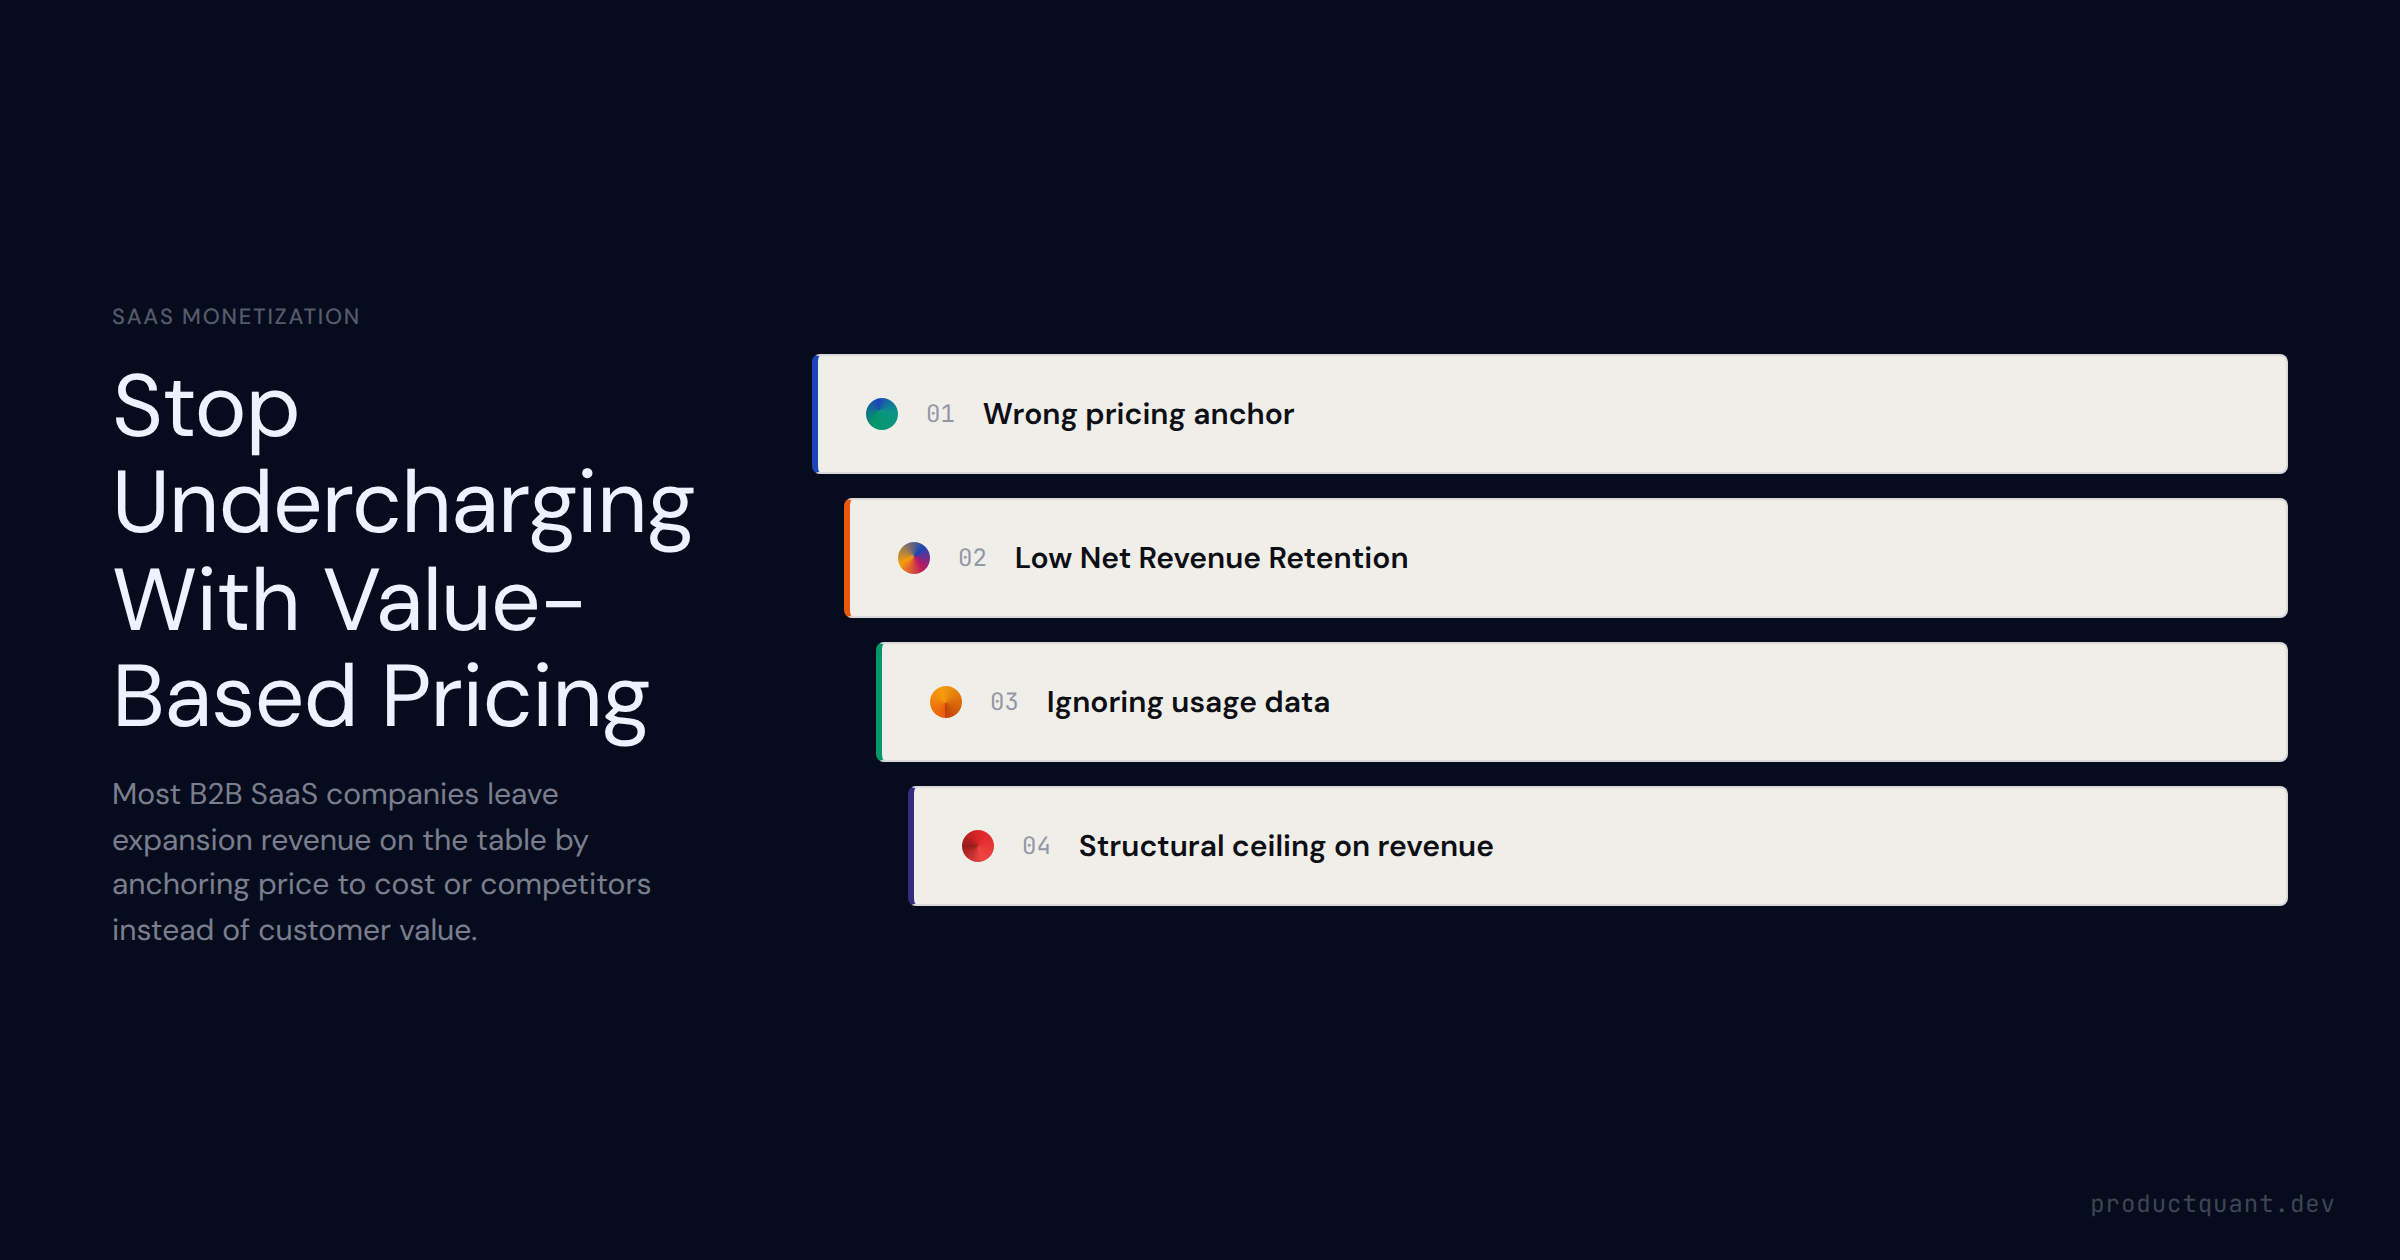
Most B2B SaaS companies undercharge — not because they price too low, but because they don
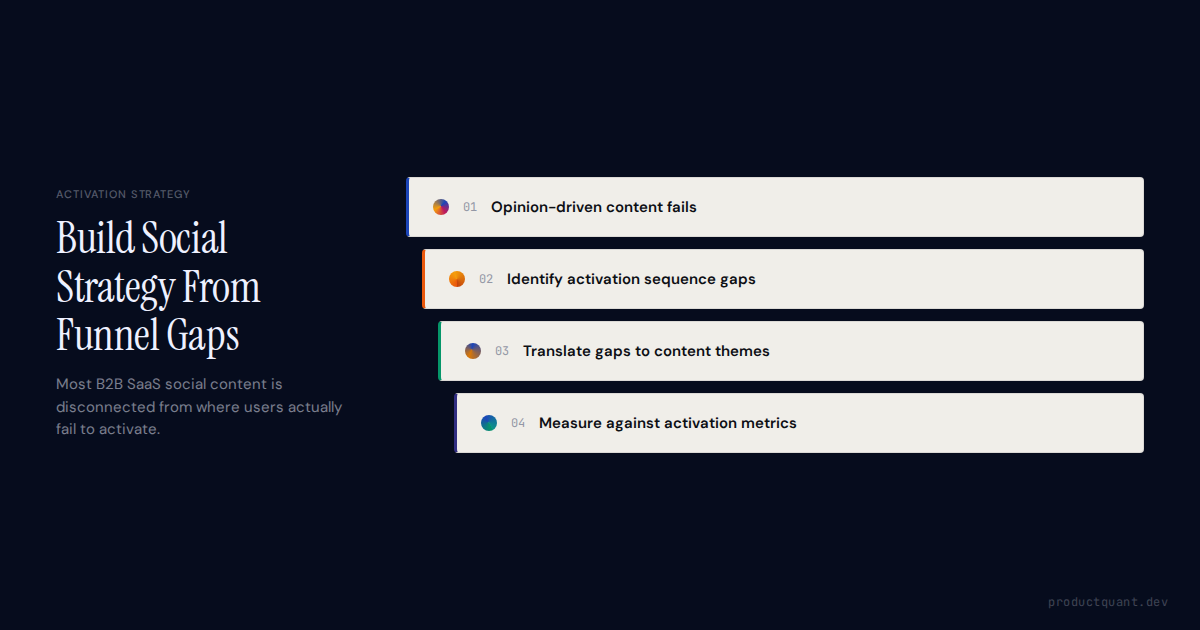
Most B2B SaaS teams post to social media based on what feels right, what the CEO mentioned in Slack, or what a competitor did last week. The result is cont

Most product-led growth teams treat LinkedIn as a brand awareness channel. That is the mistake. Here is how to map LinkedIn to your actual activation friction—and what to test next.
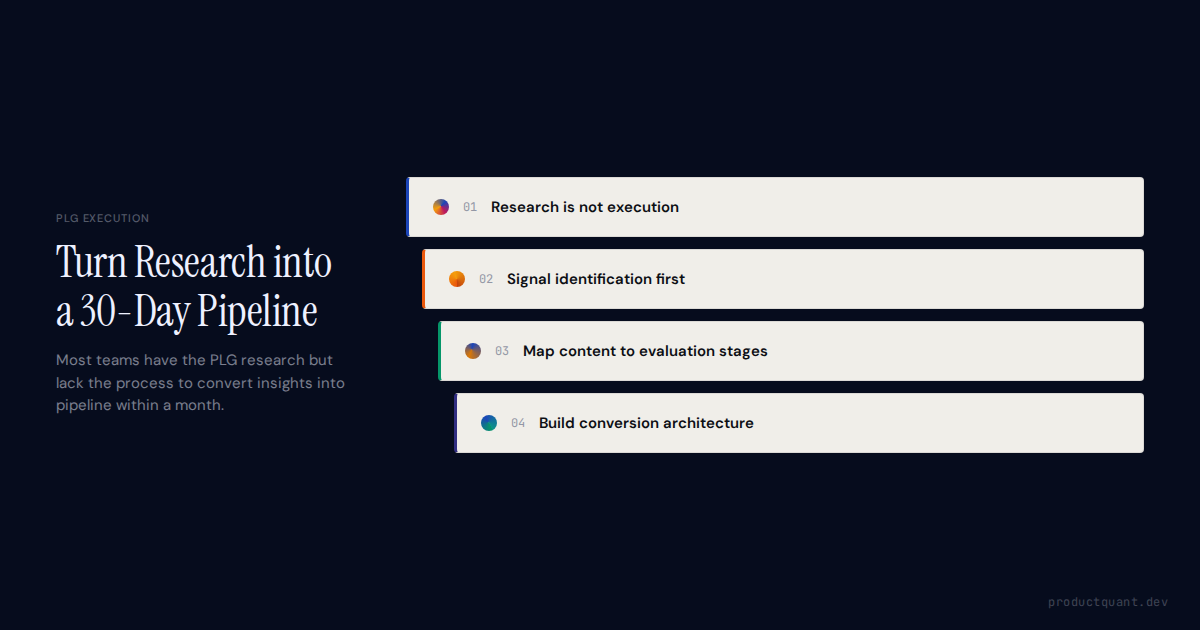
Most B2B SaaS teams have access to more PLG research than ever. The problem is not finding insights. The problem is converting those insights into an execu
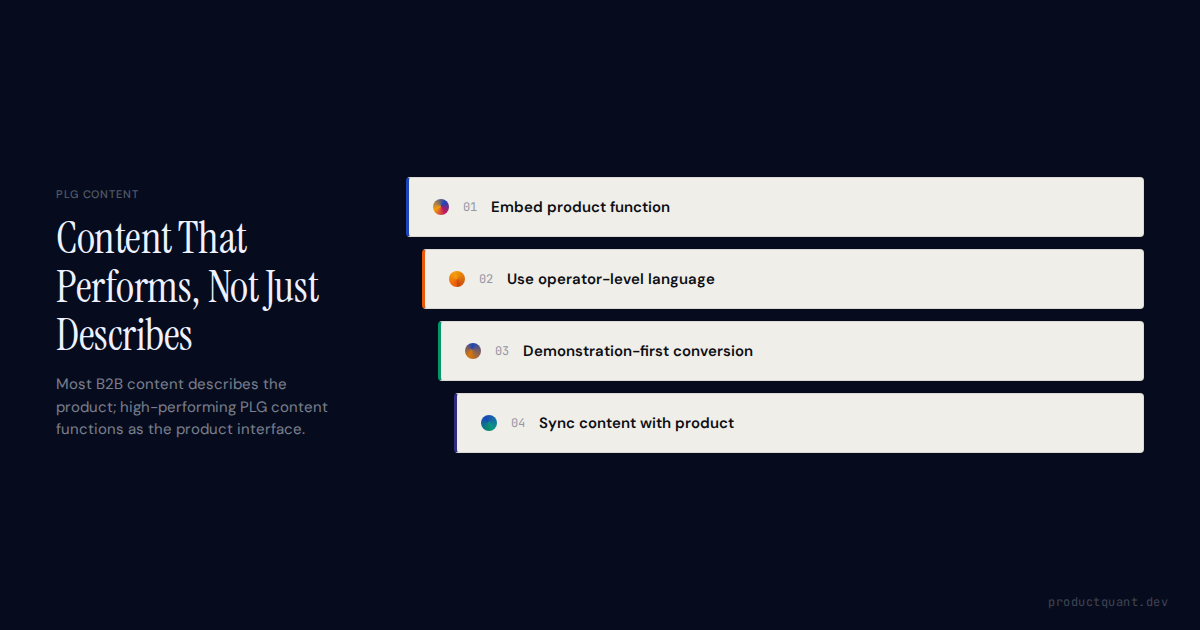
Most B2B SaaS content talks at operators. The content that converts treats readers like they already work there. Here is the structural difference that dri
Most B2B SaaS teams publish 12-18 pieces per quarter, generate solid traffic, and still wonder why pipeline numbers do not move. The problem is not the con
A positioning statement that actually differentiates uses April Dunford
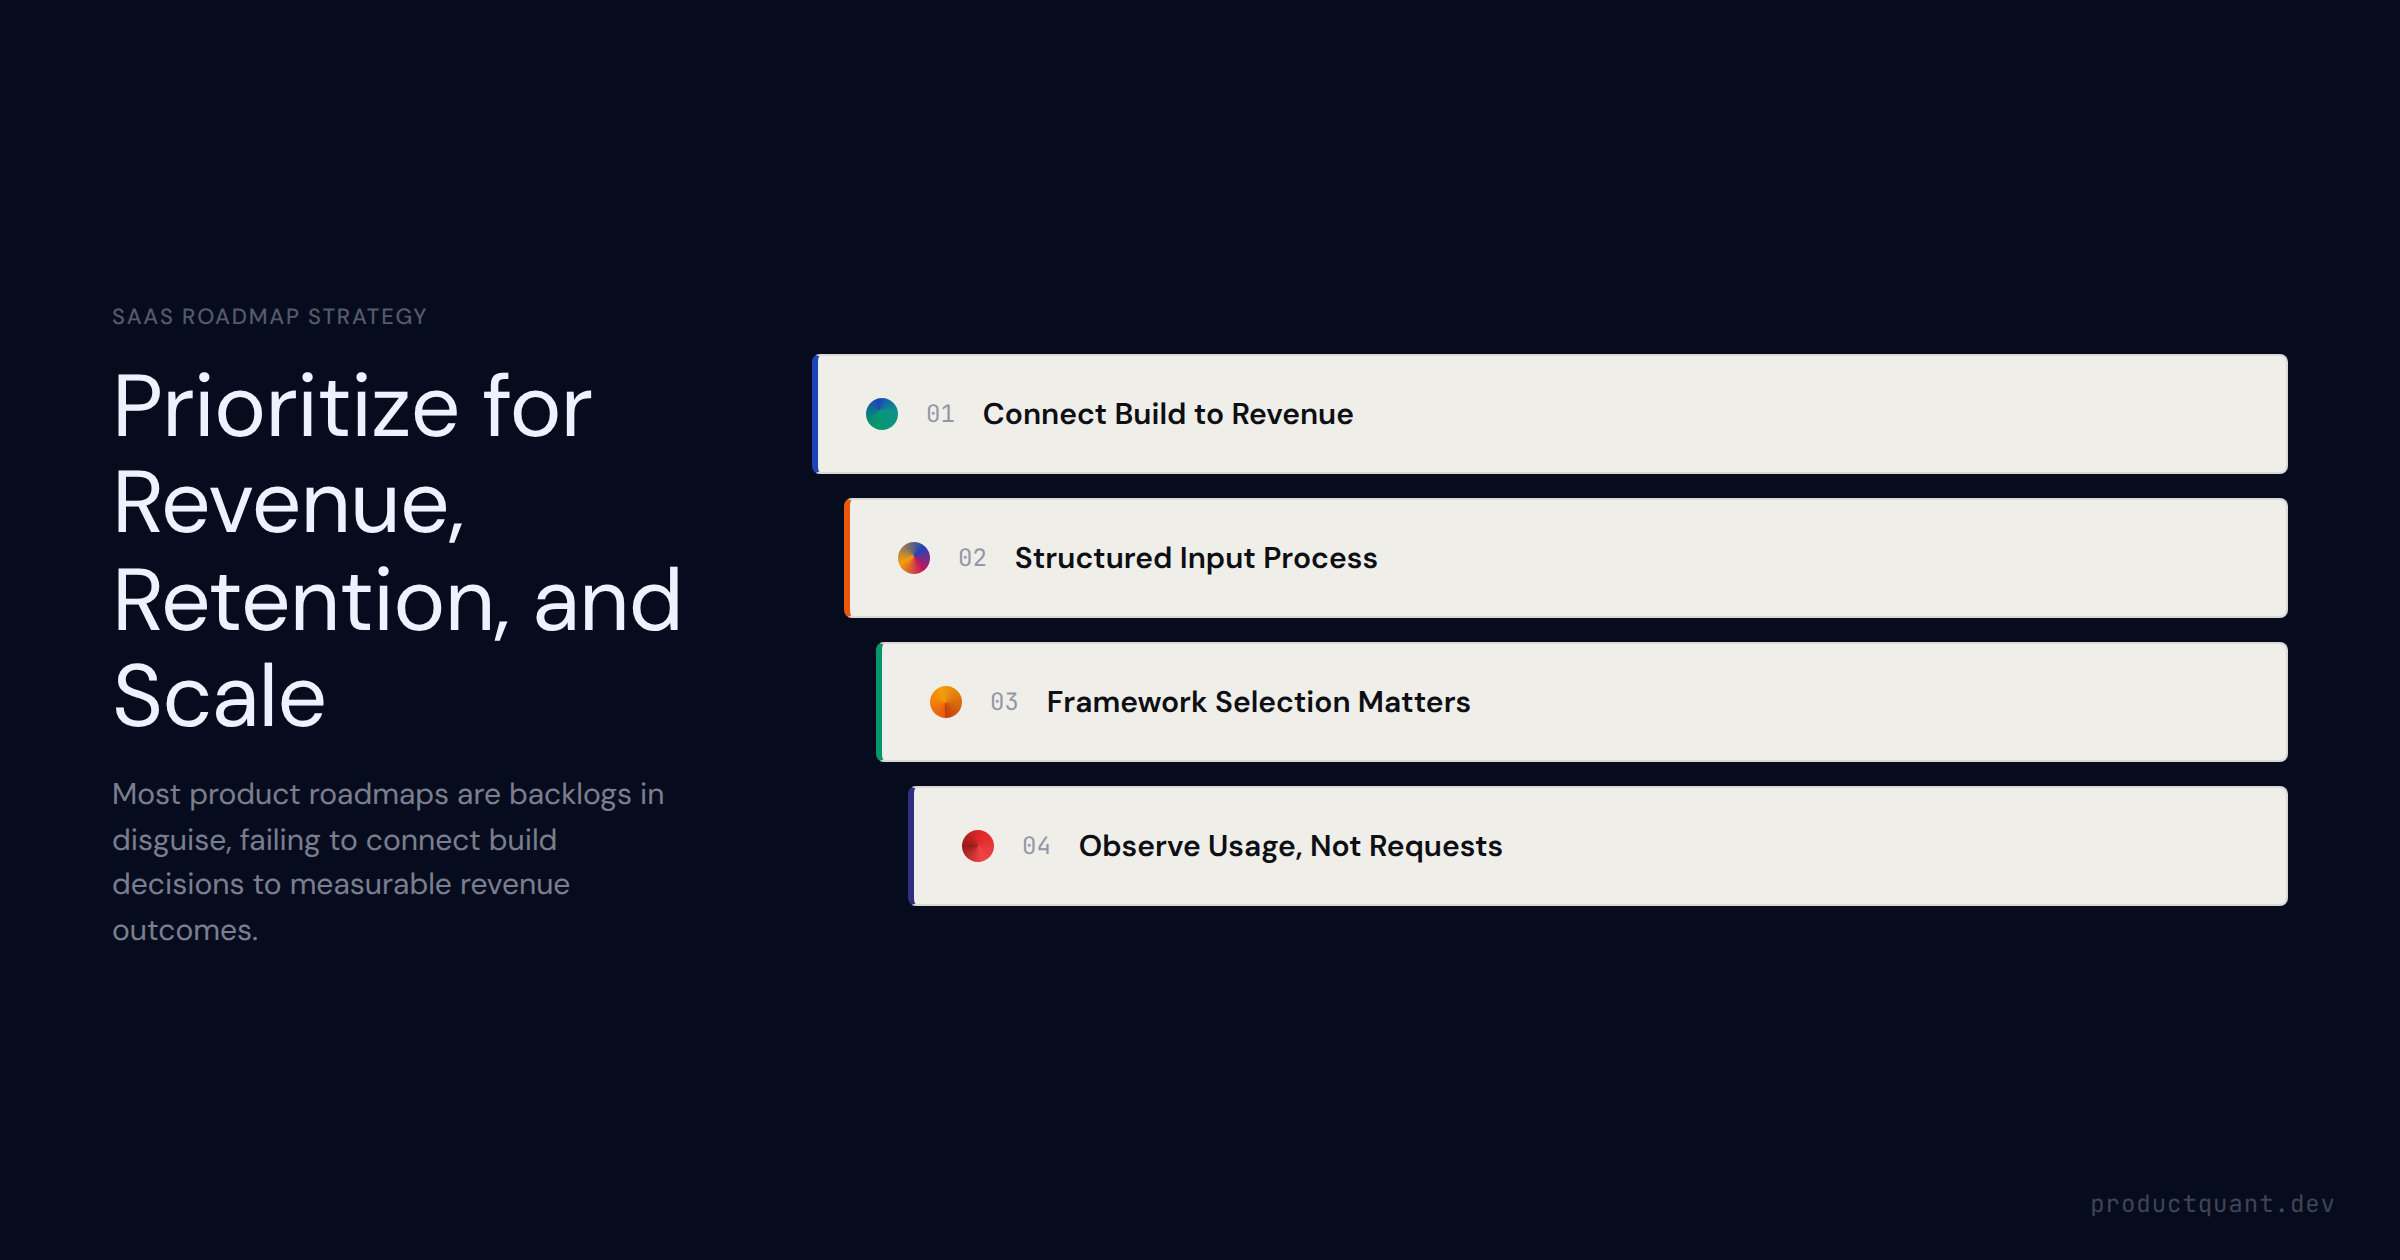
How B2B SaaS companies build product roadmaps that drive revenue — covering RICE, MoSCoW, and impact/effort frameworks, balancing enterprise requests against product vision, and connecting roadmap decisions to retention
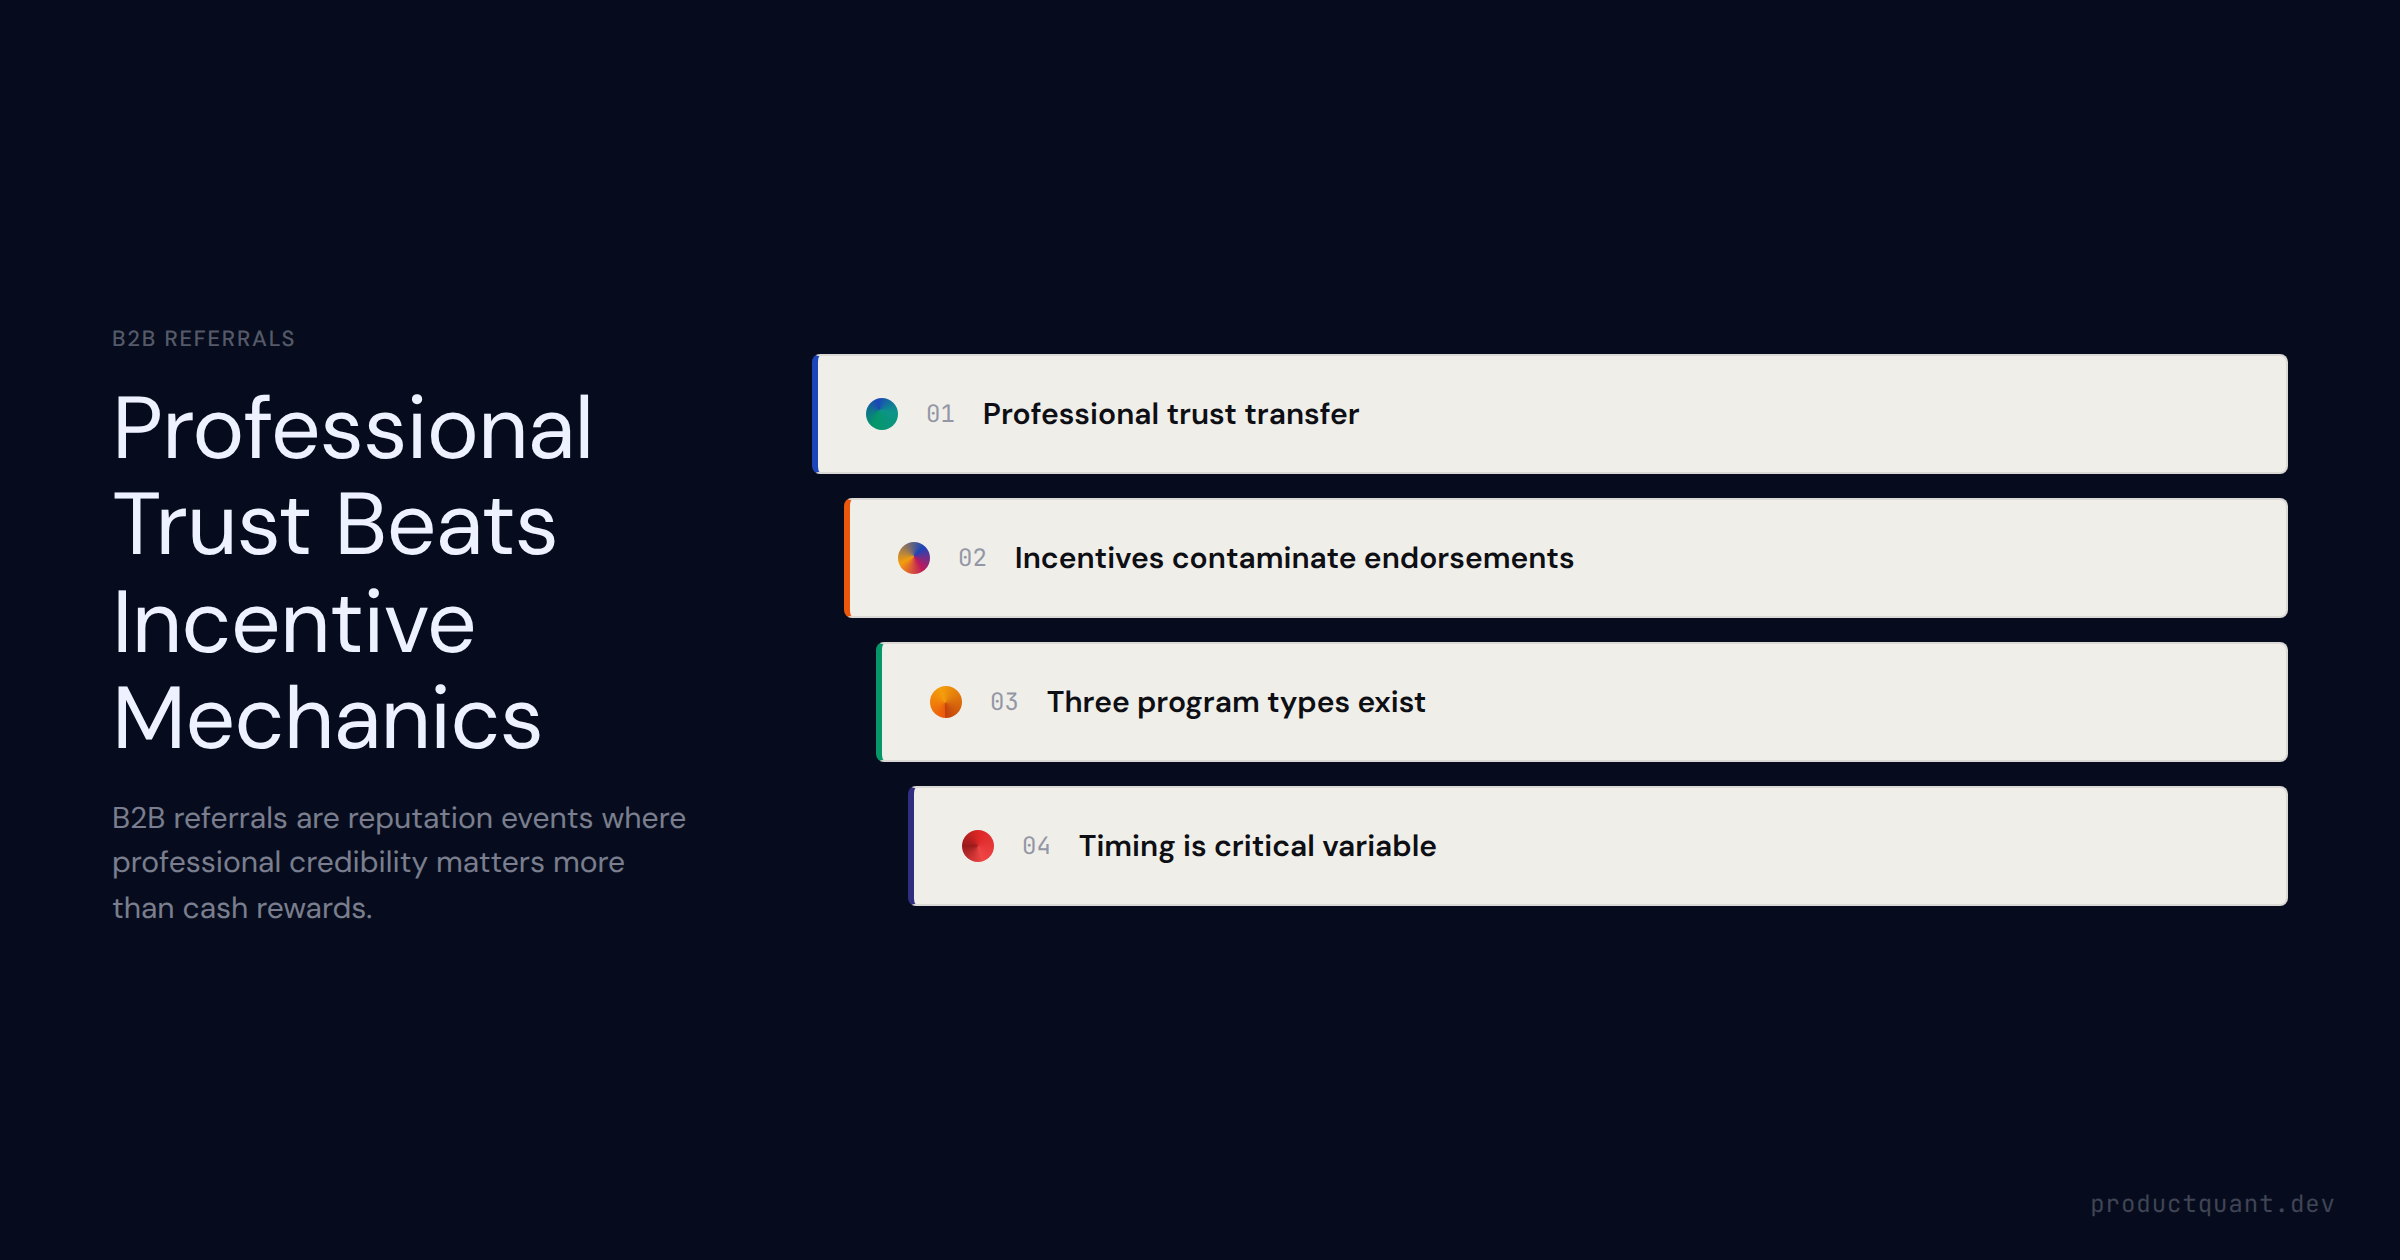
B2B SaaS referral programs fail when they copy B2C incentive mechanics. Here is how professional trust works, what types of programs exist, when to ask, and what incentives actually convert.
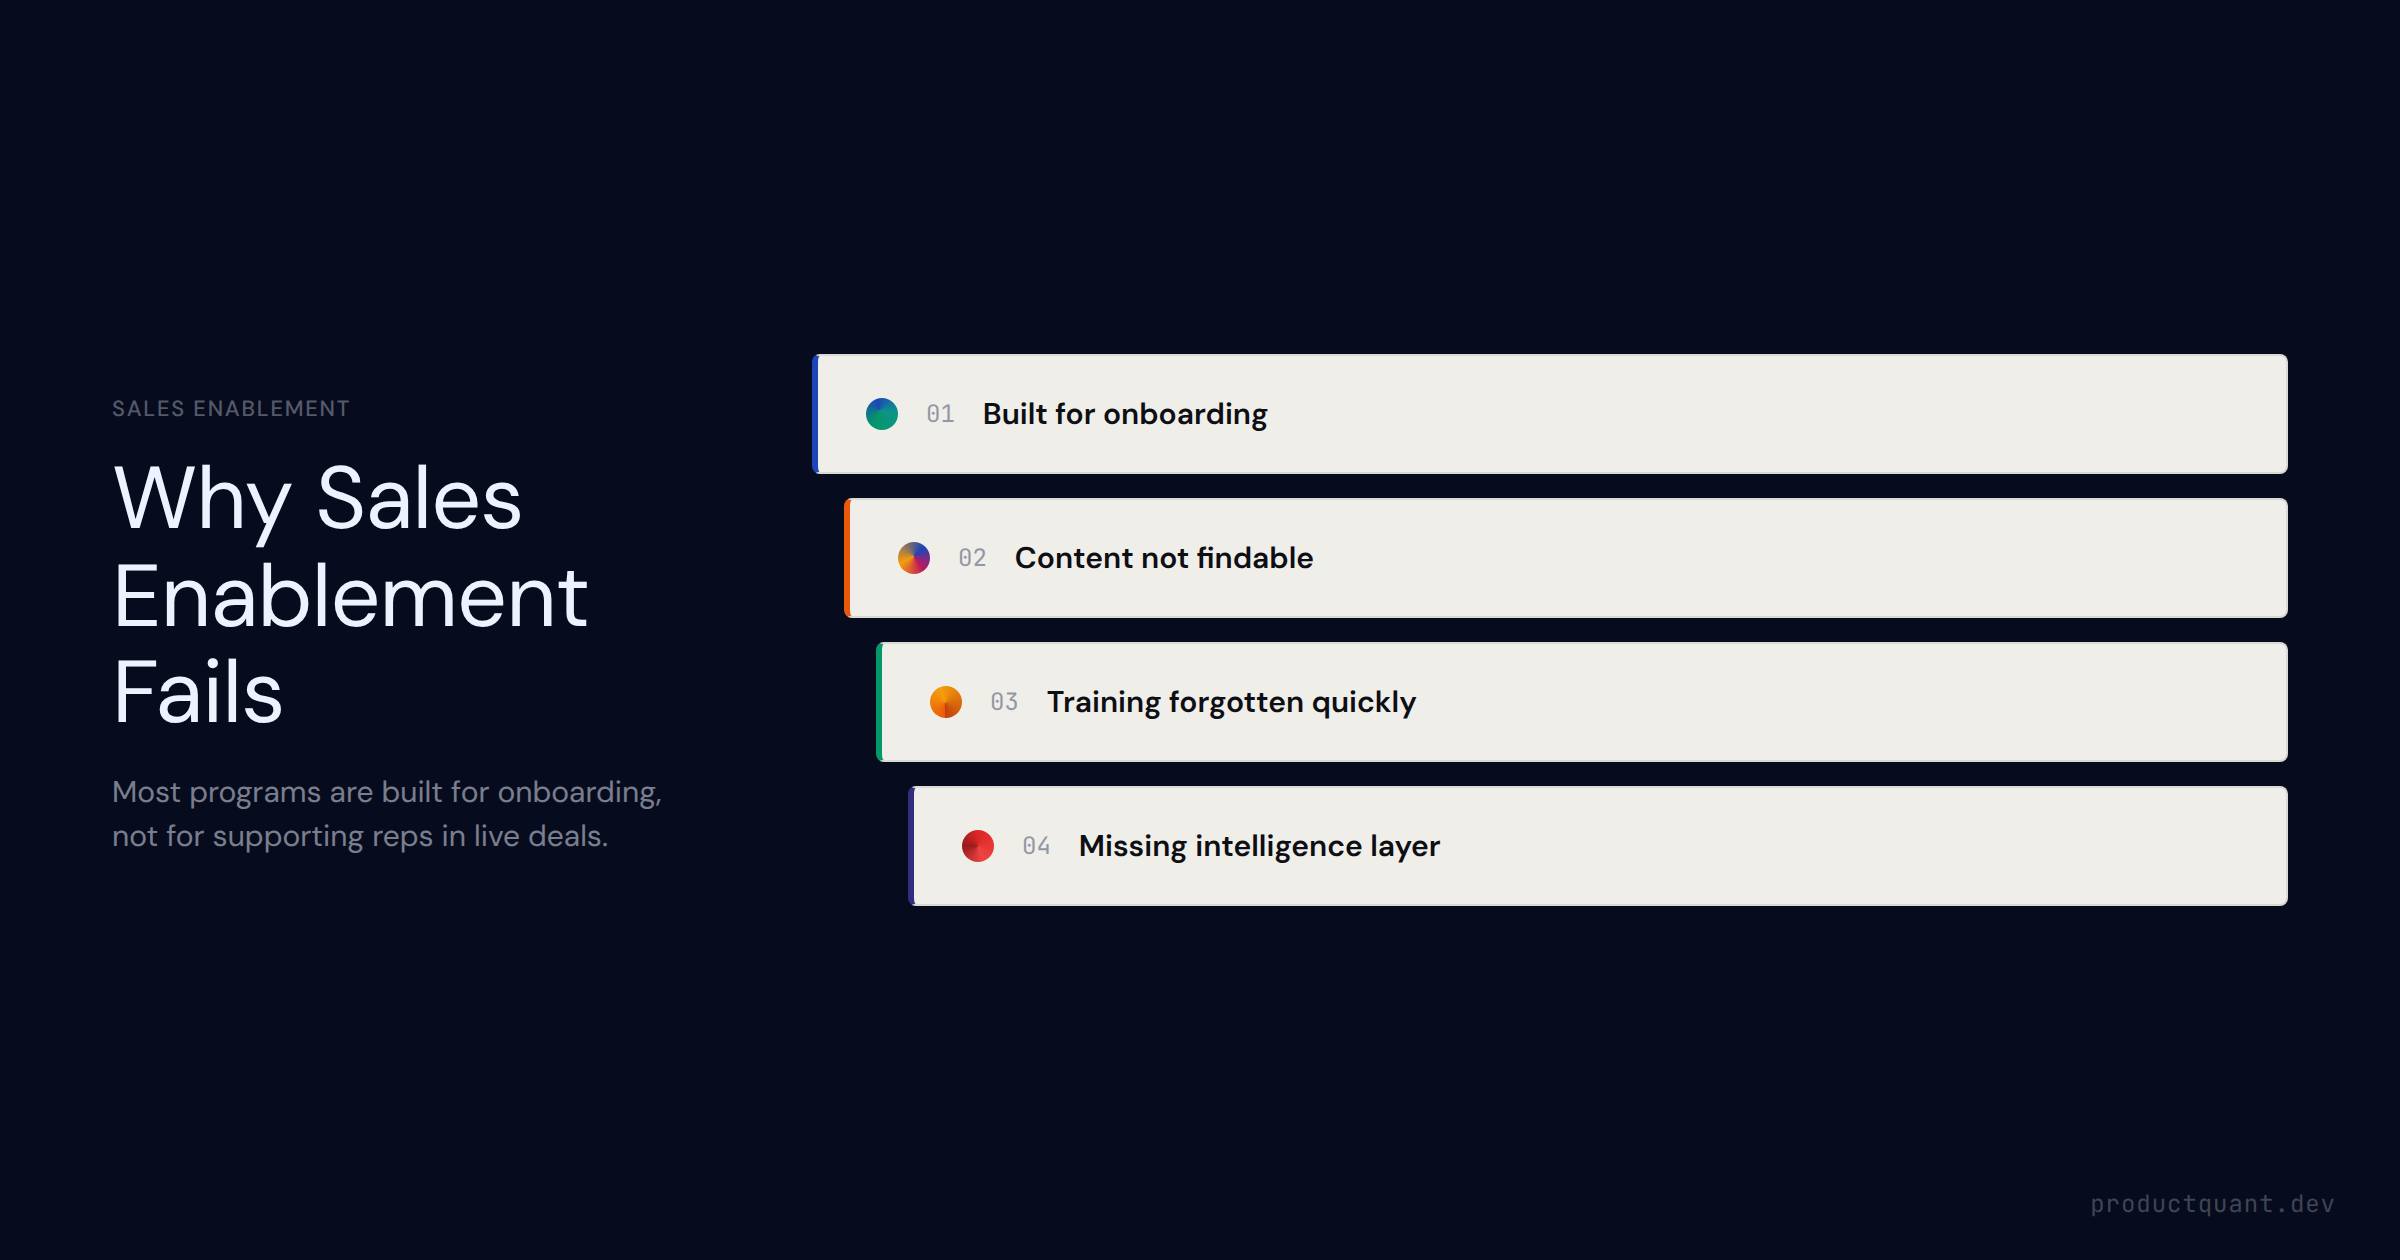
Sales enablement in B2B SaaS — the four categories (content, training, tools, intelligence), why most programs fail because they
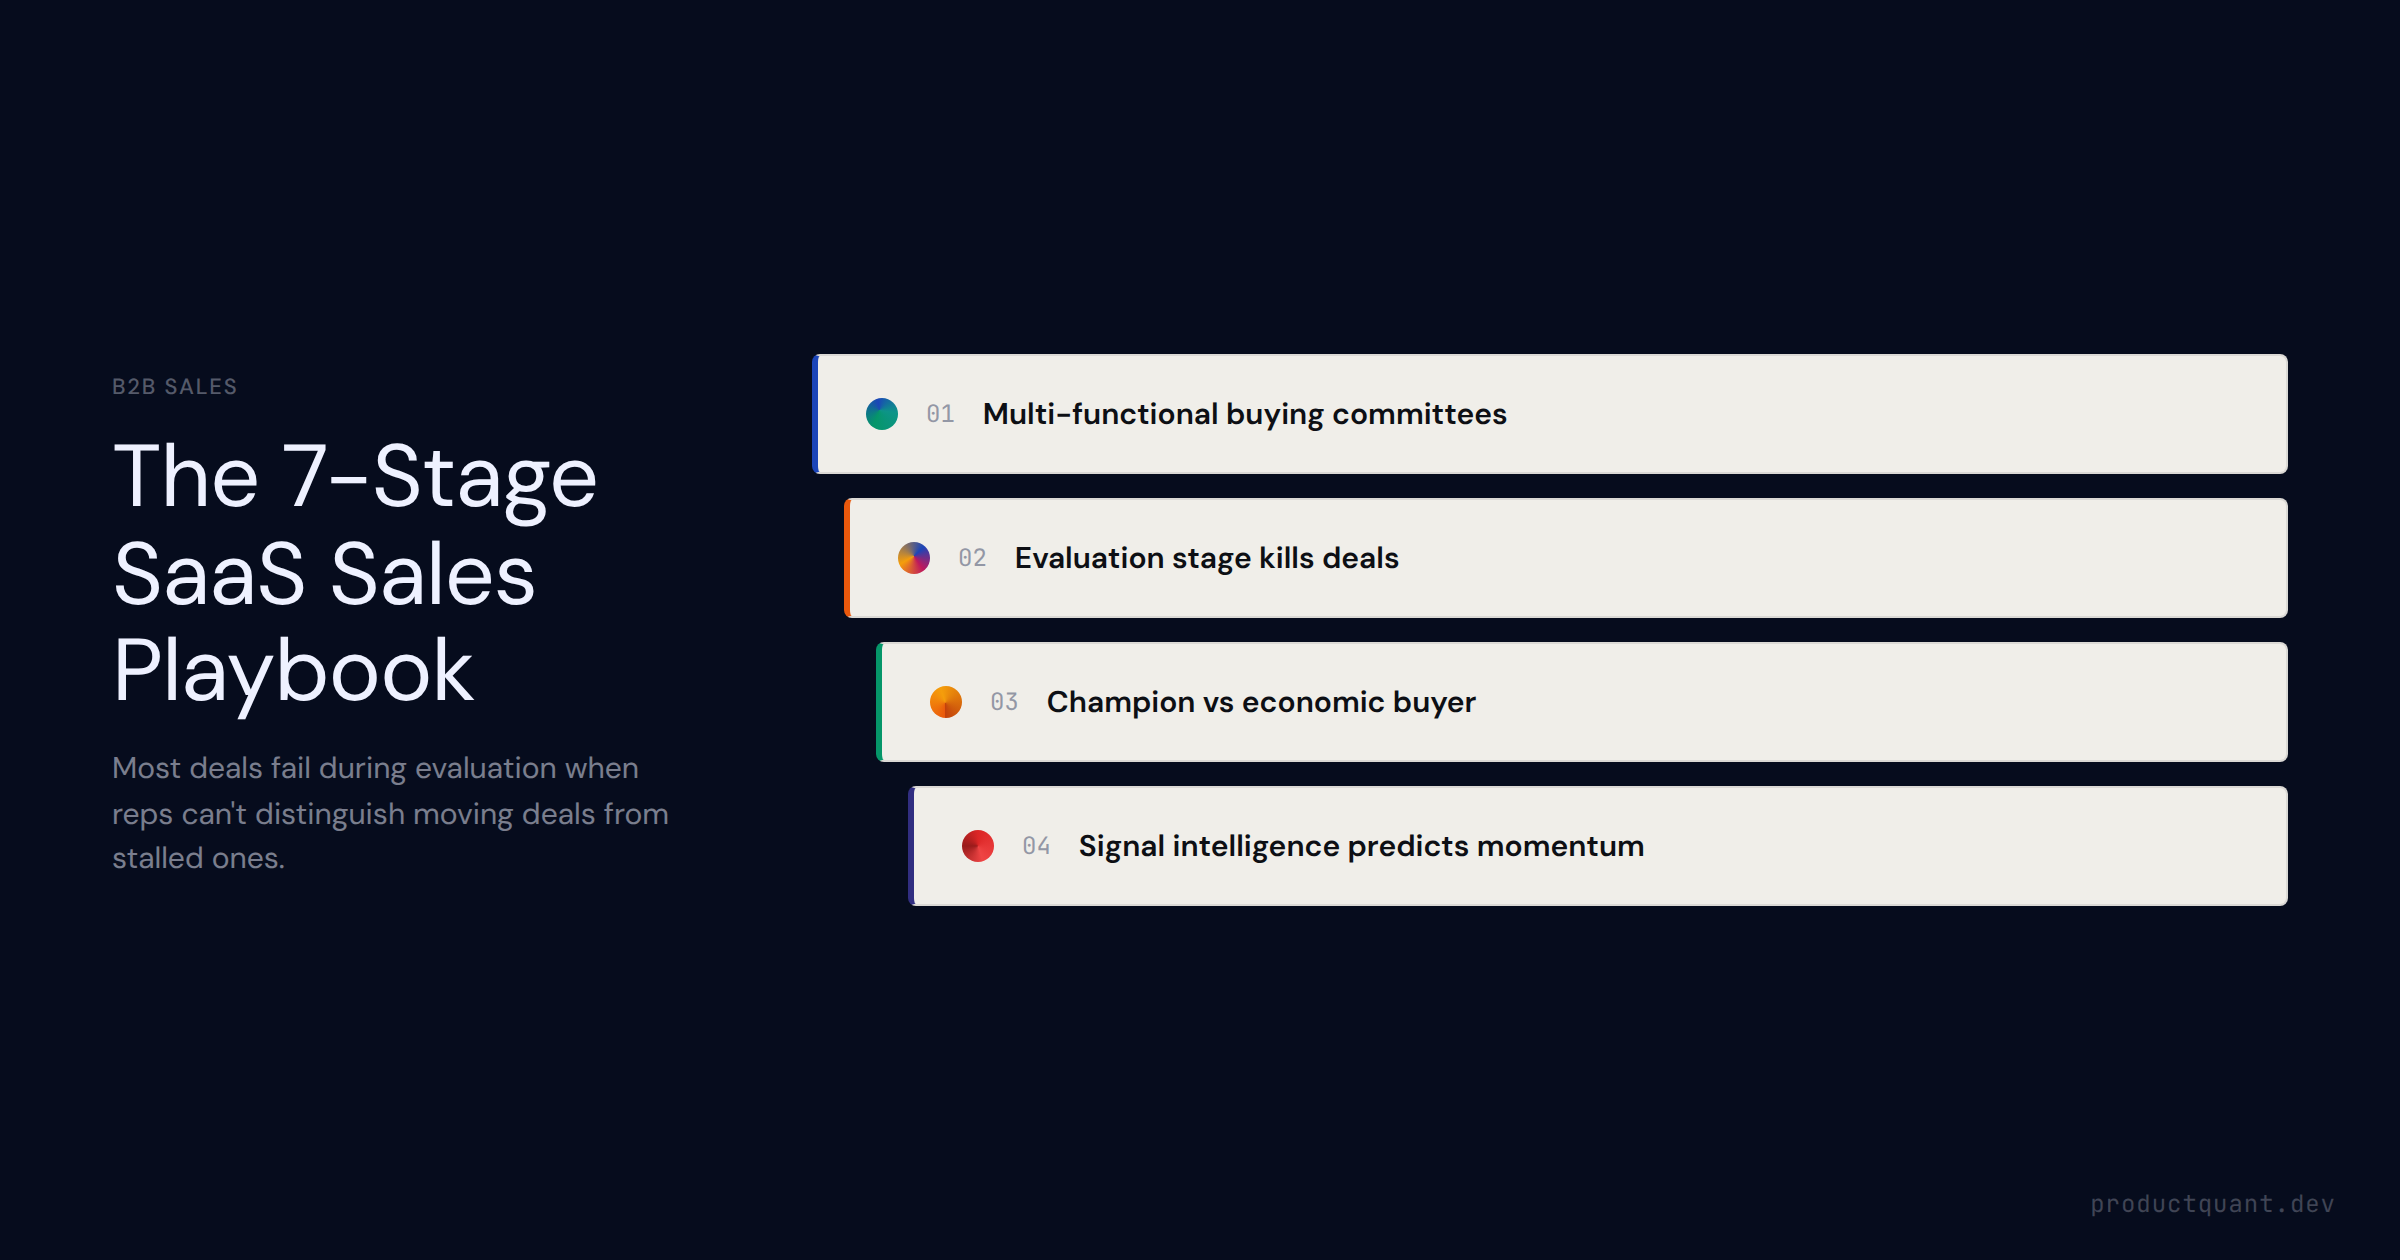
How the B2B SaaS sales process is structured — from first discovery call through signed contract — including the 7-stage model, multi-threading buying committees, champion vs. economic buyer dynamics, and signal intellig
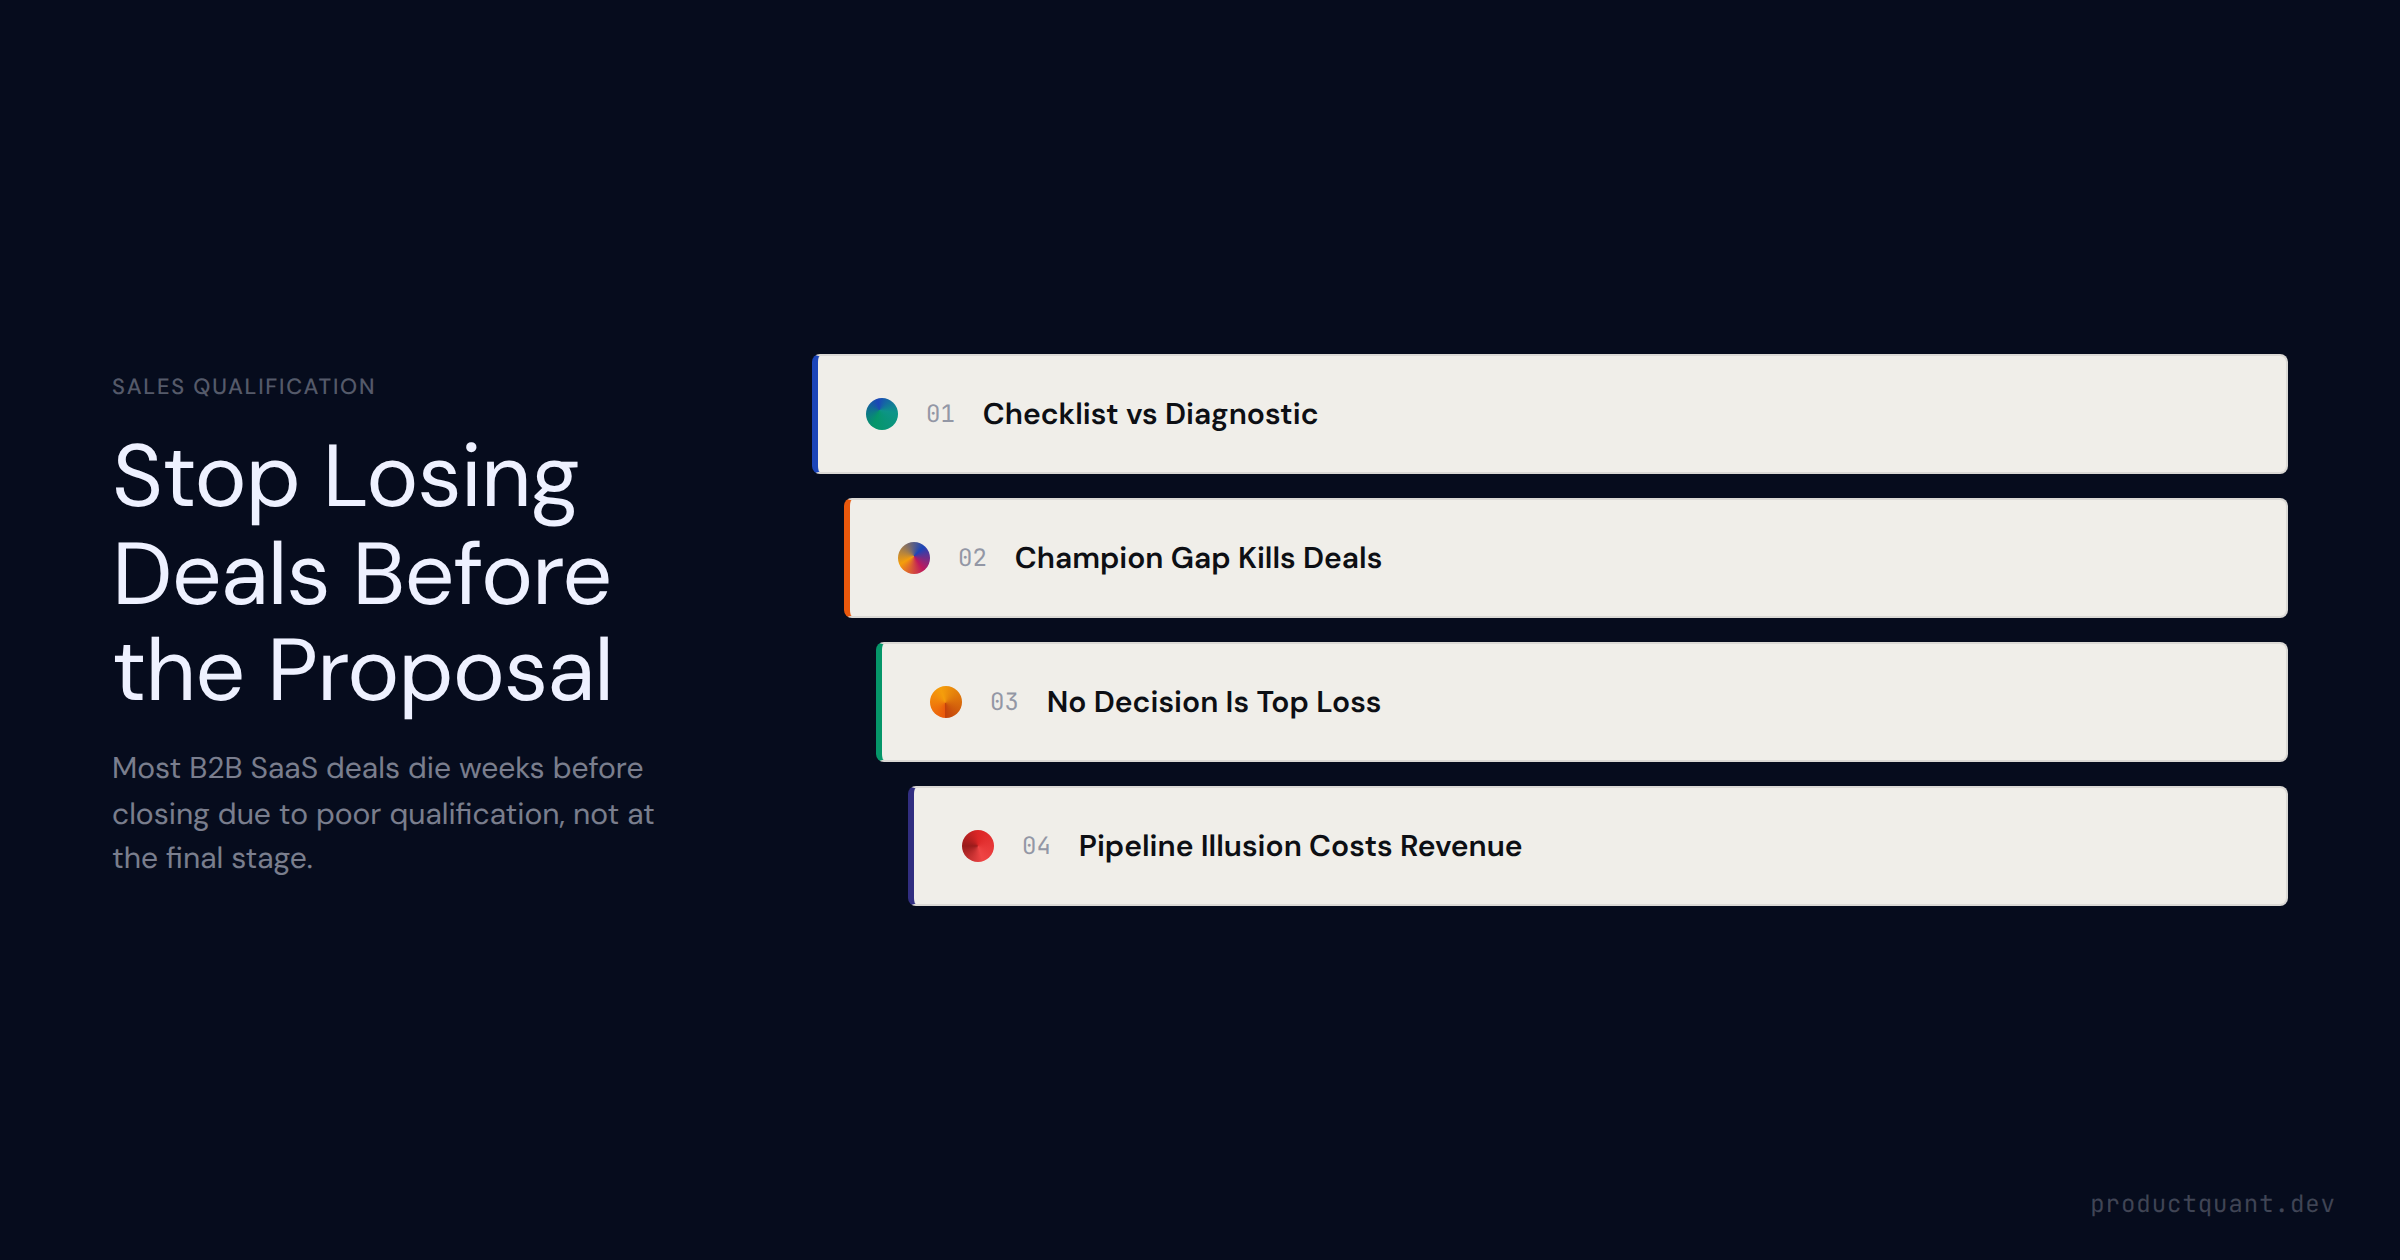
How to qualify B2B SaaS deals using MEDDIC, MEDDPICC, BANT, and SPICED — when each framework works, why mechanical application kills pipeline, and how product usage signals answer the hardest qualification questions with
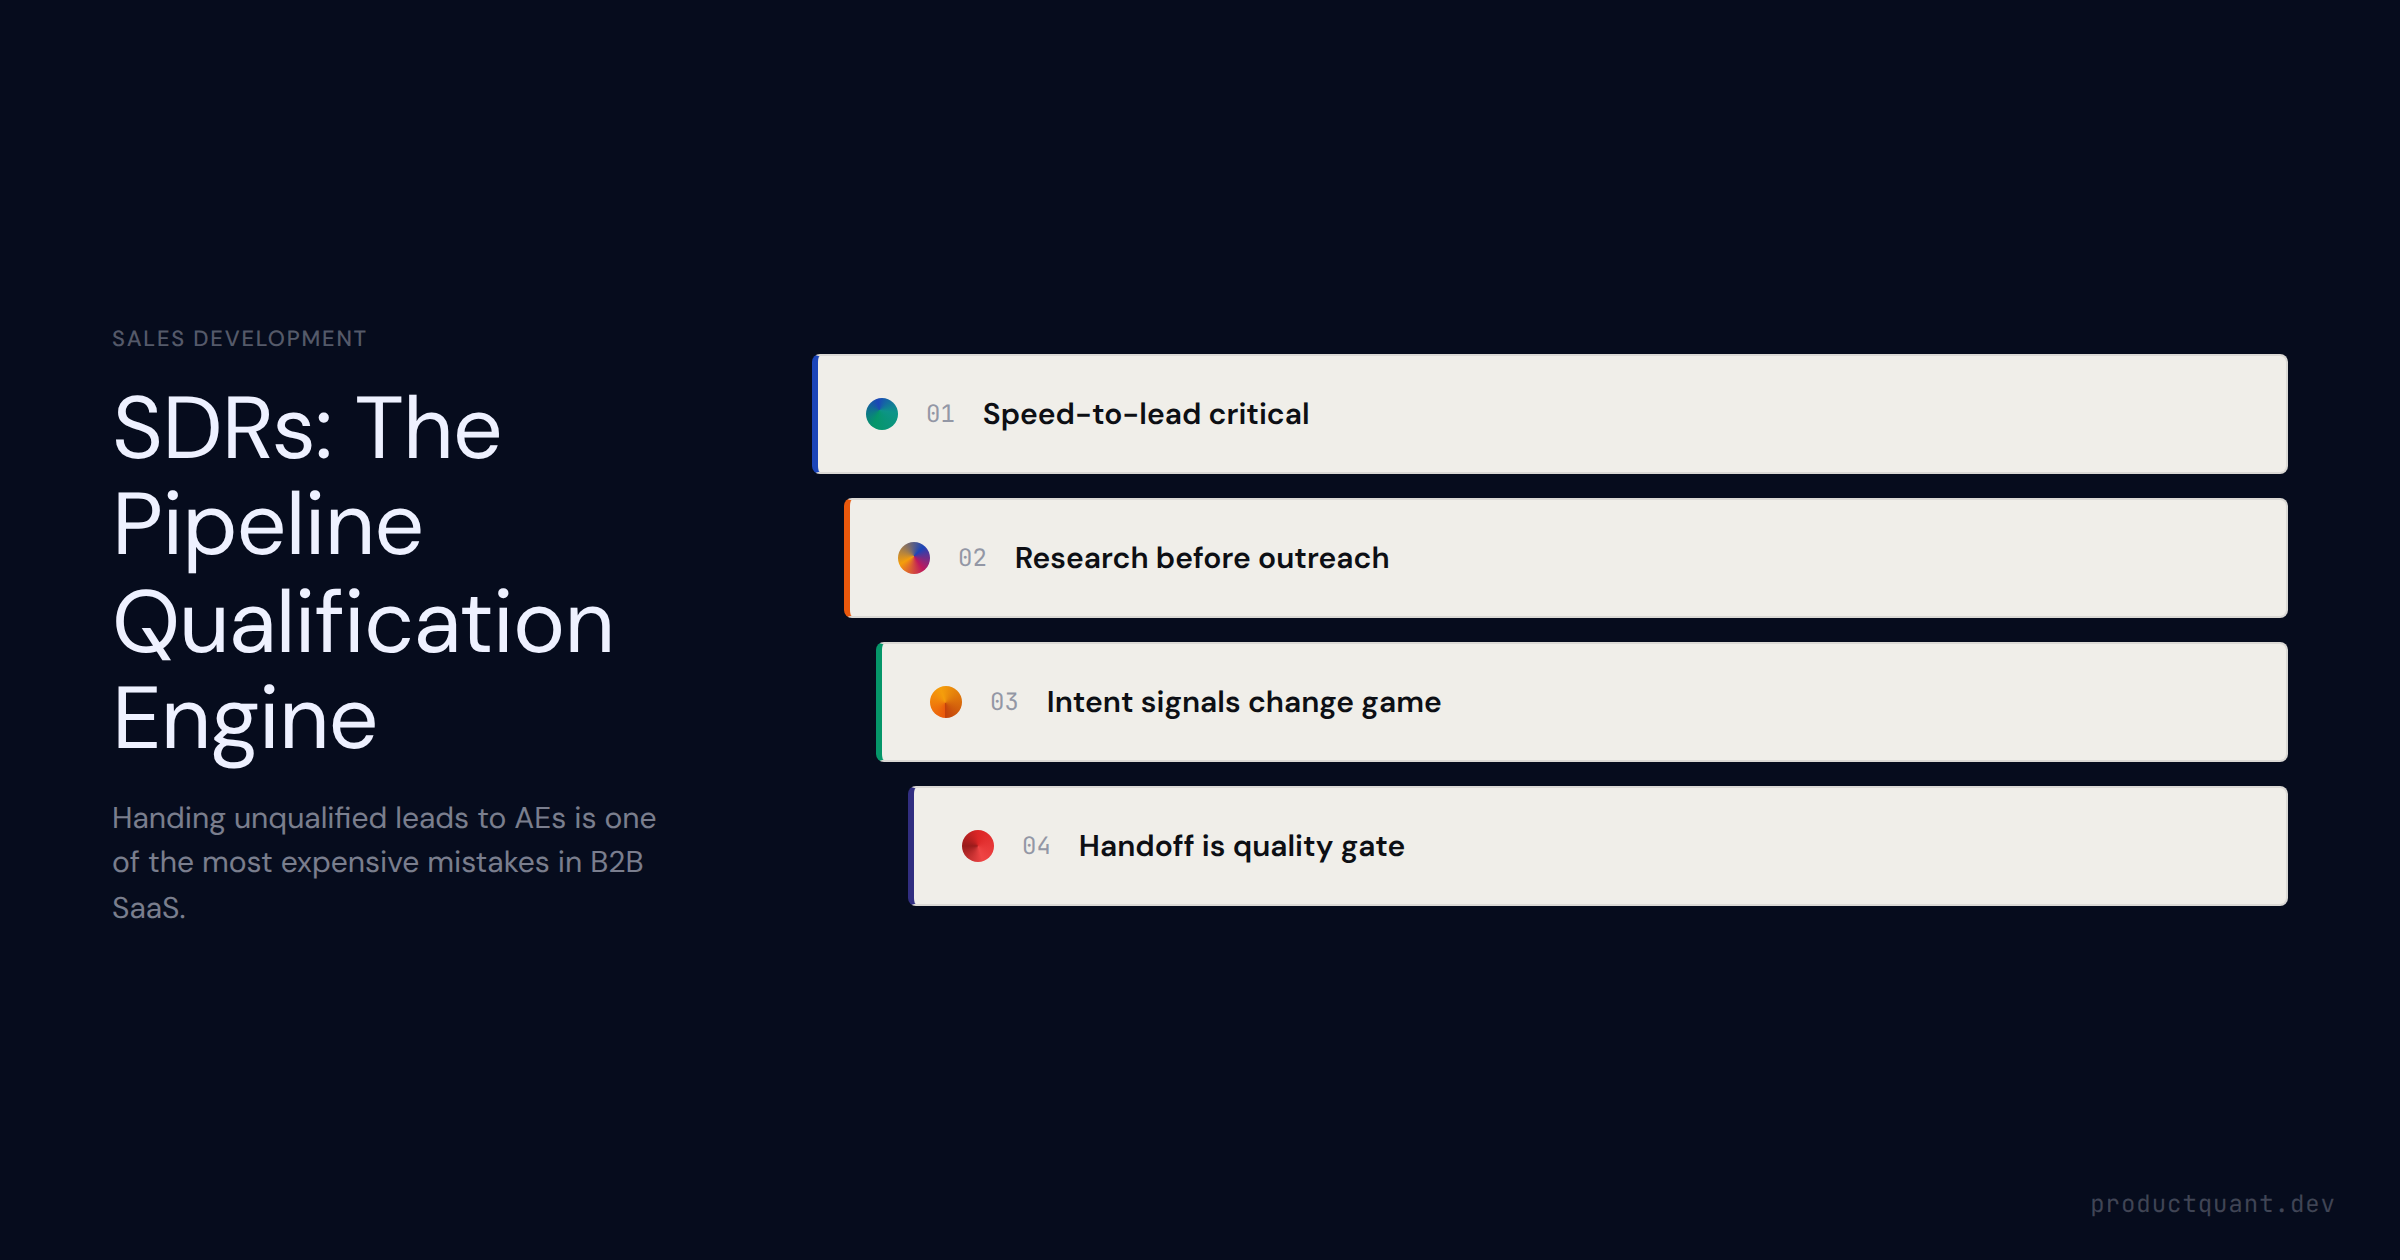
What the SDR role actually does in B2B SaaS — inbound vs. outbound motions, SDR metrics (dials, connects, qualified meetings), account research, personalization, signal intelligence, and the SDR→AE handoff criteria that
The three upsell types in B2B SaaS, how usage signals create natural upsell windows, the conversation structure that closes without a pitch, and the metrics that separate effective programs from pushy ones.

Most B2B sales enablement programs are content libraries with a training calendar. Here
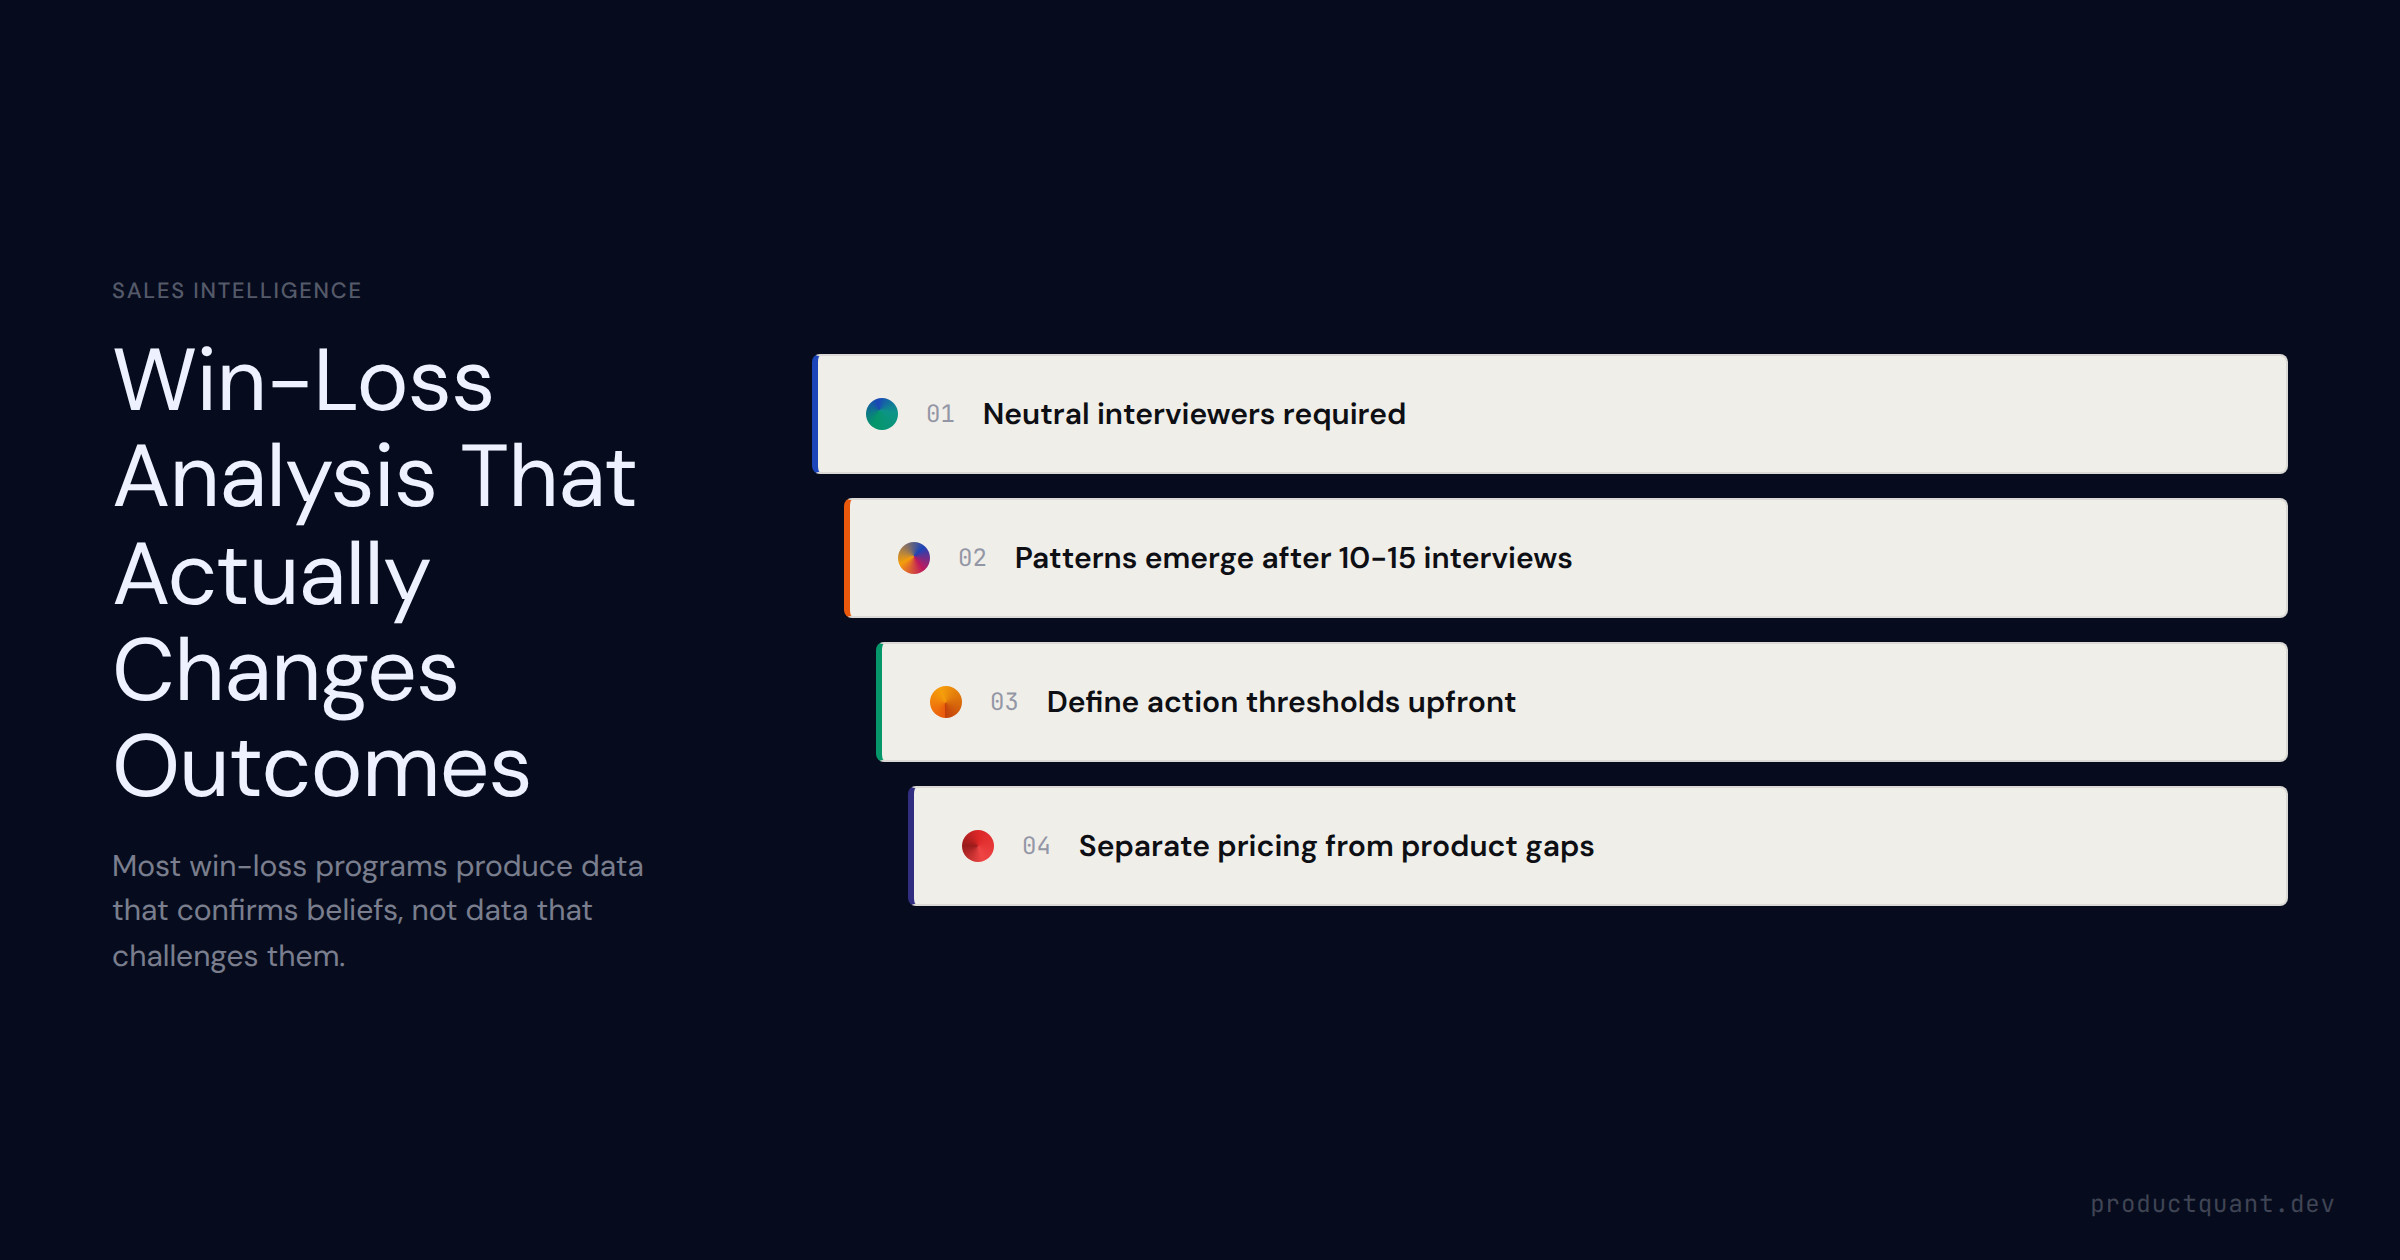
How to run win-loss analysis in B2B SaaS — who should conduct interviews, how to classify loss reasons by signal pattern, and how to translate findings into sales enablement and product roadmap decisions.
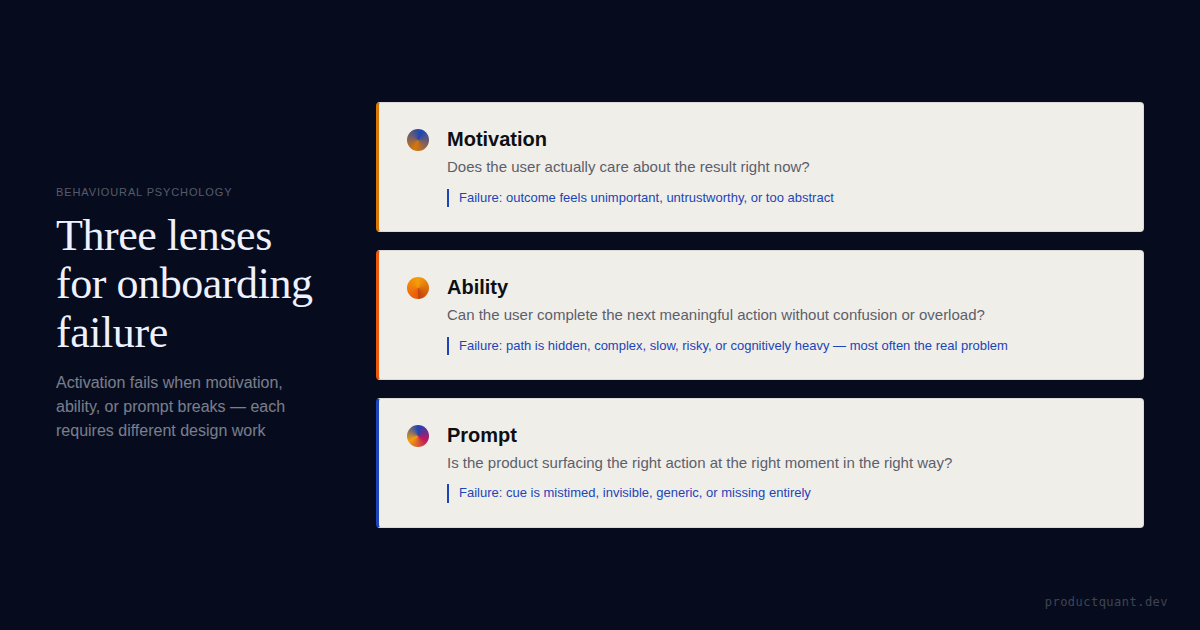
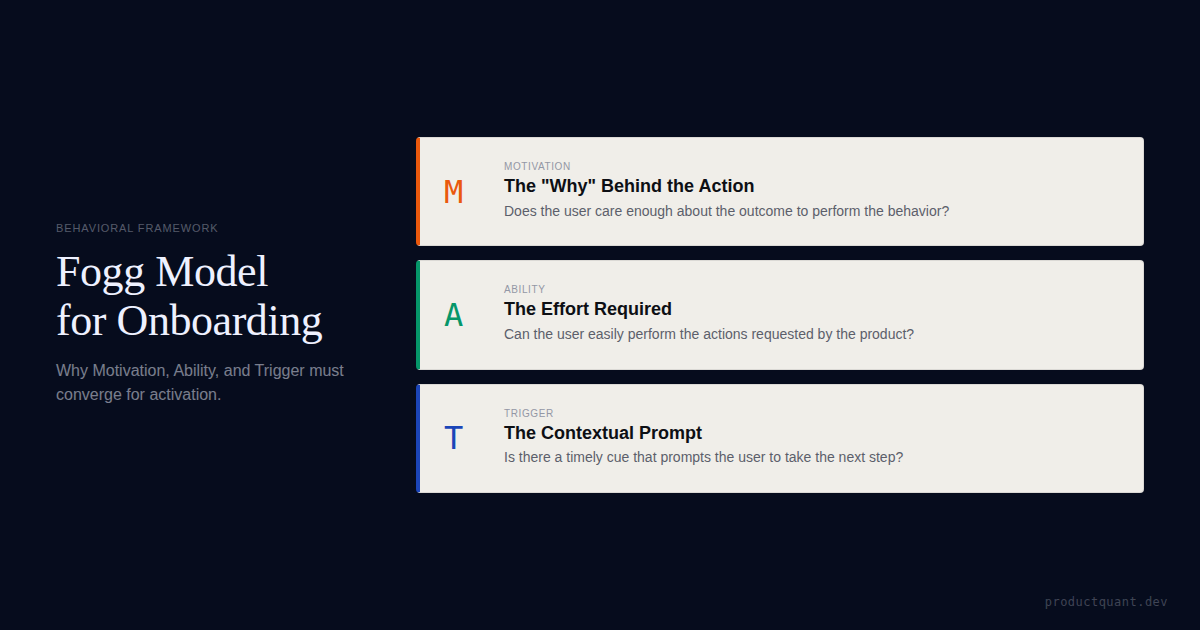
Use the BJ Fogg model to diagnose SaaS onboarding problems: when activation failure is really about ability, prompts, and first-win design.
The 10 best A/B testing tools for SaaS in 2026 compared: Statsig, PostHog, GrowthBook, VWO, Optimizely and Eppo by team type, statistical rigor and velocity.
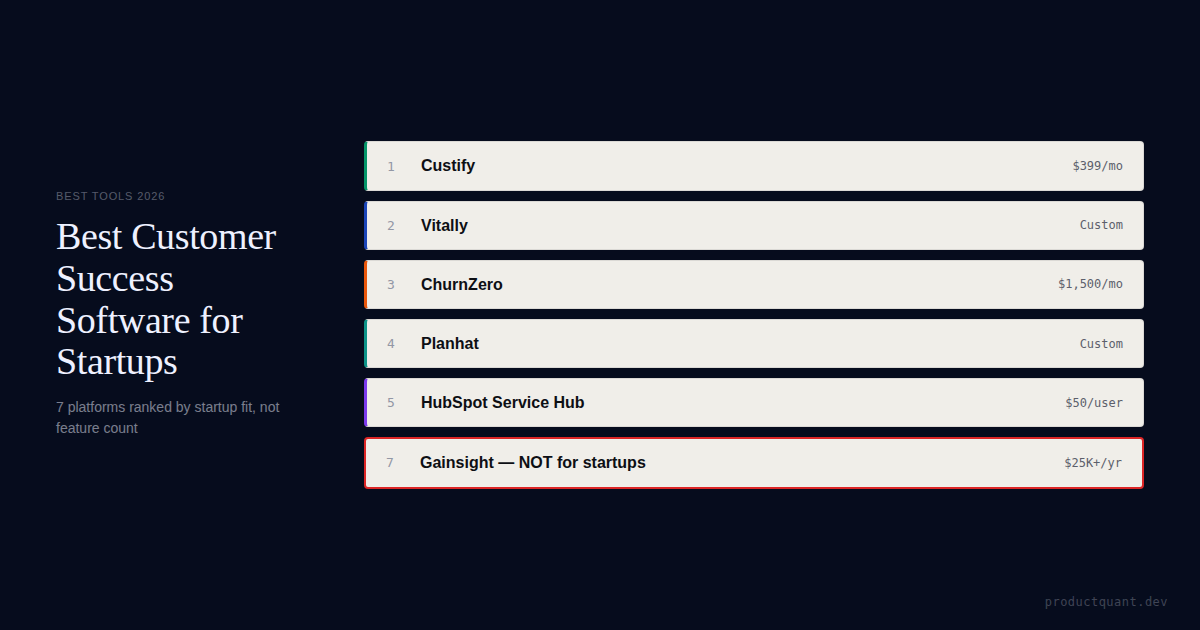
The best customer success software for startups in 2026: Custify, Vitally, ChurnZero, Planhat ranked by price, deployment time, and CS Ops burden.
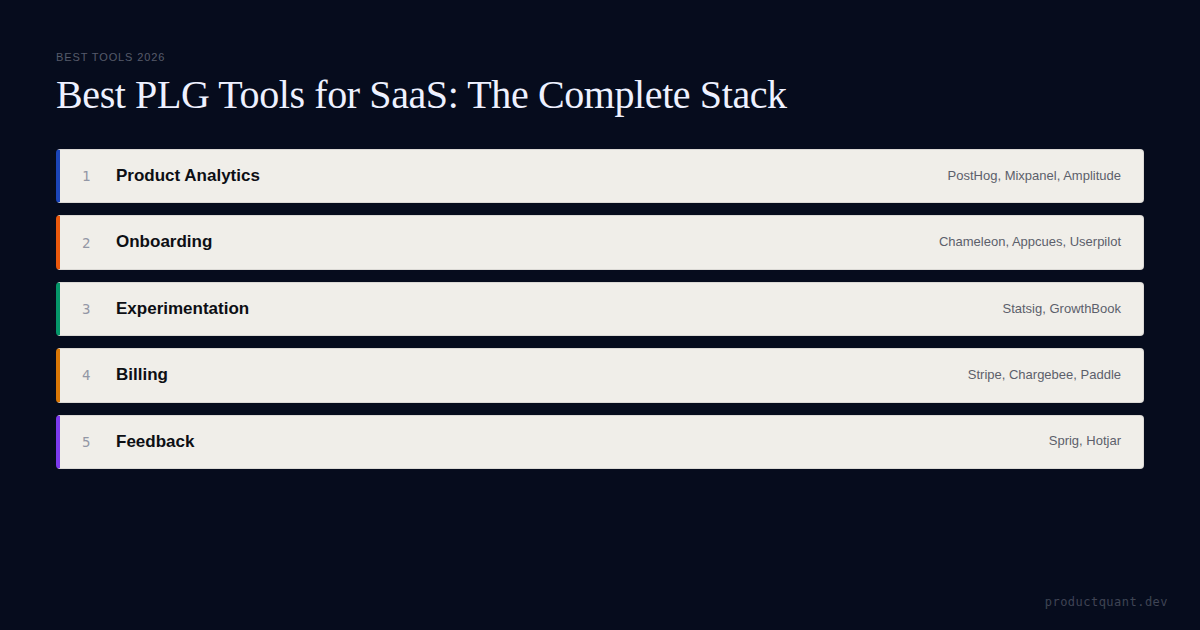
The complete PLG stack by layer and stage: analytics, onboarding, experimentation, billing, and feedback. From $300/mo seed to $6,000/mo Series B+.
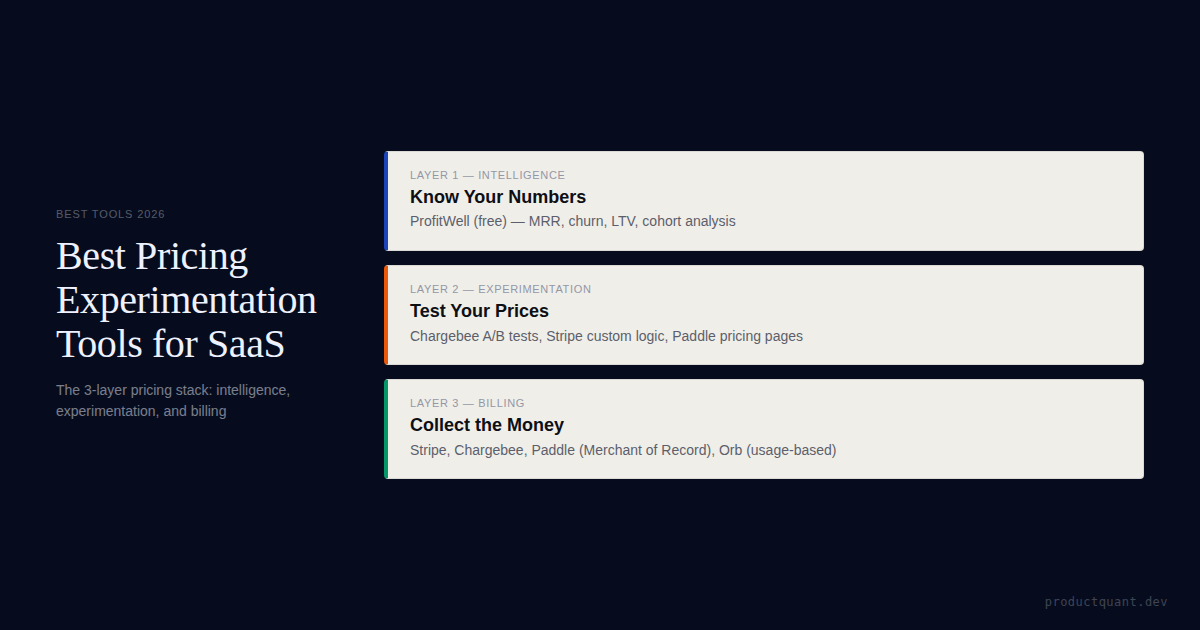
Discover the best B2B SaaS pricing experimentation tools for 2026. Compare ProfitWell, Chargebee, Stripe, Paddle, and Orb by stage and use case. Learn B2B SaaS pricing strategies and pricing page best practices.
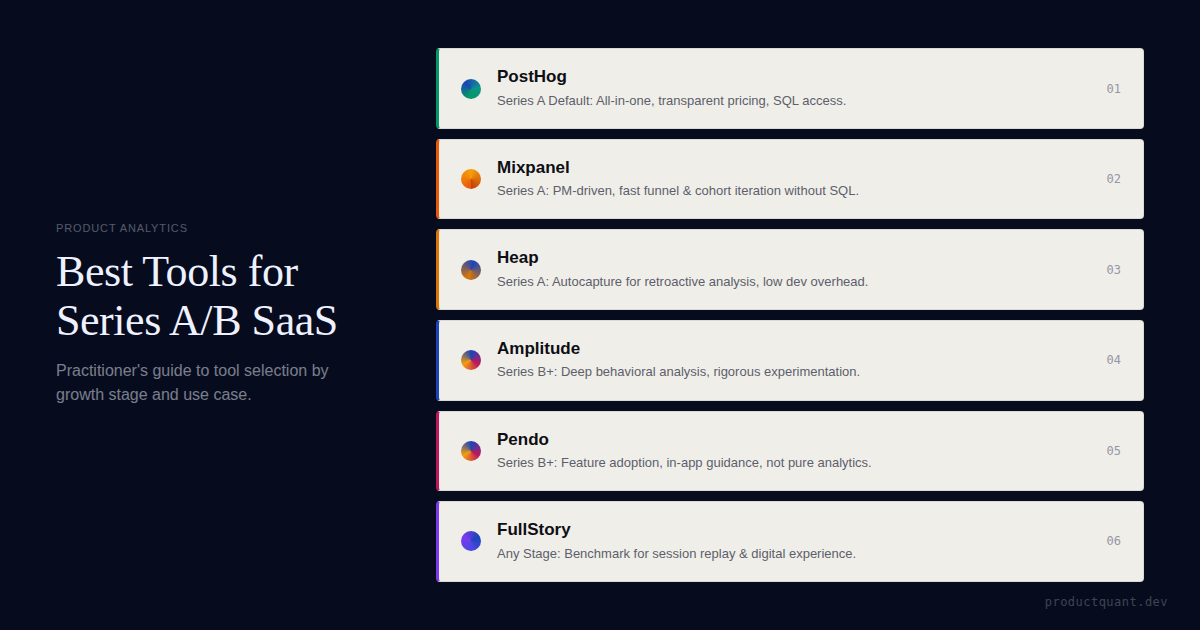
PostHog, Amplitude, Mixpanel, Heap, Pendo, FullStory — not a feature comparison matrix. What I
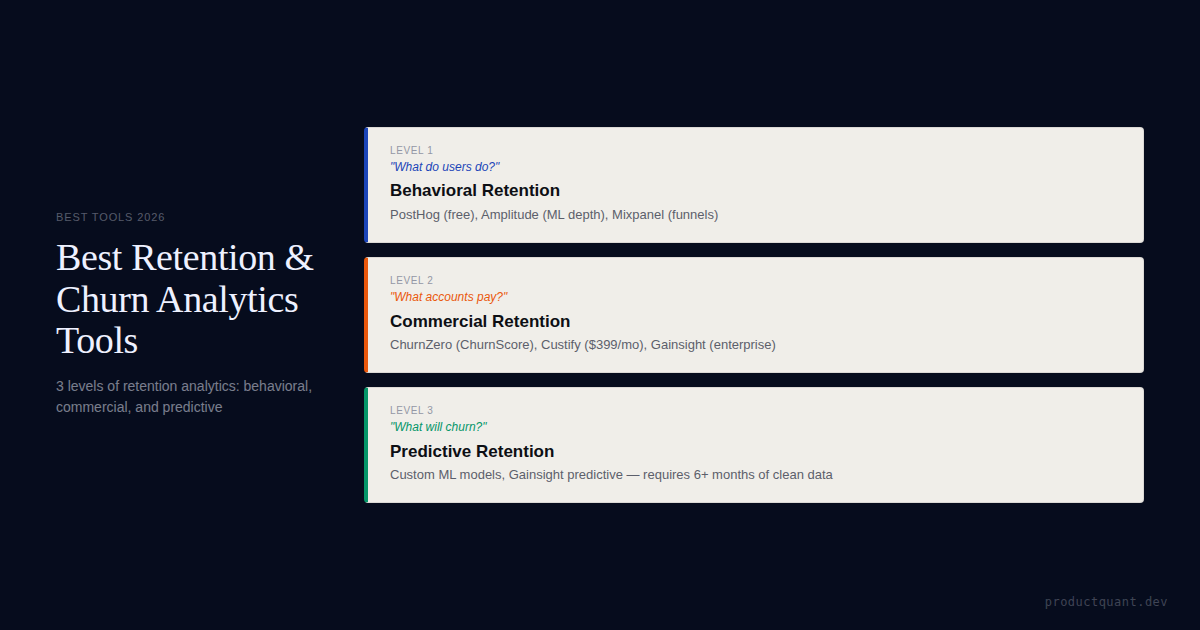
Retention analytics at 3 levels: behavioral, commercial, and predictive. PostHog, Amplitude, ChurnZero, and Gainsight compared by capability.

Feature adoption silos drain retention and mask the real levers of growth. This blueprint maps the structural root cause to a concrete, repeatable process:
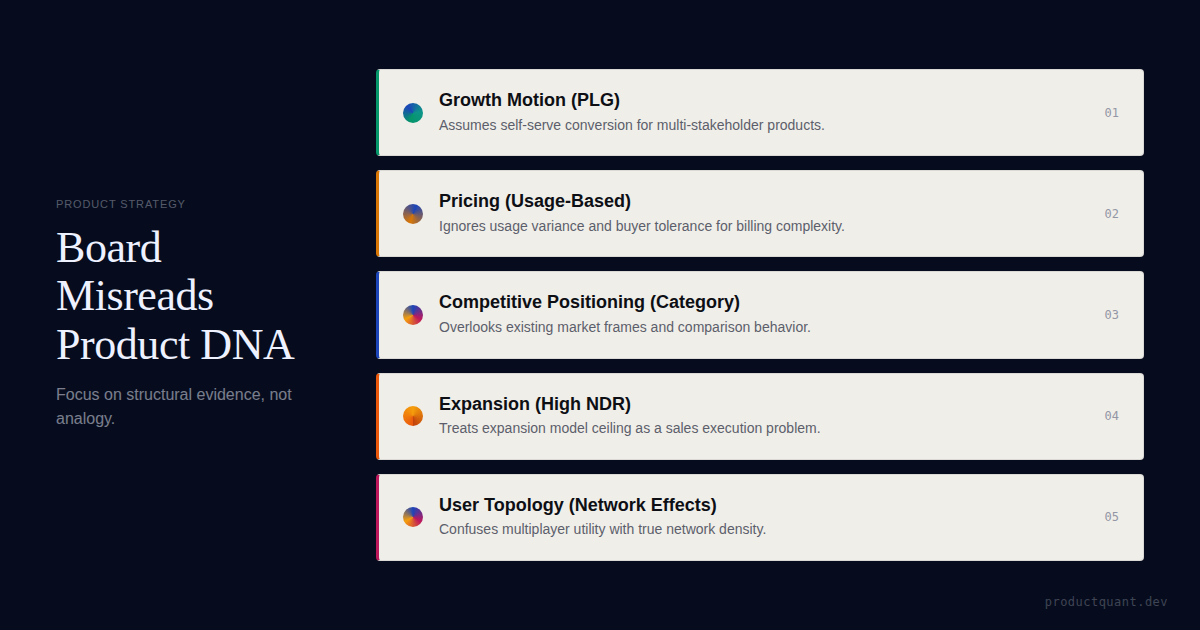
Boards often pattern-match from portfolio winners instead of reading product structure. Here is how to push back with Product DNA evidence.
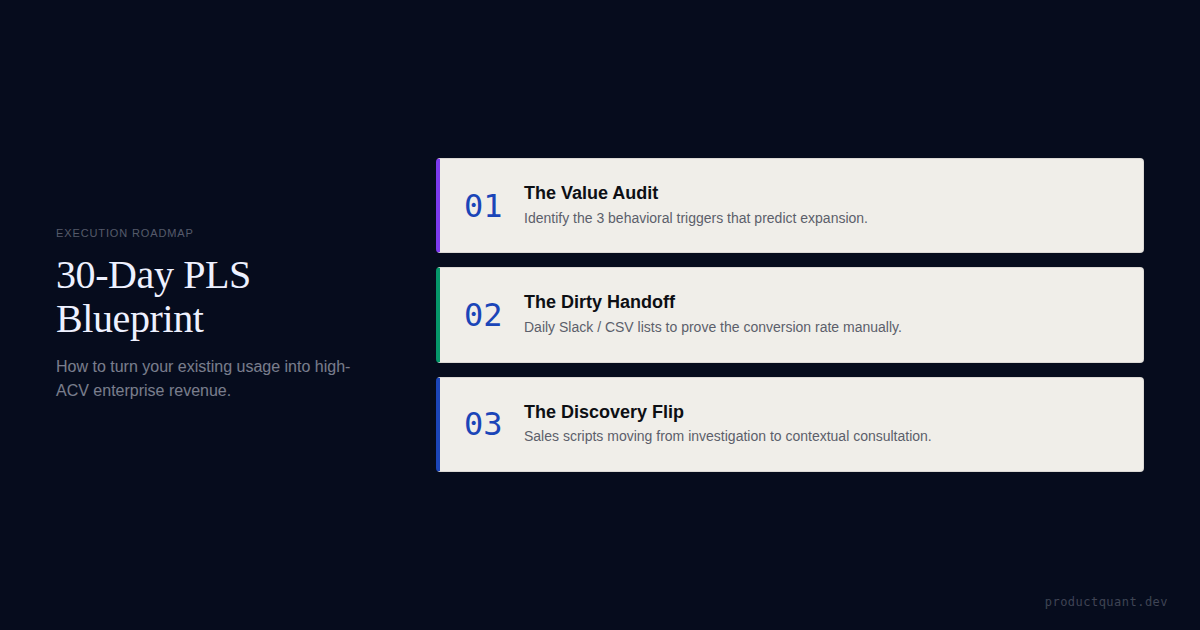
Stop waiting for a perfect data stack. Learn the 30-day blueprint for turning existing usage data into a high-converting Product-Led Sales pipeline.
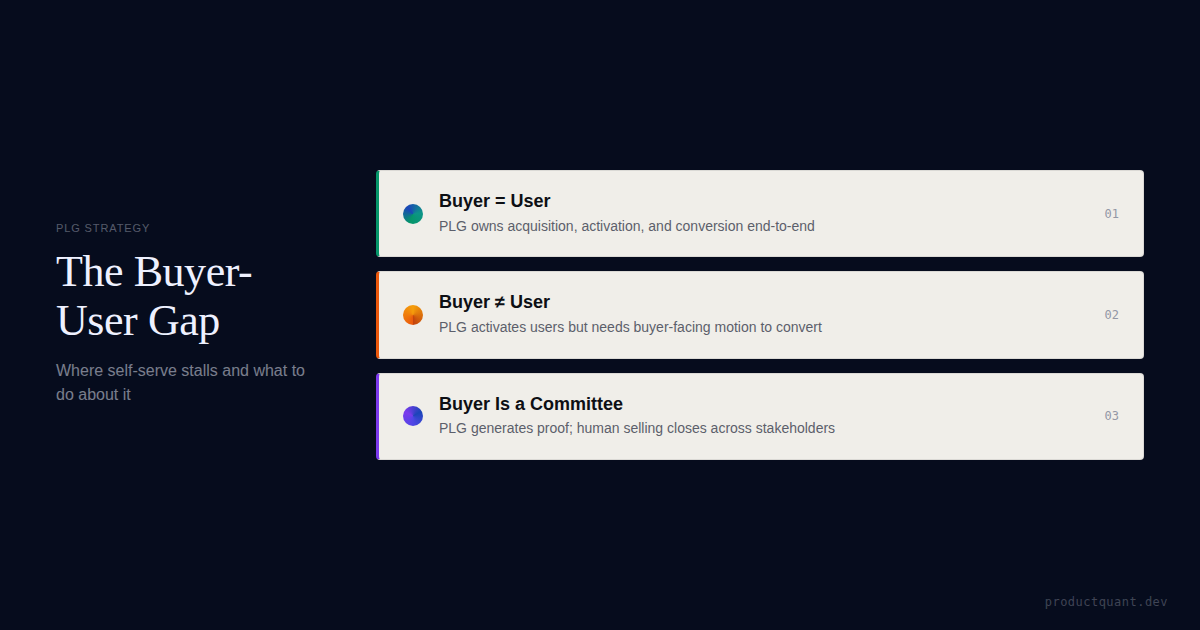
When the user who gets value is not the buyer, self-serve conversion often stalls. Here is how to redesign the motion around the buyer-user gap.
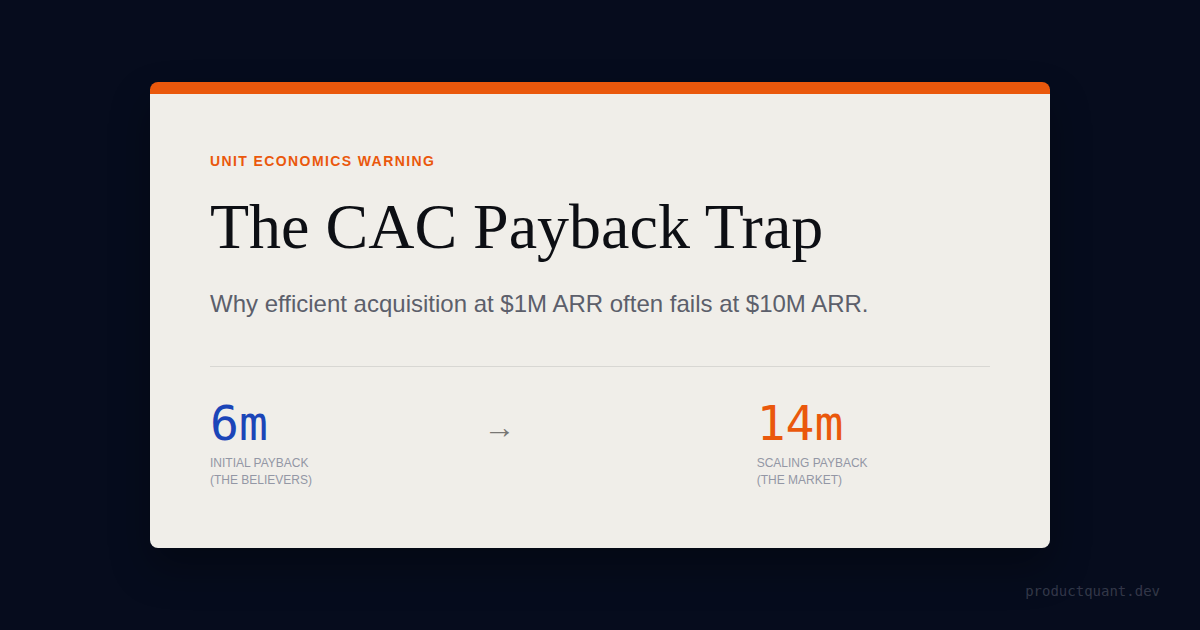
Your 6-month CAC Payback might be a lie. Learn why early efficiency is a function of audience exhaustion and why your payback must increase as you scale.
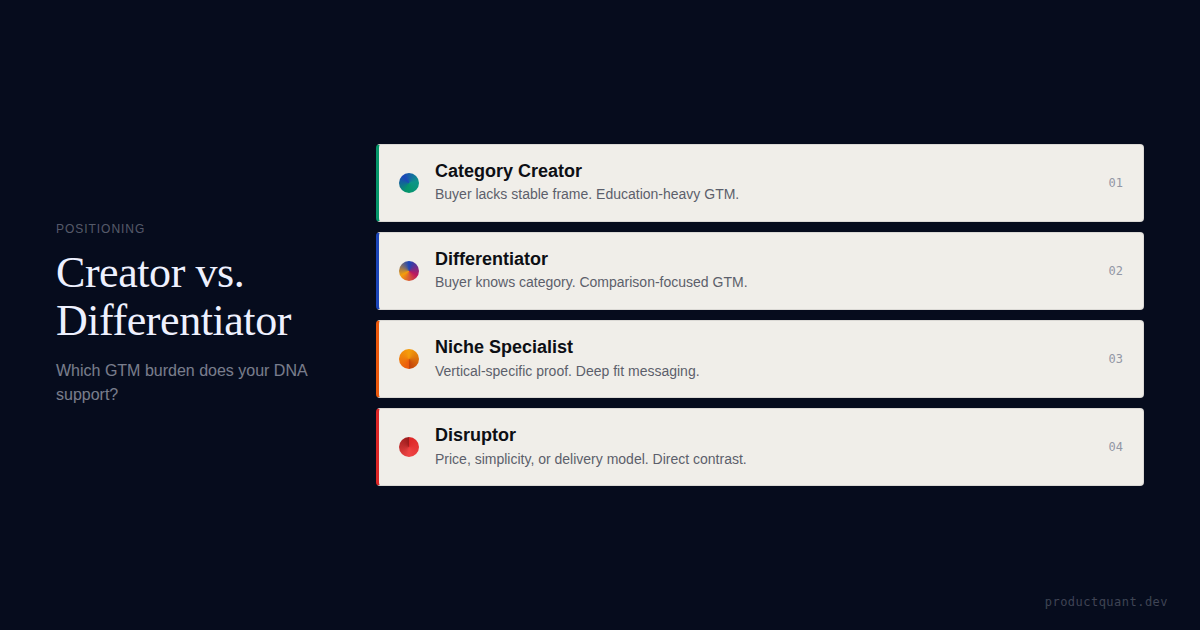
Most SaaS companies call themselves category creators when they are really differentiators. That mistake quietly breaks content, GTM, and sales efficiency.
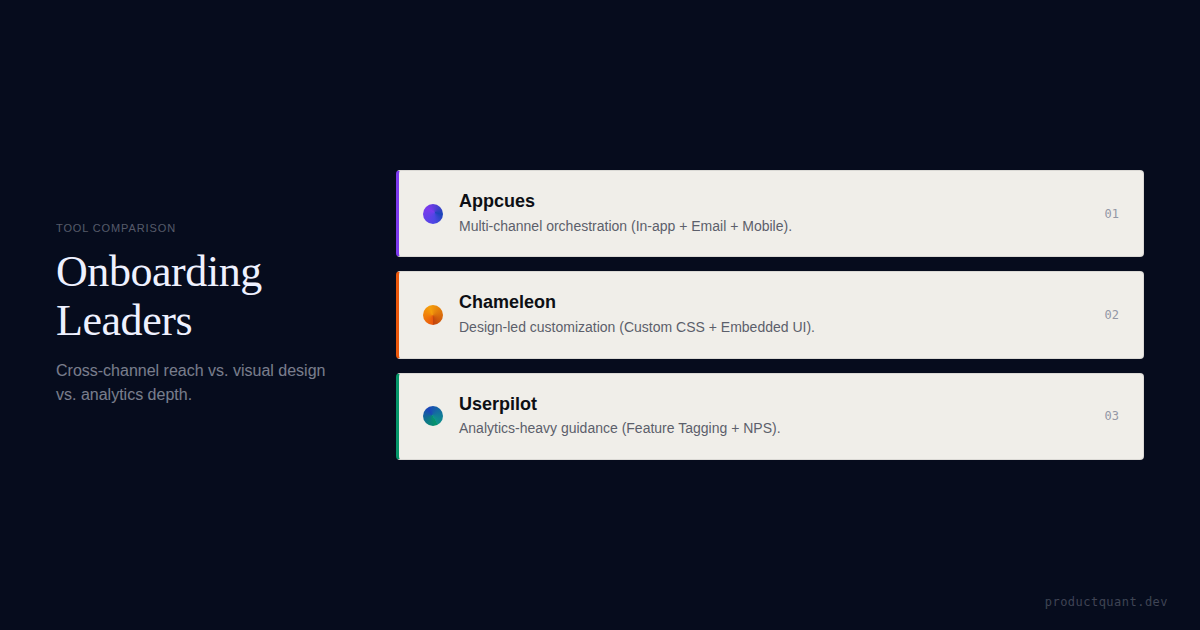
Three tools. Three philosophies. The complete comparison with real pricing, feature analysis, and G2 user ratings for SaaS onboarding teams.
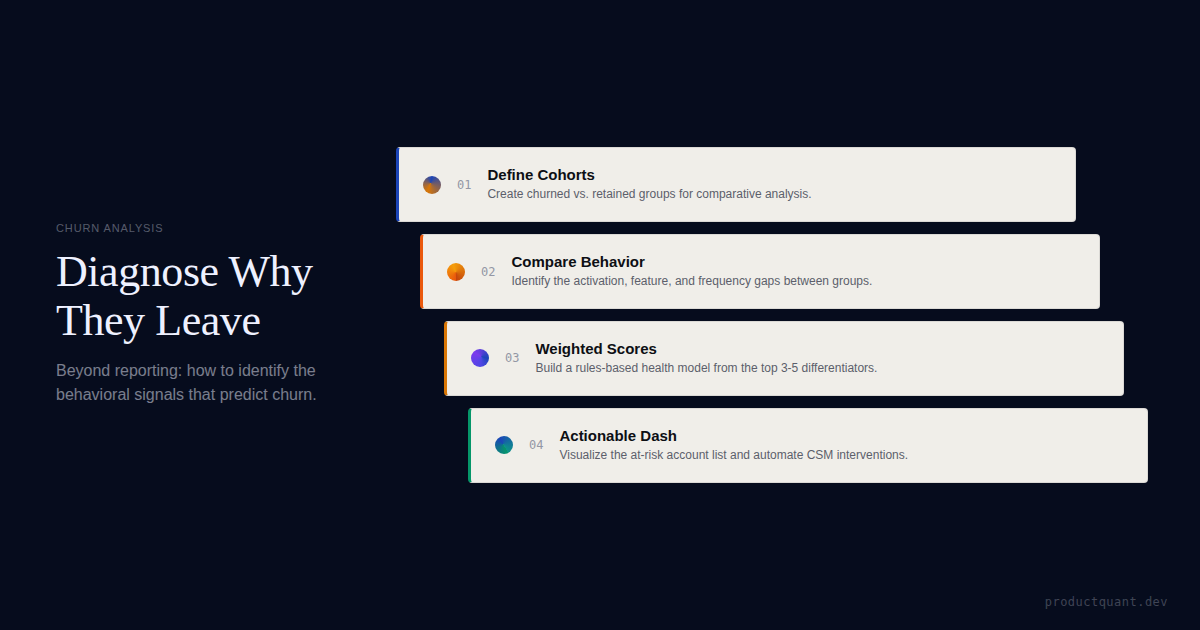
4-step PostHog churn analysis workflow with HogQL queries, cohort comparison methodology, health score construction, and dashboard building.
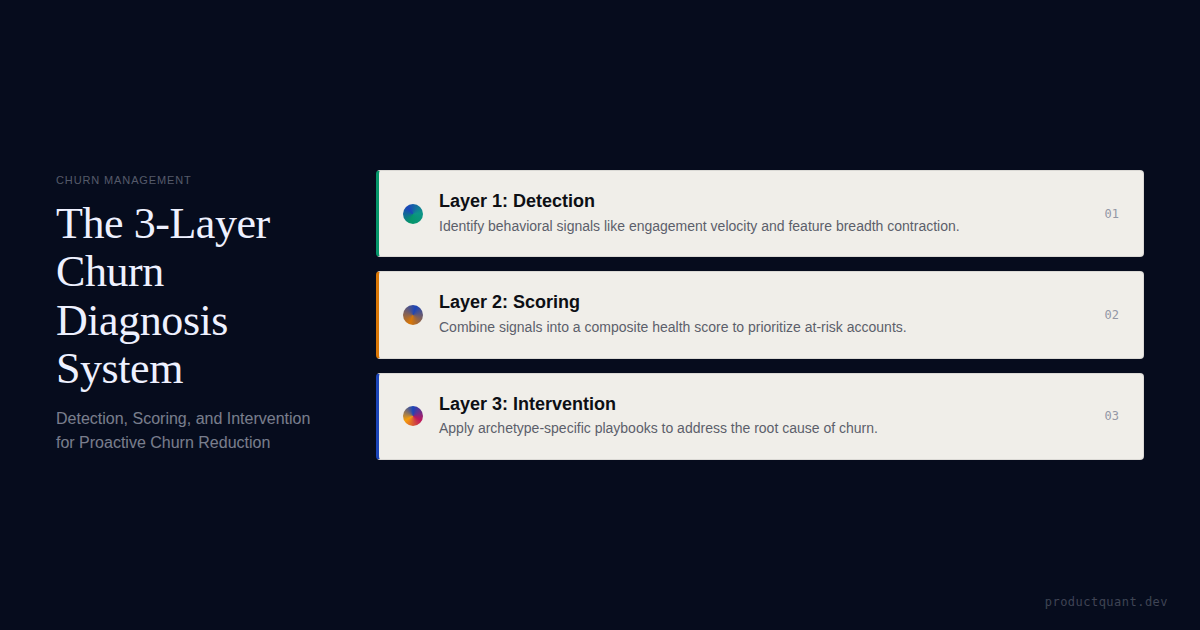
Most churn prediction systems fail at the one thing that matters: triggering an intervention before the customer cancels. This piece documents the 3-layer
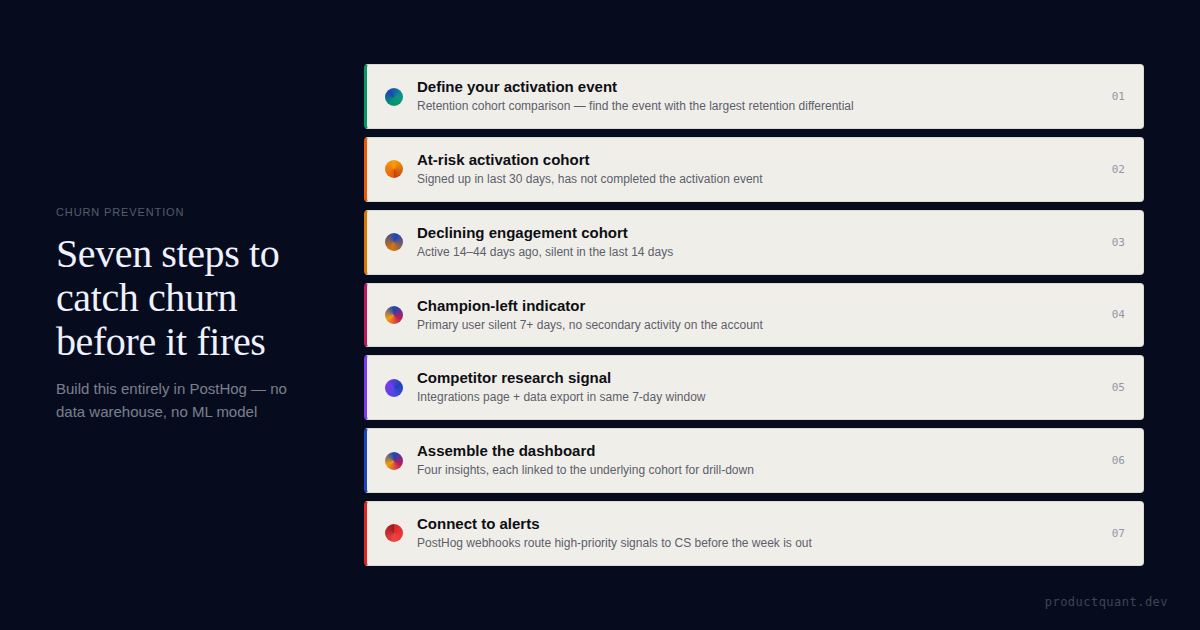
A churn dashboard that tracks cancellations tells you what already happened. An early warning dashboard tracks the behaviours that precede cancellation — weeks before the decision solidifies. How to build one in PostHog
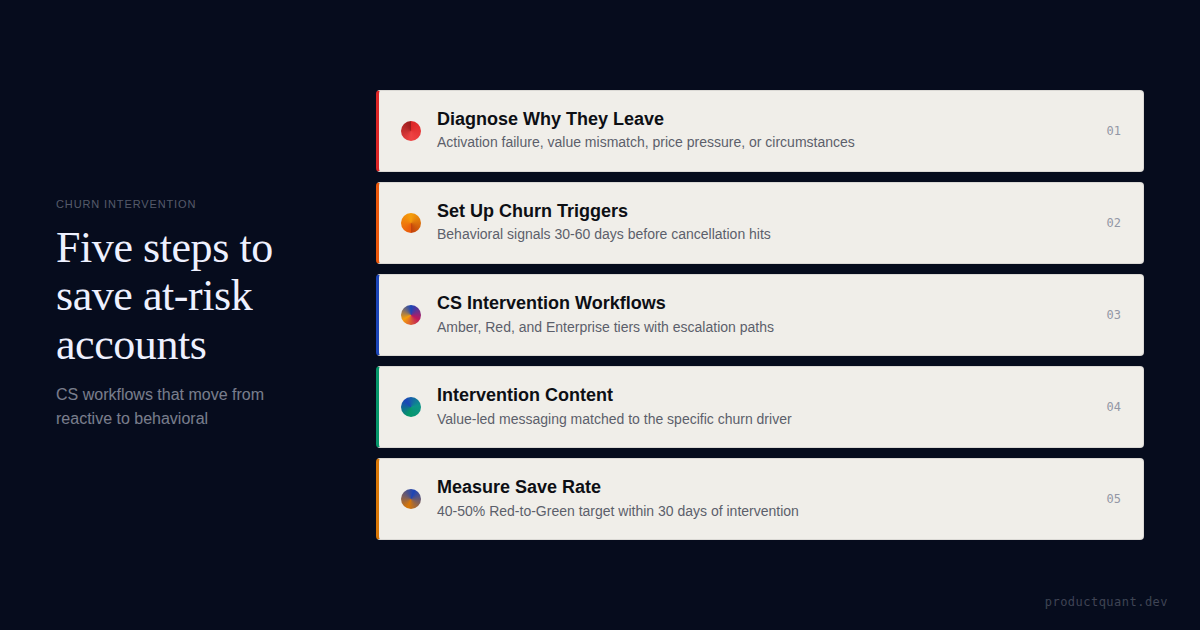
A structured CS playbook for B2B SaaS: the triggers that should fire interventions, how to tier response by ARR, what to say, and how to measure whether it worked.
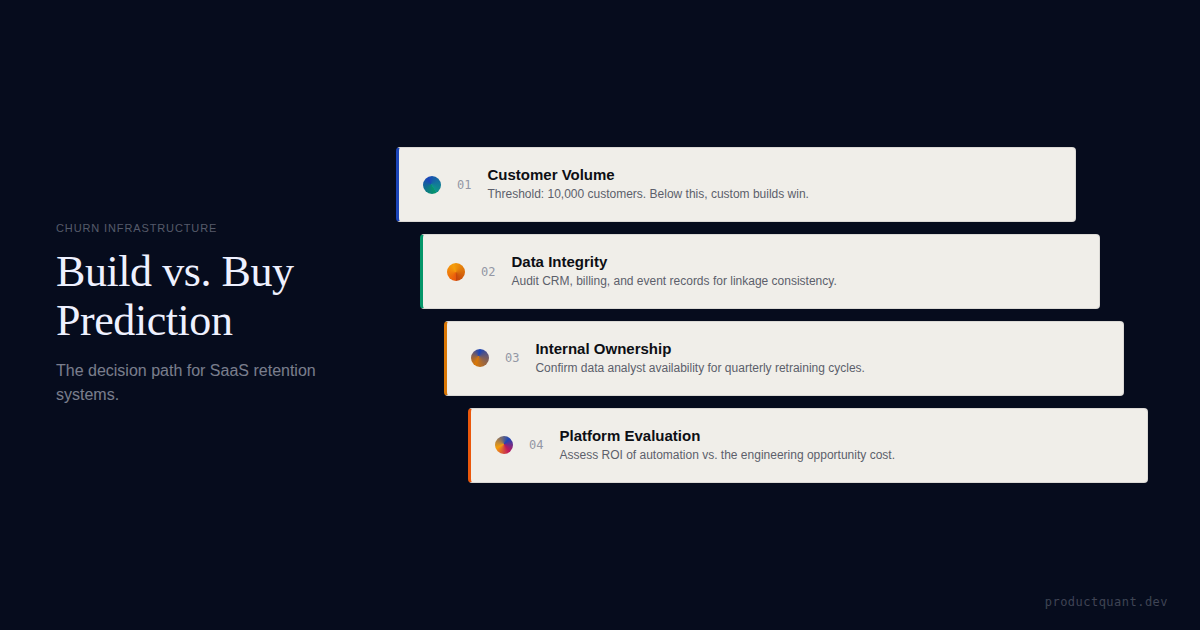
Should you build a custom churn model or buy a CS platform? The build vs. buy decision based on customer count, data quality, and CS team capacity.
Most churn models are built from whatever data is lying around. Connect event taxonomy, health signals, and churn prediction before building another noisy B2B SaaS risk model.
What are the best churn prediction models for B2B SaaS? Compare RFM, logistic regression, XGBoost, survival analysis, and deep learning to find the right fit for your data and team.
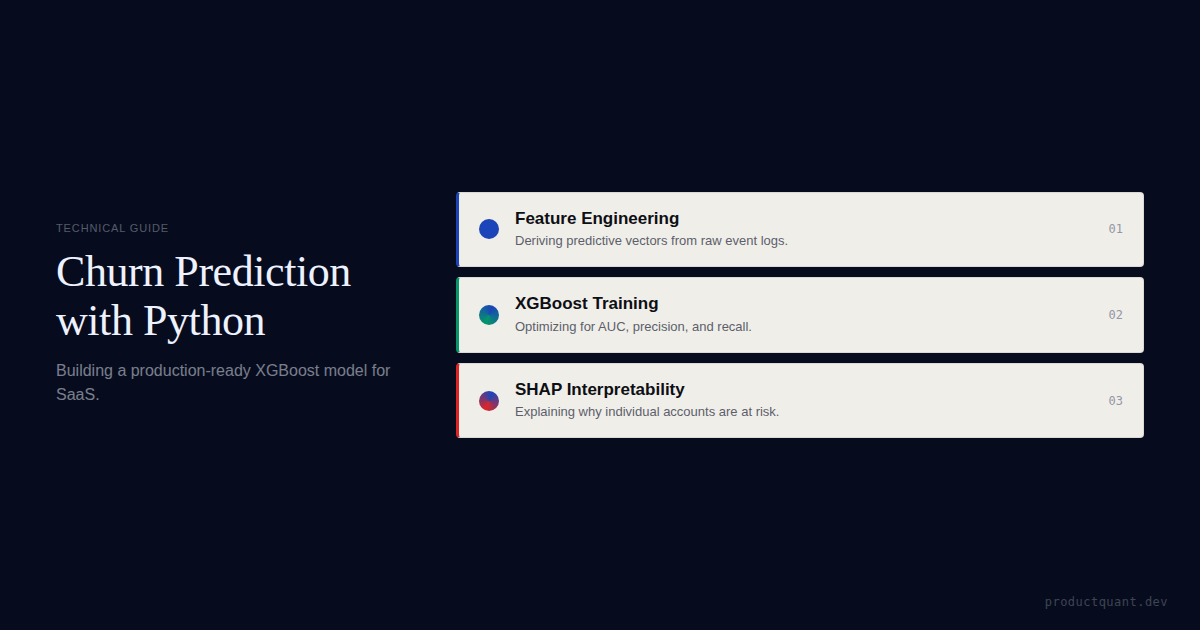
Build a churn prediction model in Python for SaaS. Feature engineering, XGBoost training, SHAP explanations, and weekly at-risk list deployment guide.
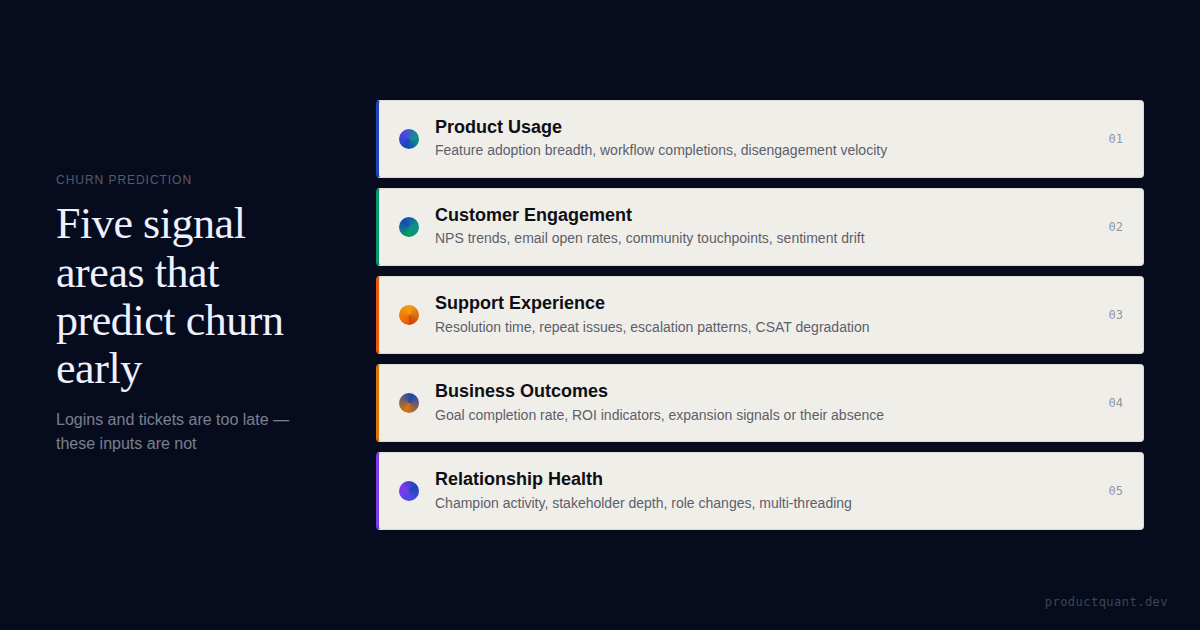
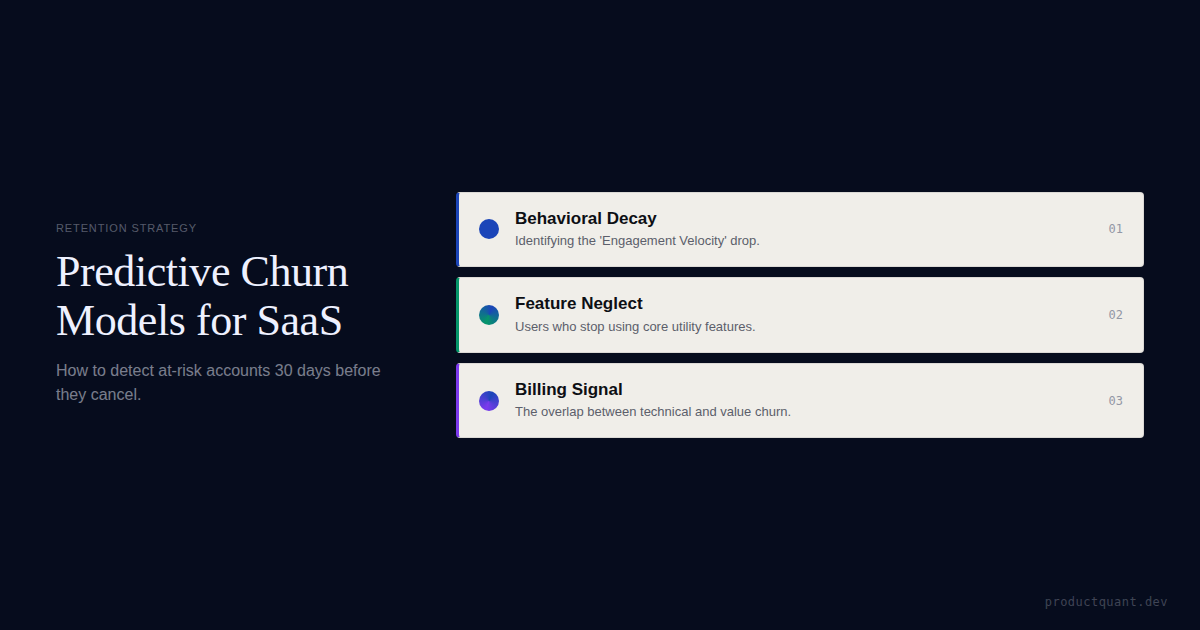
Most SaaS teams track churn after it happens. This guide covers the behavioral, engagement, and commercial leading indicators that surface churn risk 30–90 days before renewal — and what to do with each signal.
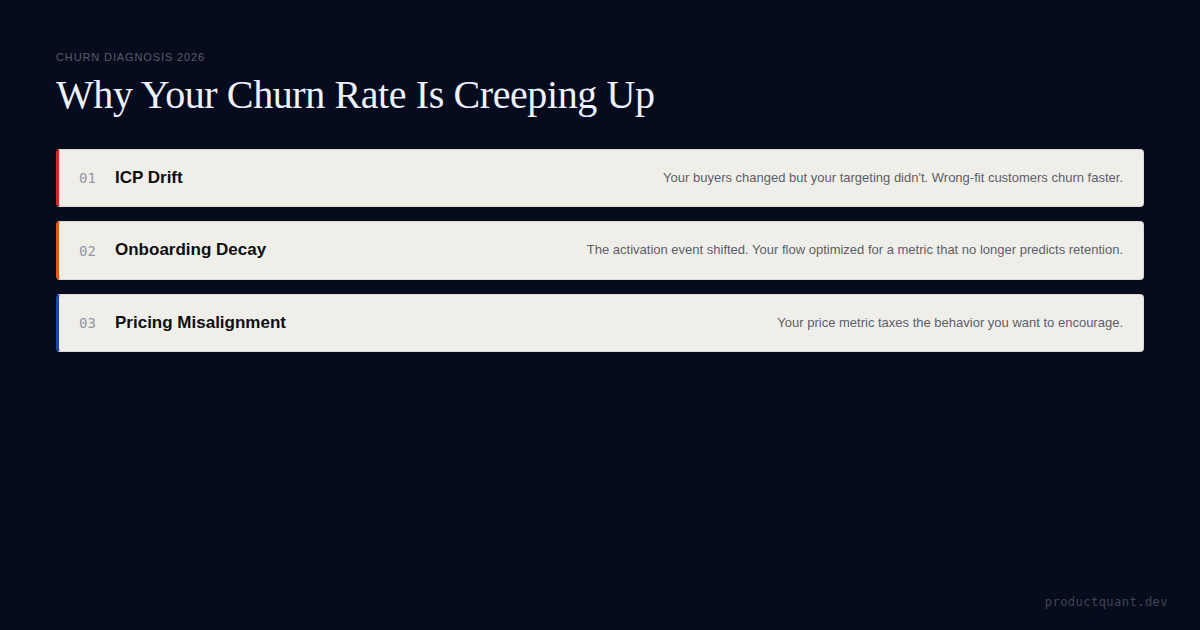
Churn creeping up 0.3% per month costs you 15% of your customer base before you notice. The 3 hidden causes and how to diagnose each one.
SPF, DKIM, and DMARC are table stakes. Domain warmup is mostly myth. Send cadence is the real lever. Here is how deliverability works in 2026 and what actually gets your cold email into the inbox.
Most cold email guides assume you already have a contact list. The enrichment-first strategy reverses the sequence: enrich first, build the list second, send third. This turns cold outreach into a pipeline-construction p
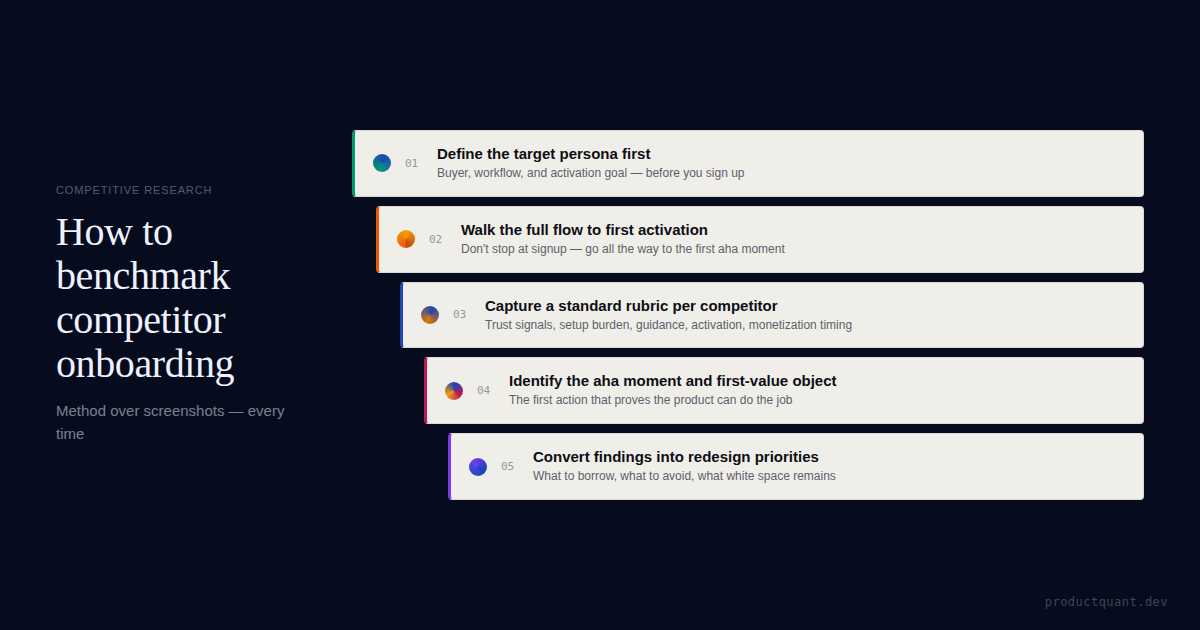
A practical method for competitive onboarding analysis in B2B SaaS: benchmark signup, trust signals, routing, setup burden, activation milestones, and...
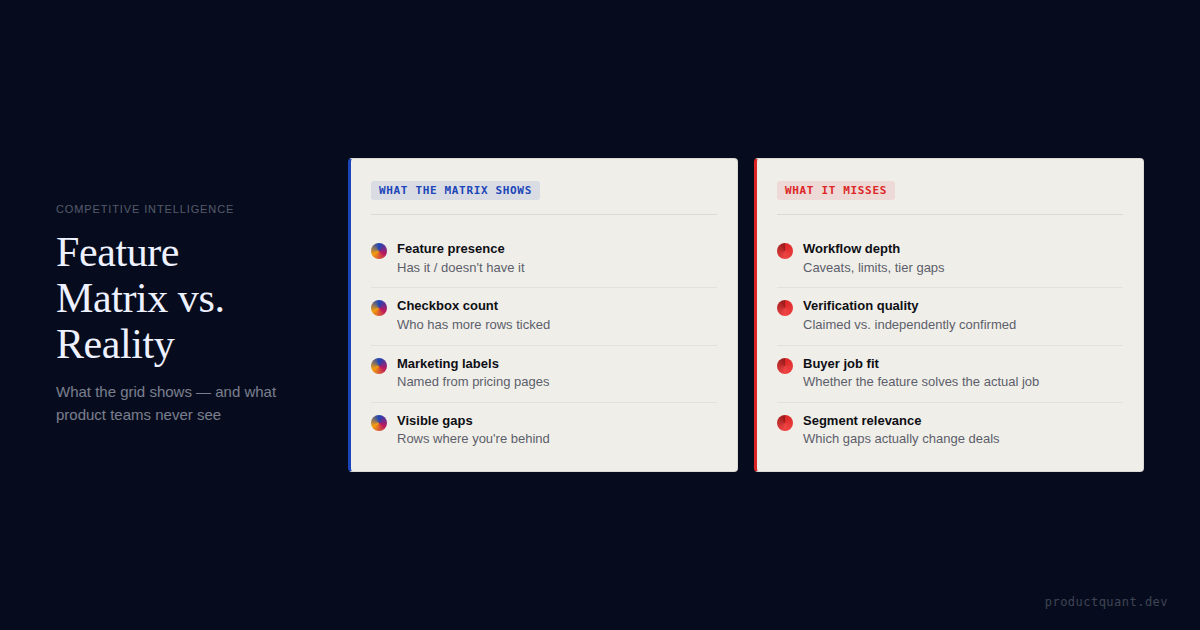
A practical guide to why competitor feature matrices mislead product teams and how to replace checkbox parity with depth, verification, and...
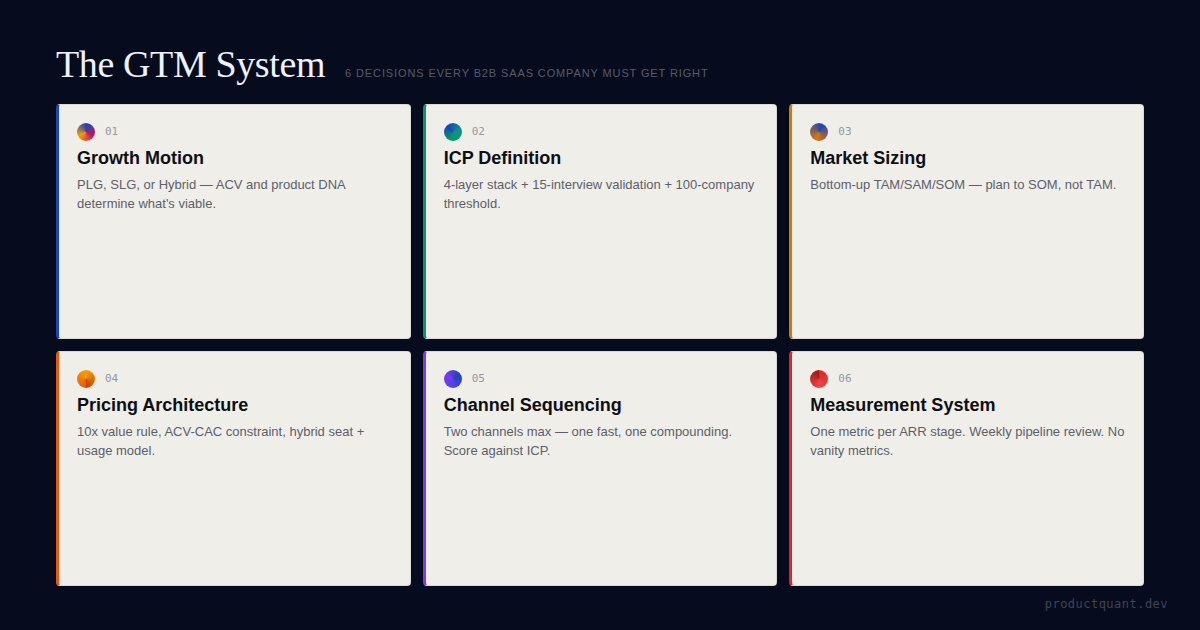
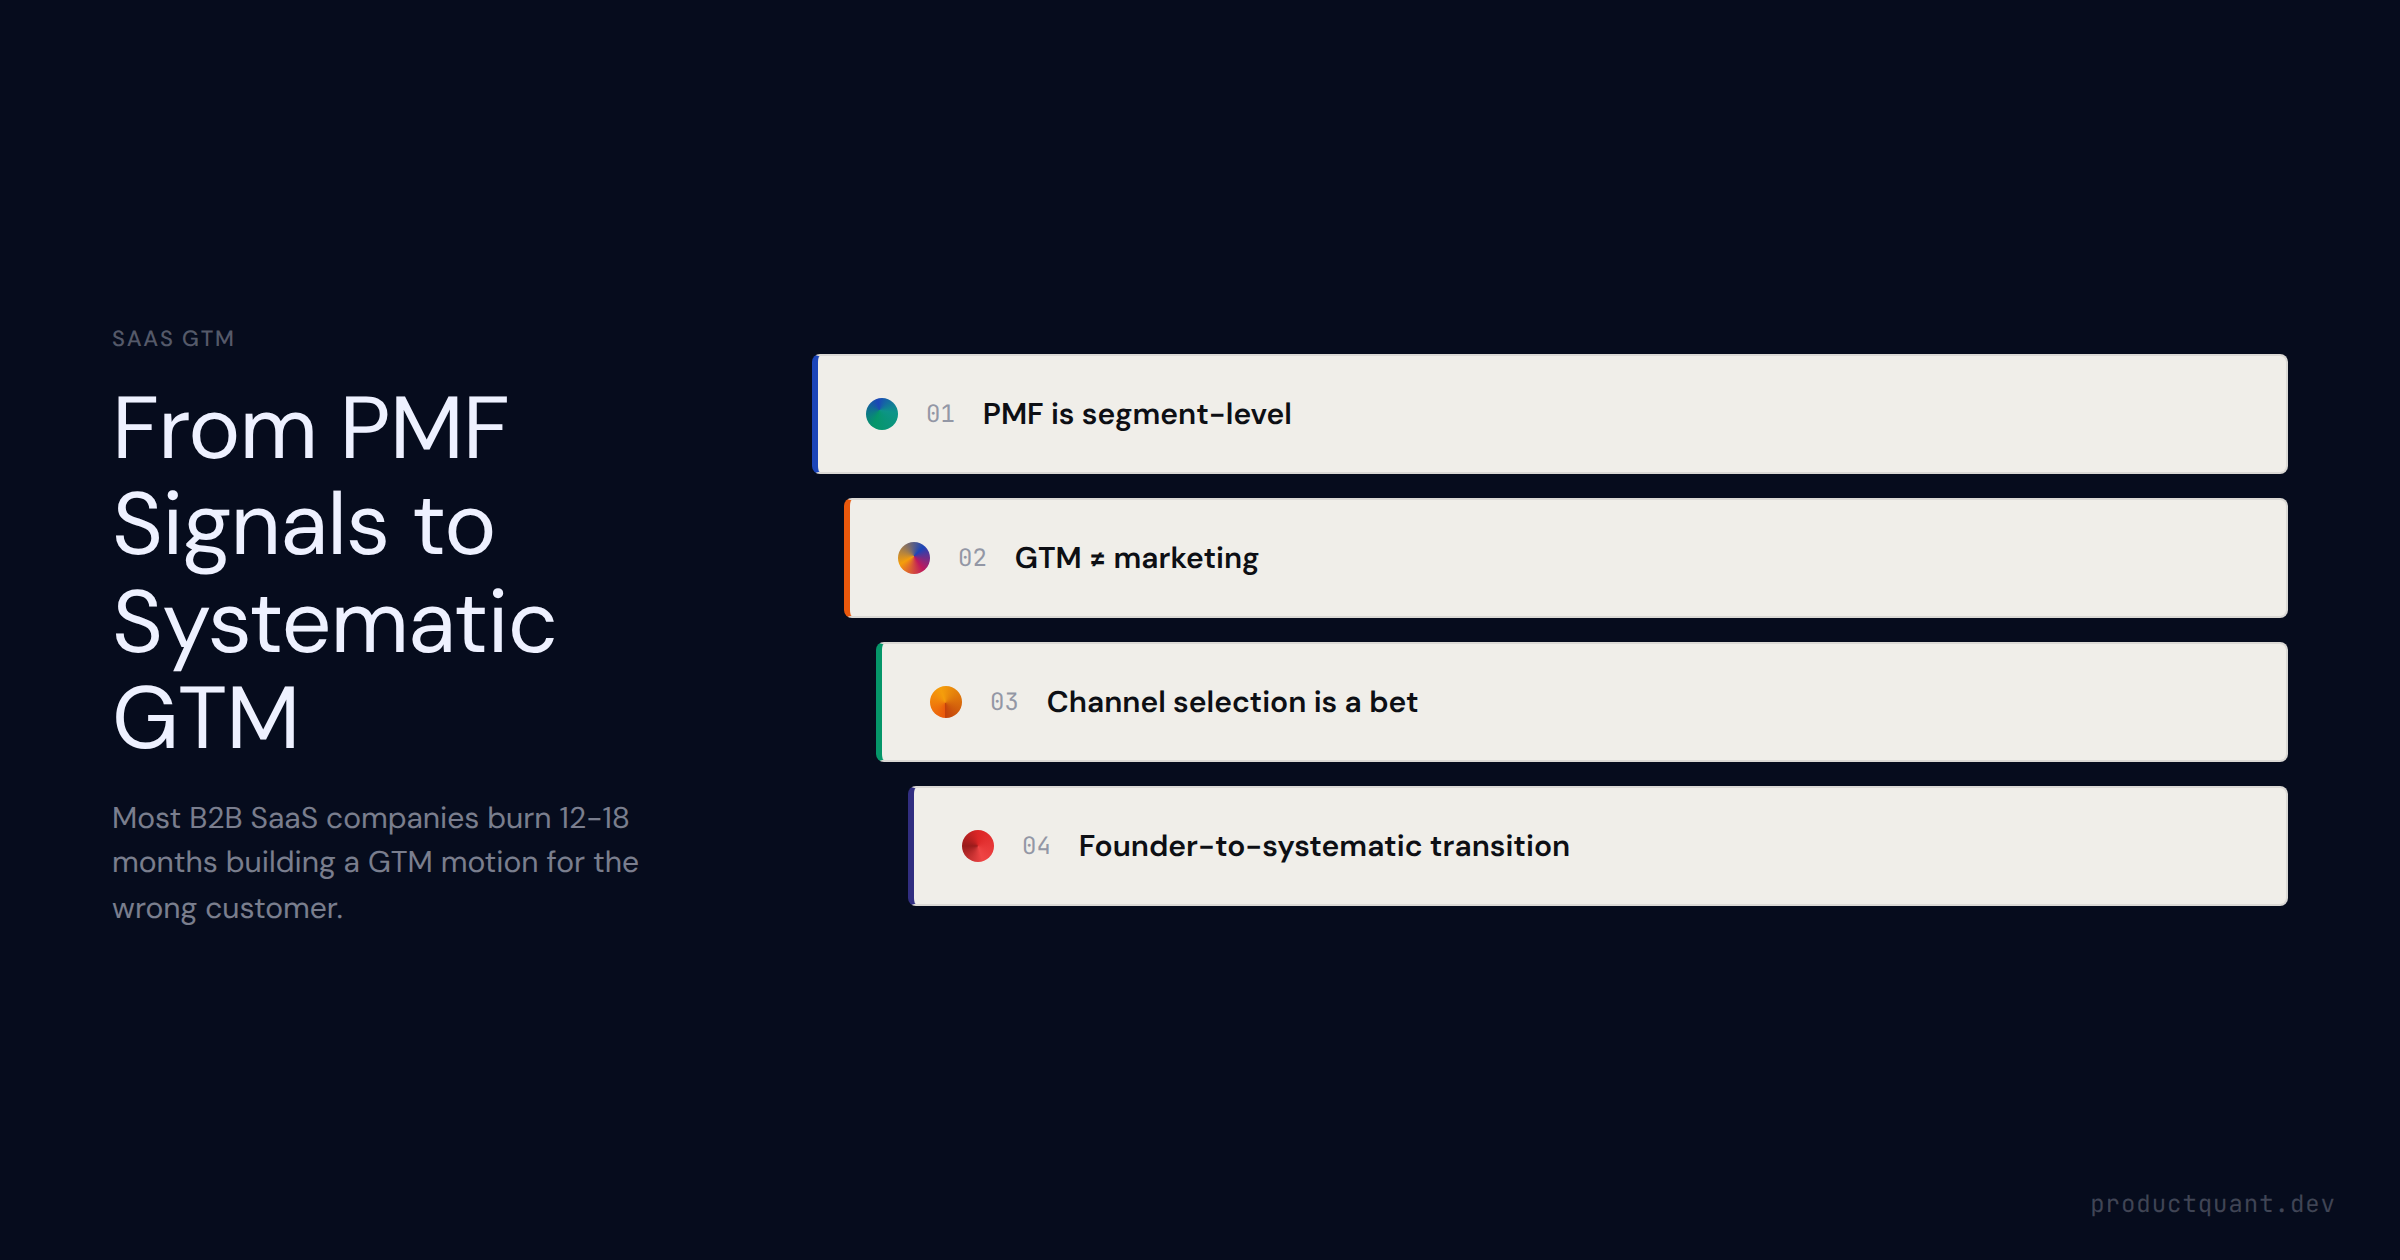
A 7-step GTM strategy framework for B2B SaaS: growth motion selection, ICP definition, market sizing, pricing architecture, channel sequencing, 90-day launch plan, and measurement system — with 2026 benchmarks by stage a

PLG is not a pricing feature. It is an architectural commitment. This guide covers the 8-pillar framework that diagnoses exactly where your product is losi
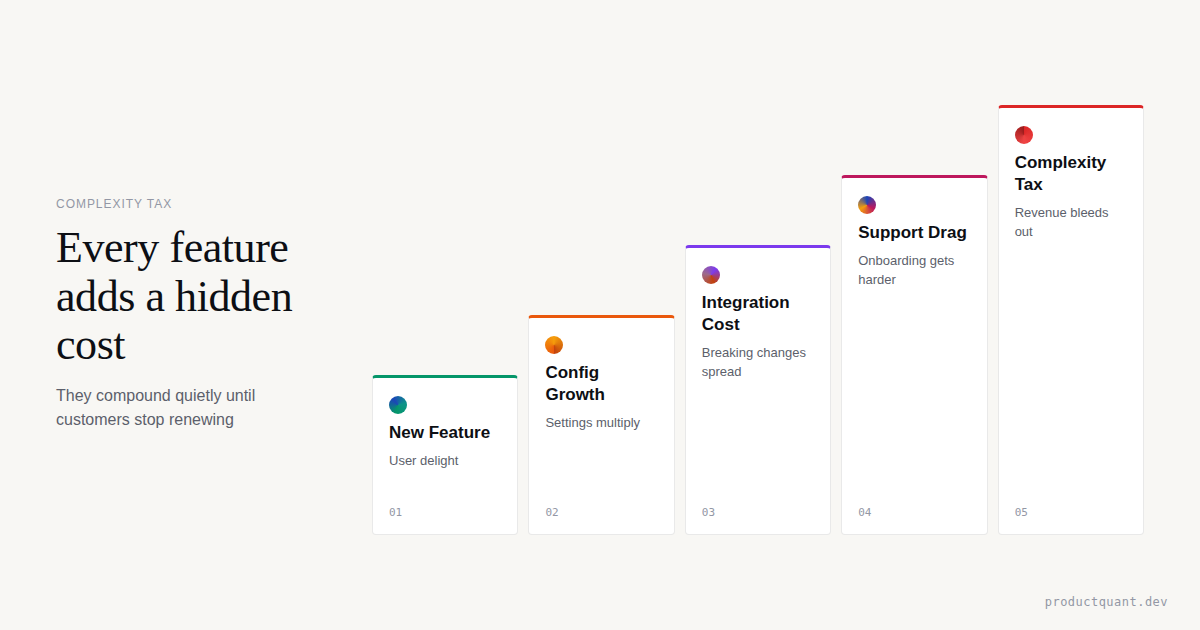
Complex, slow-to-value products pay a hidden tax on every growth initiative. Here is how complexity changes PLG, content, sales, and expansion math.
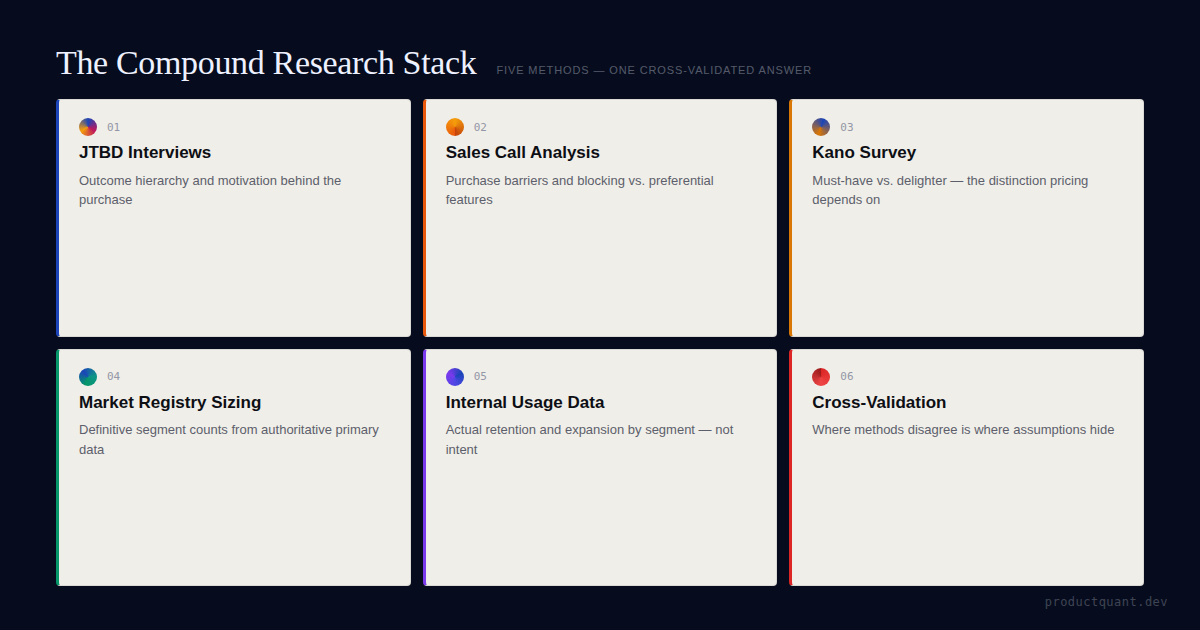
How to run JTBD interviews, Kano surveys, and market sizing simultaneously — and use the cross-validation to fix wrong assumptions before they reach your...
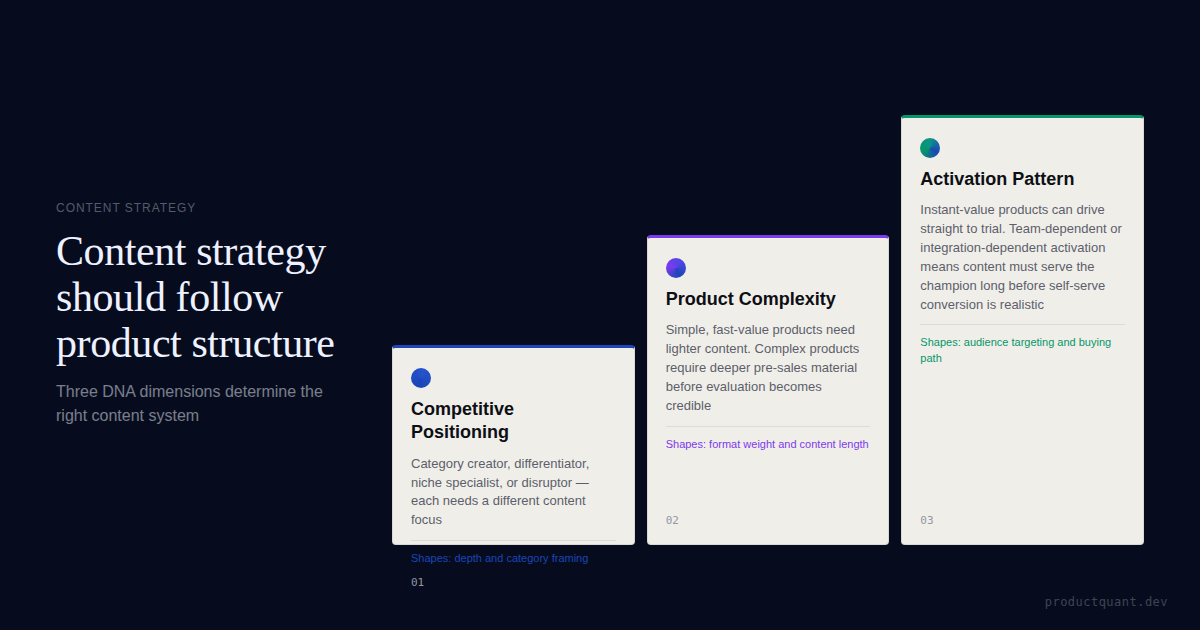
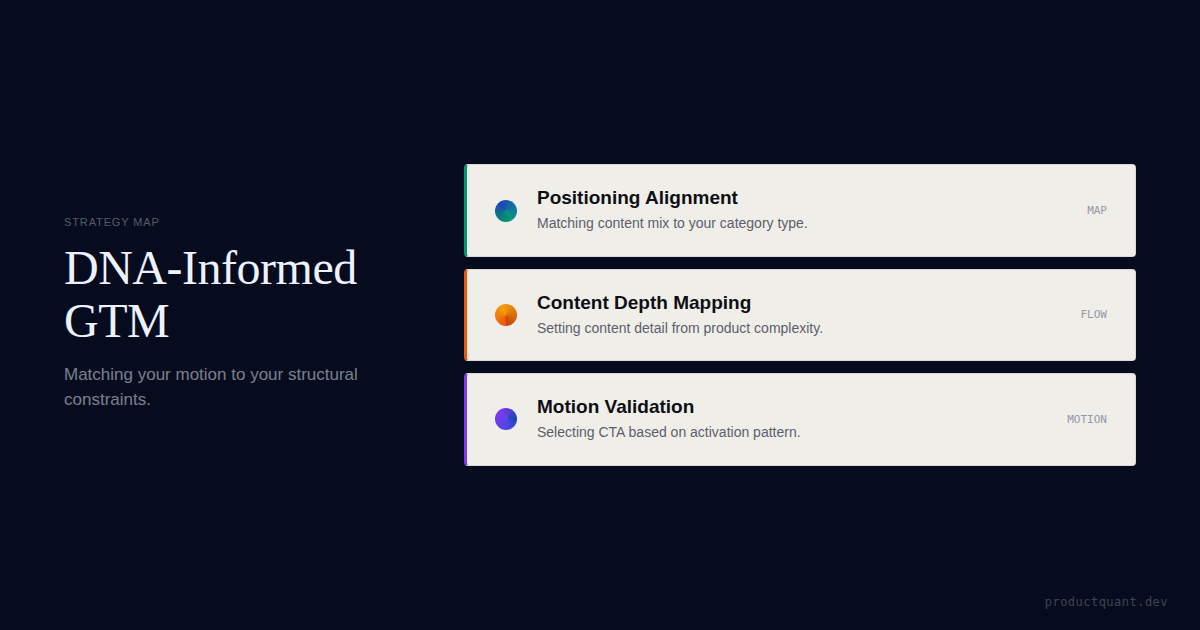
Content strategy should come from product structure, not generic marketing templates. Build a strategy based on your B2B SaaS product DNA that drives qualified leads, not vanity traffic.
Figma
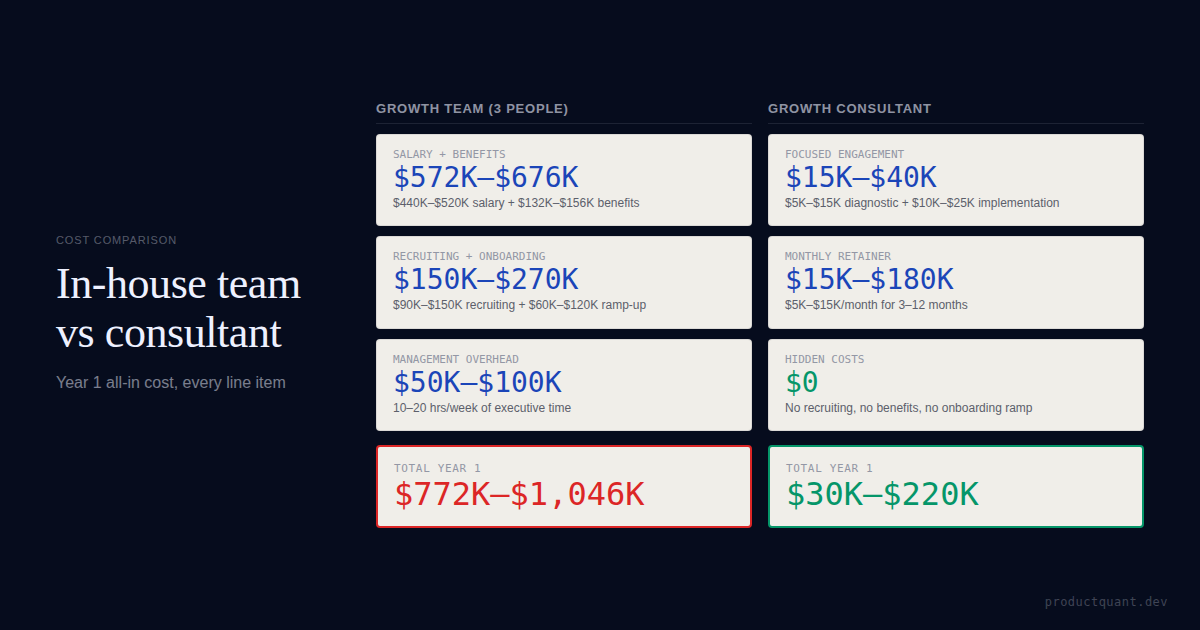
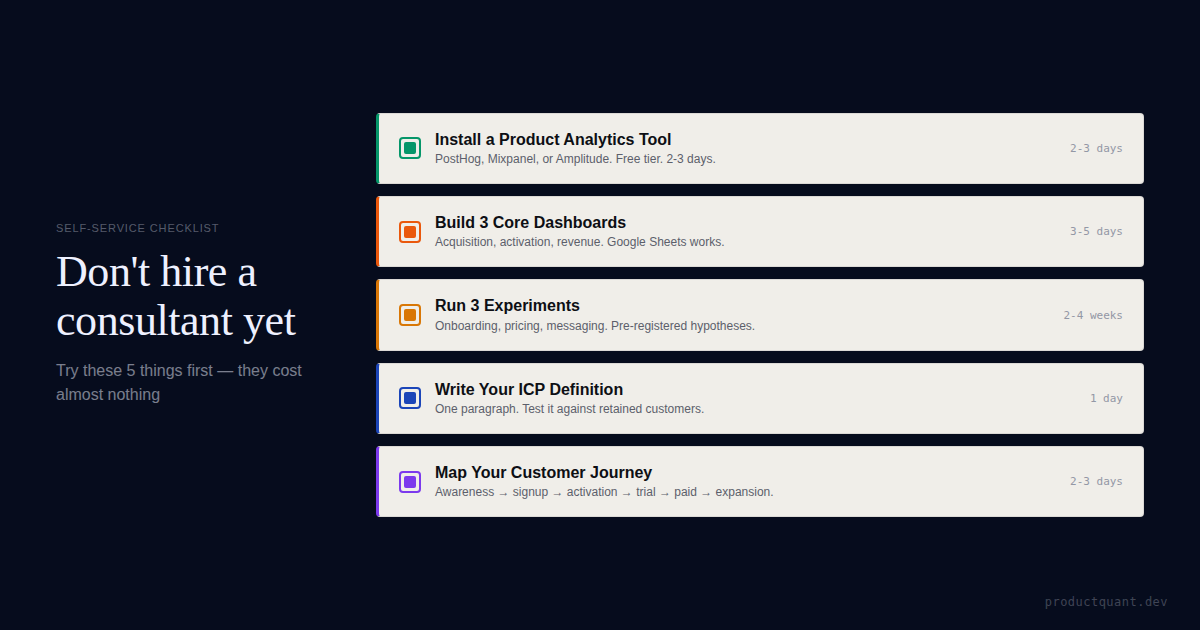
The cheapest growth team member costs $180K/year. The most expensive consultant costs $180K/year. The difference is what you get for the money.
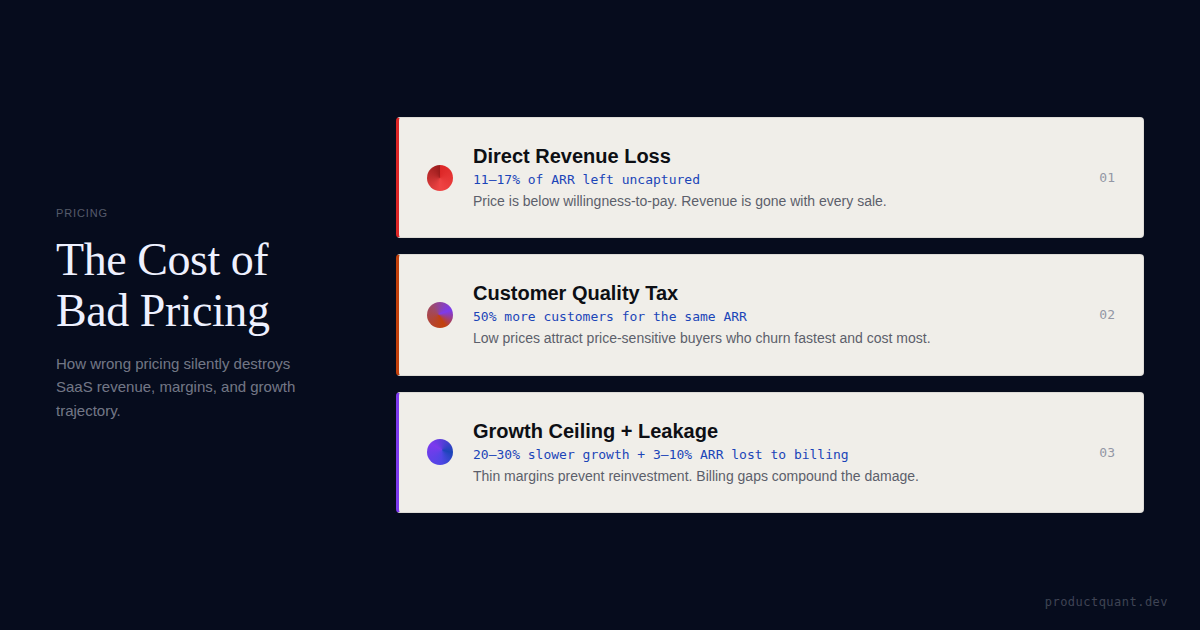
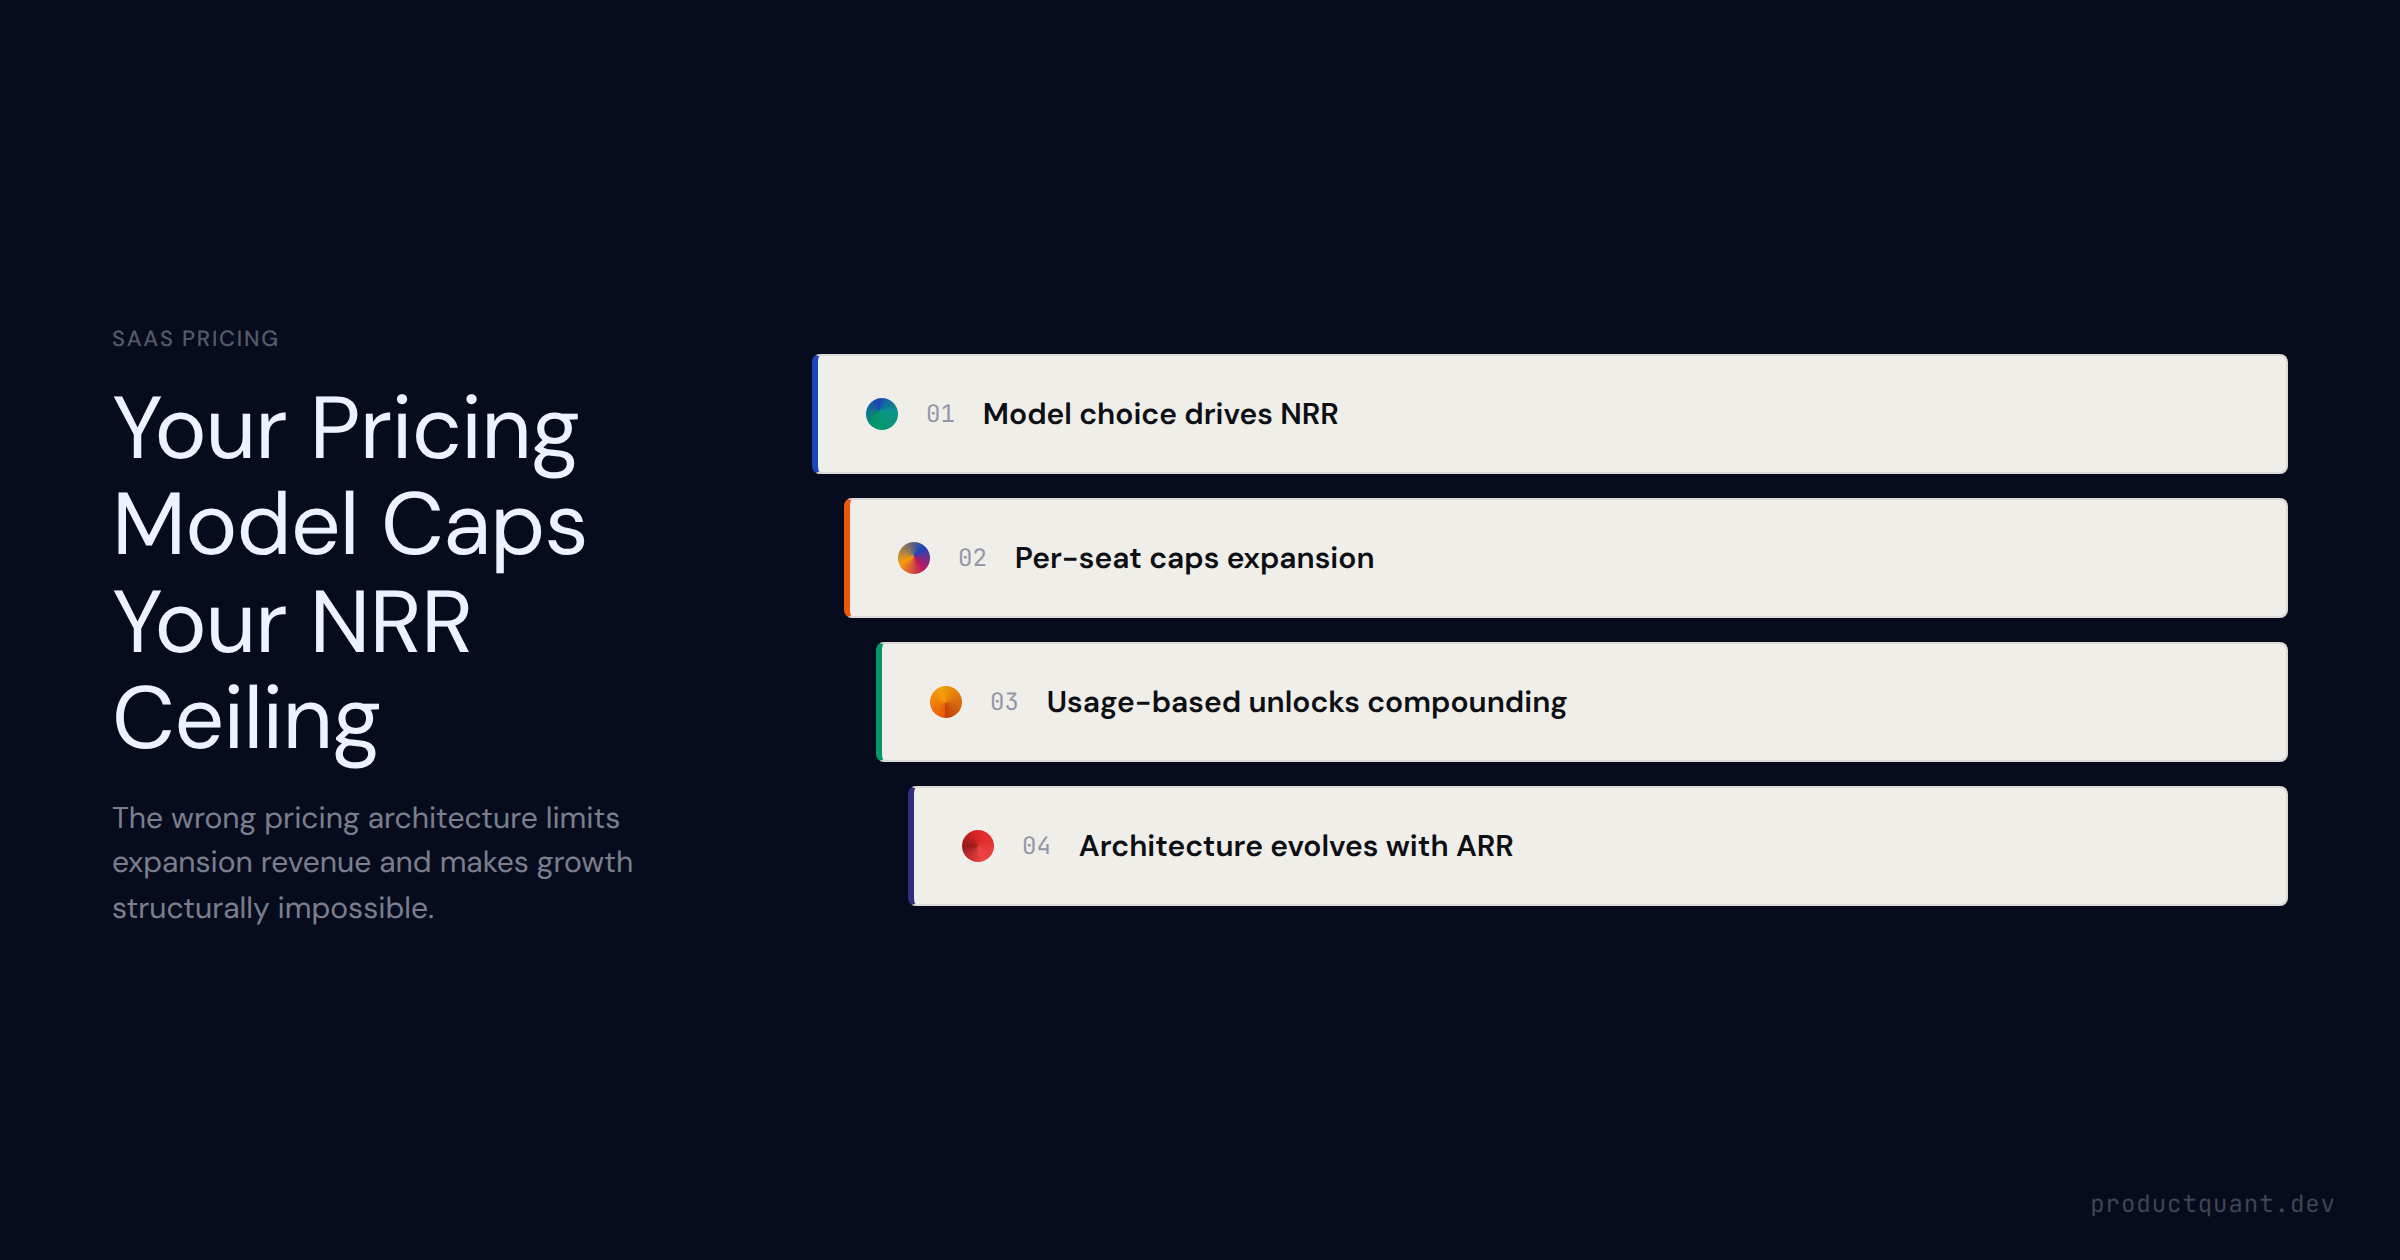
Bad pricing costs SaaS companies 11-17% of revenue — plus attracts the wrong customers and caps growth. Here
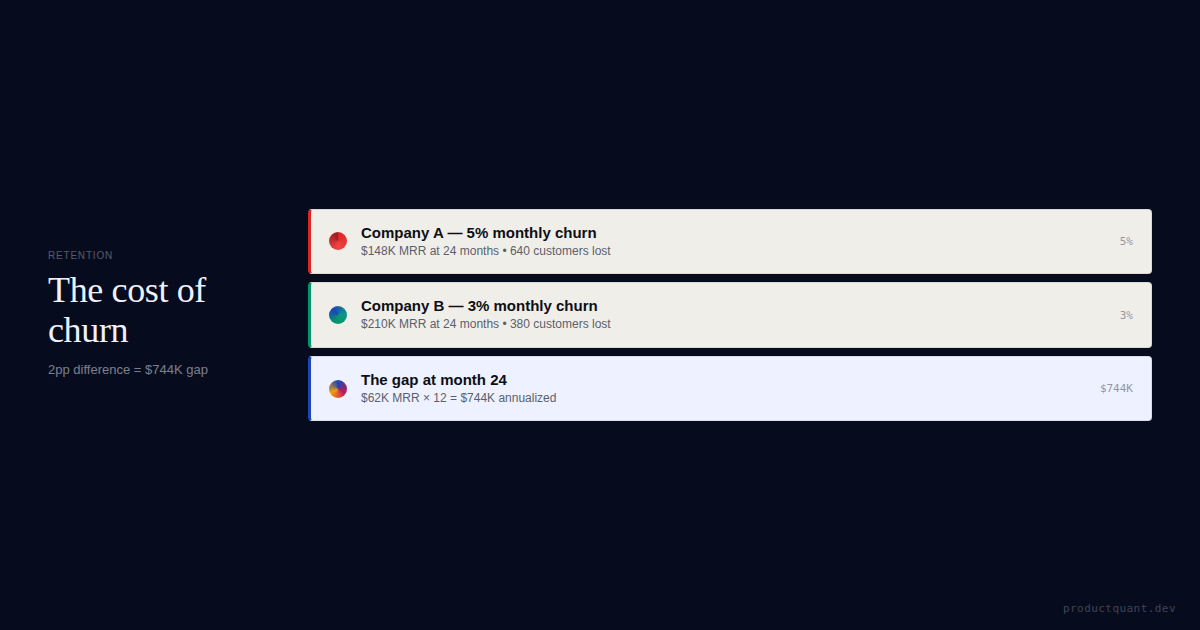
Two companies. Same acquisition engine. Same starting MRR. A 2pp monthly churn difference = $744,000 annualized gap after 24 months. Here is the full cost-of-churn math.
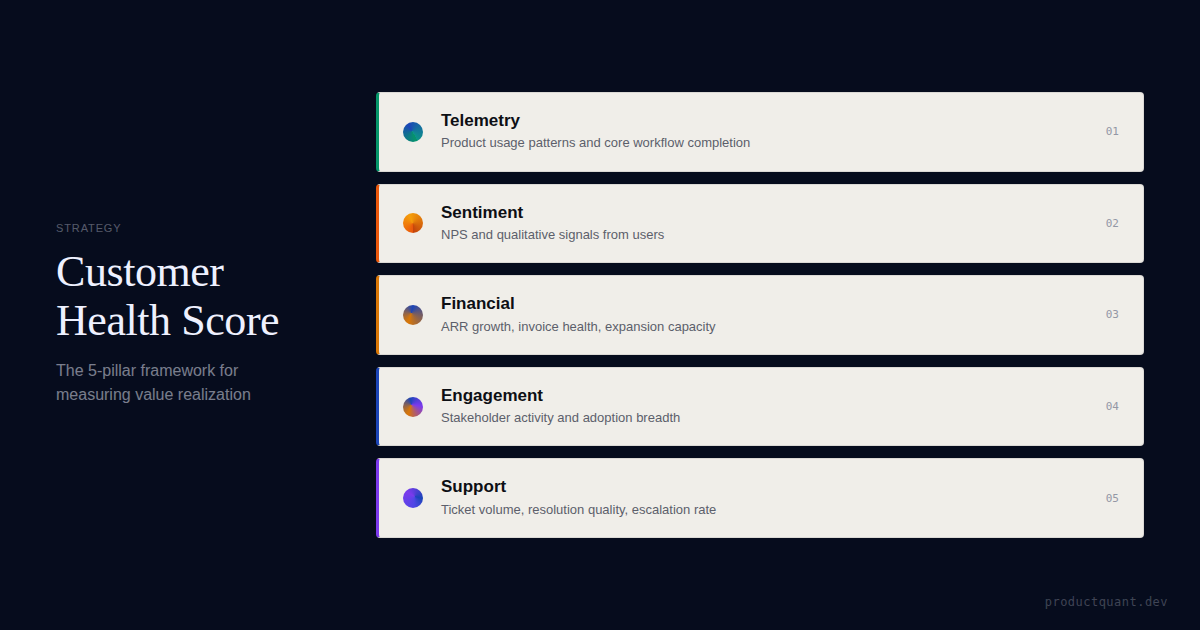
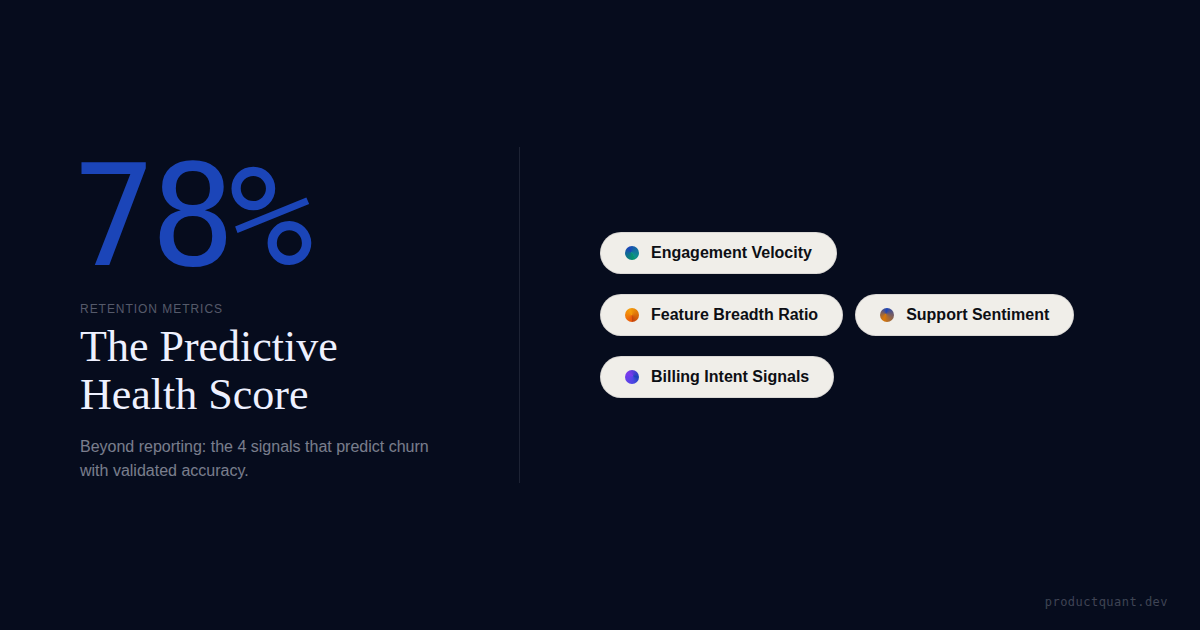
The 4-signal health score with validated accuracy benchmarks (78% from engagement velocity), recovery rate metric, and segment-specific thresholds.
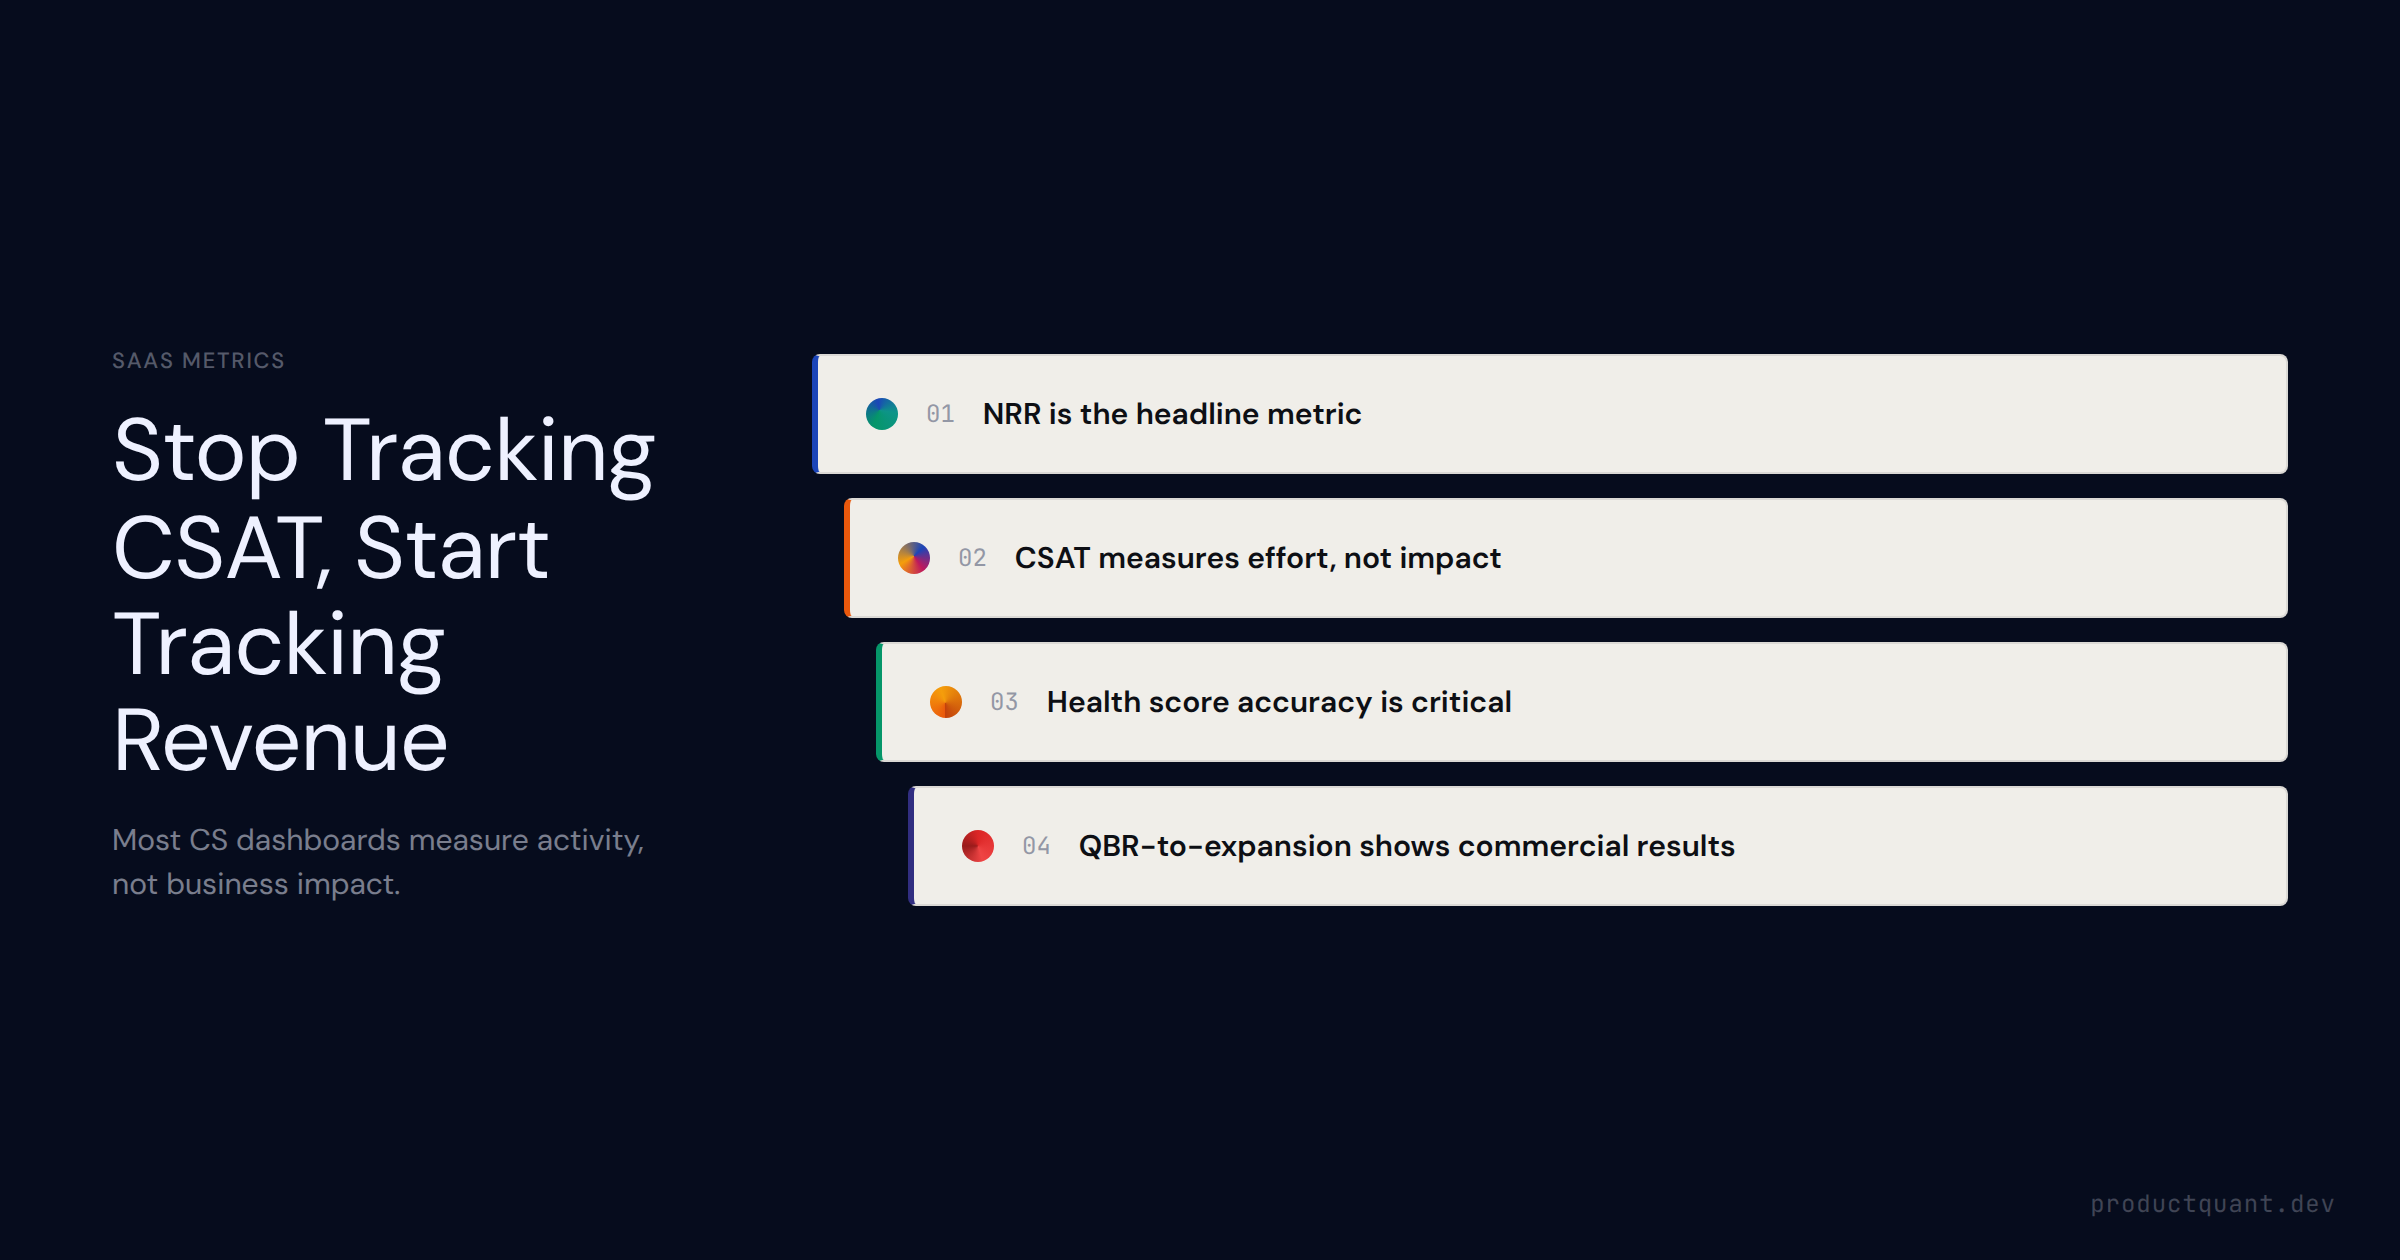
Most CS dashboards track the wrong things. This guide separates vanity metrics (CSAT, ticket count) from revenue-signal metrics (NRR, expansion rate, health score accuracy, QBR-to-expansion conversion) that predict CS te
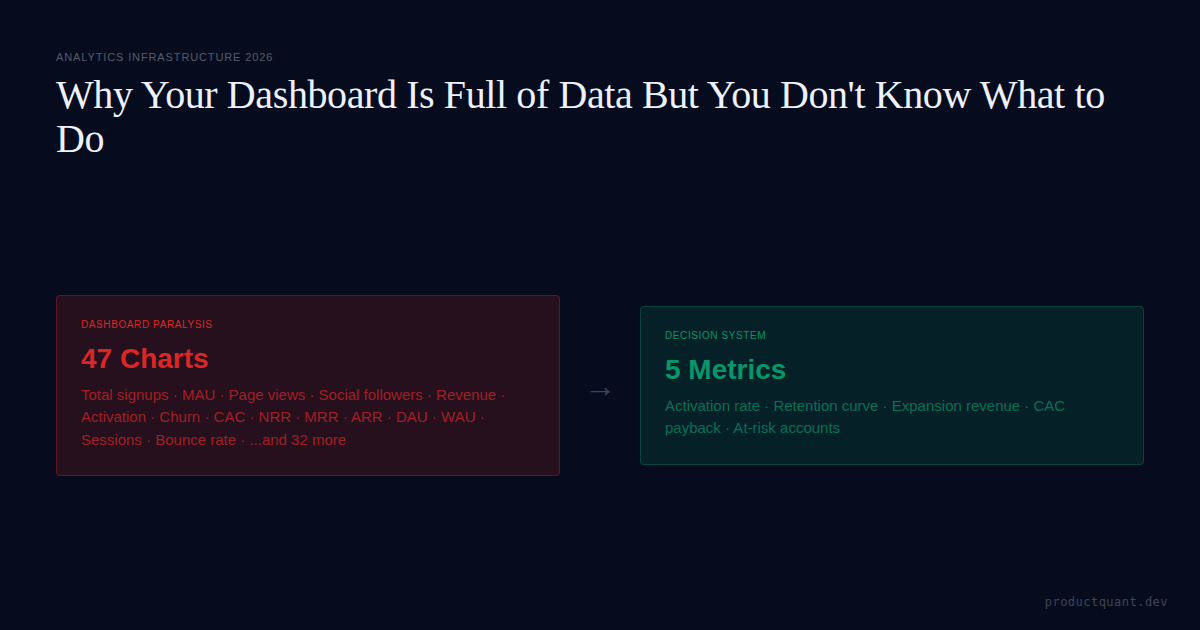
Your dashboard has 47 charts but your team uses 3. Here
Most product teams install analytics and still make decisions based on opinion. The gap is not data — it is a decision framework. Here is the 5-step system that closes it.
Seed-stage B2B SaaS teams burn thousands on enrichment credits that return empty or low-value records. Here is how to build a structured enrichment pipeline that delivers 3-5x better reachable contact rates without the w

Before dashboards, ML, or AI — fix the ownership vacuum. 51% of data teams cite lack of ownership as their top pain point. Start with governance.

Most activation problems are misdiagnosed. Teams optimize for onboarding completion when they should be asking why users stop finding value. This diagnosti
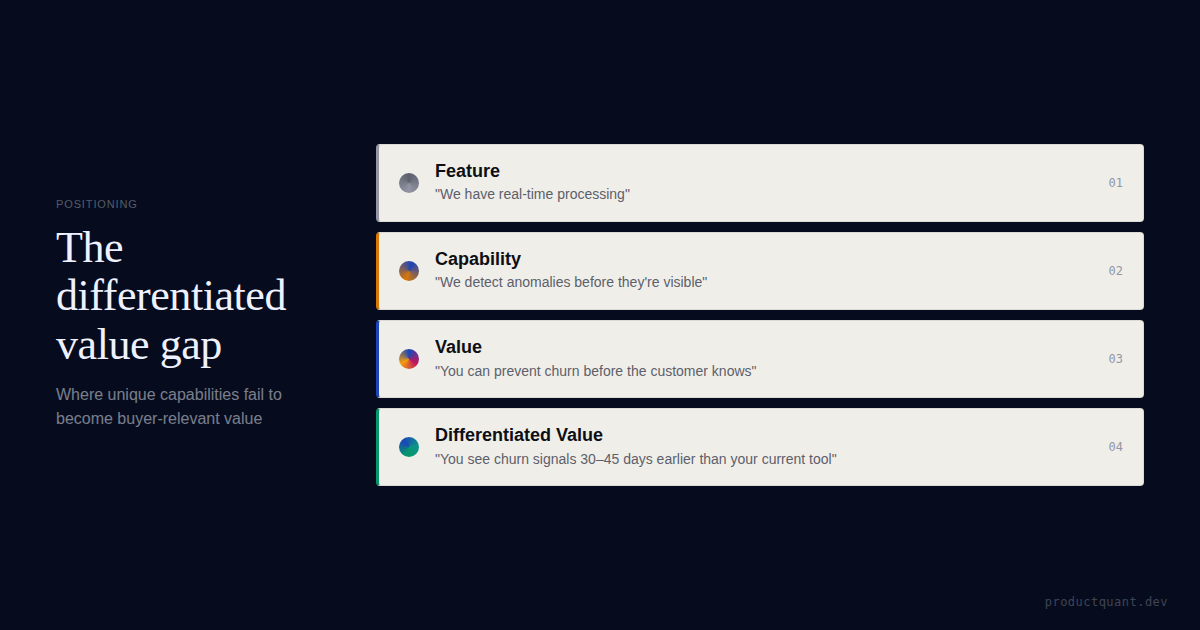
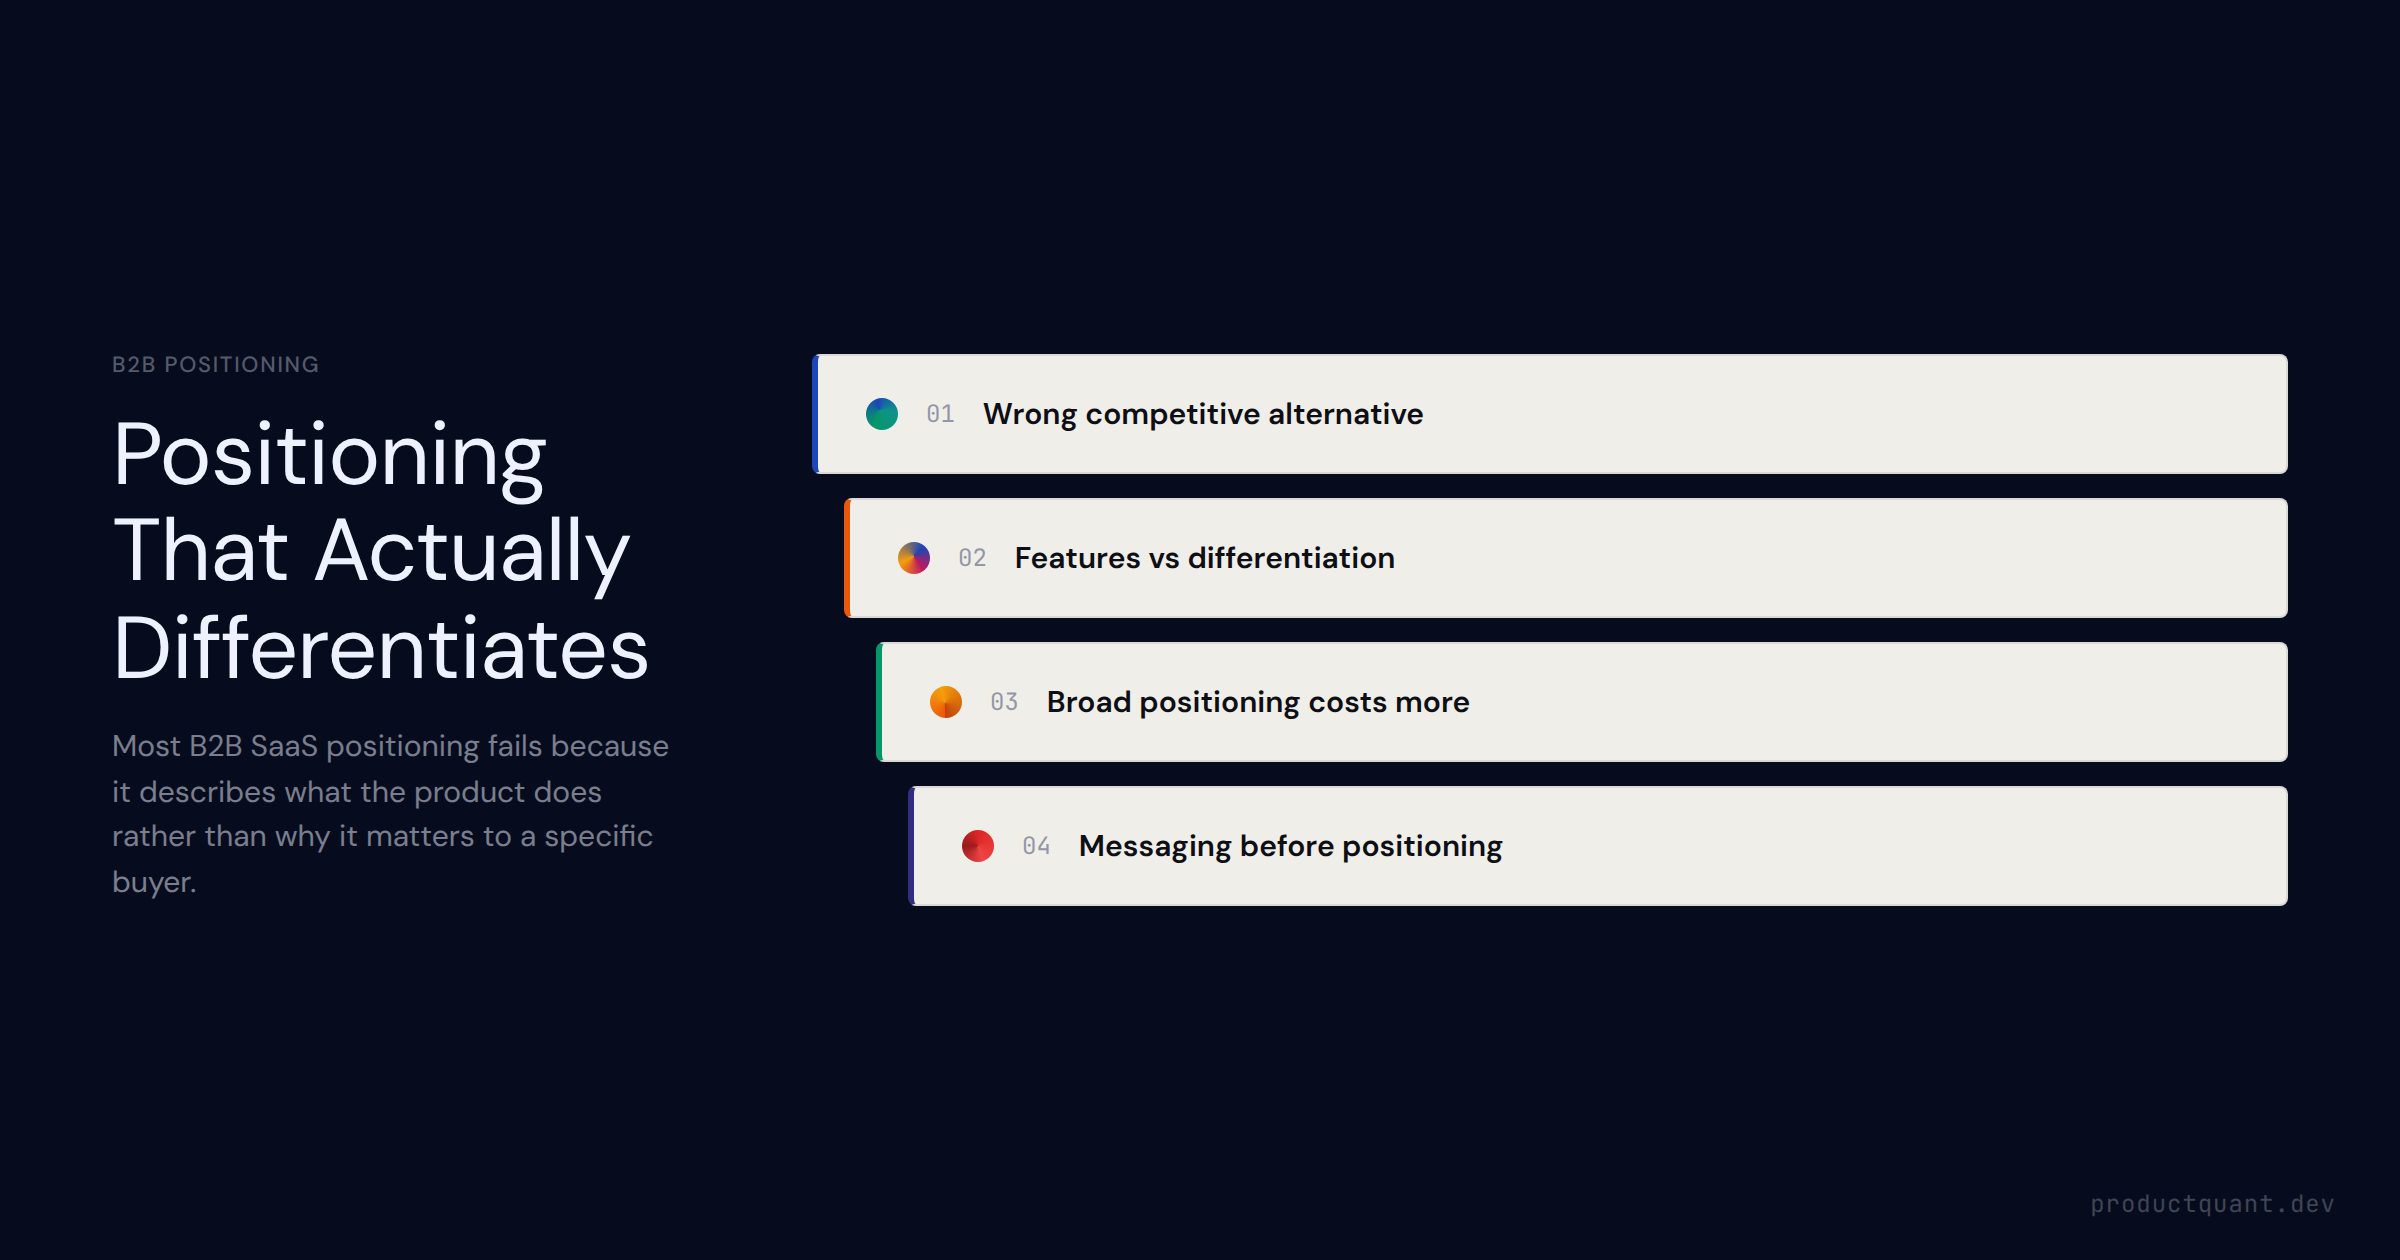
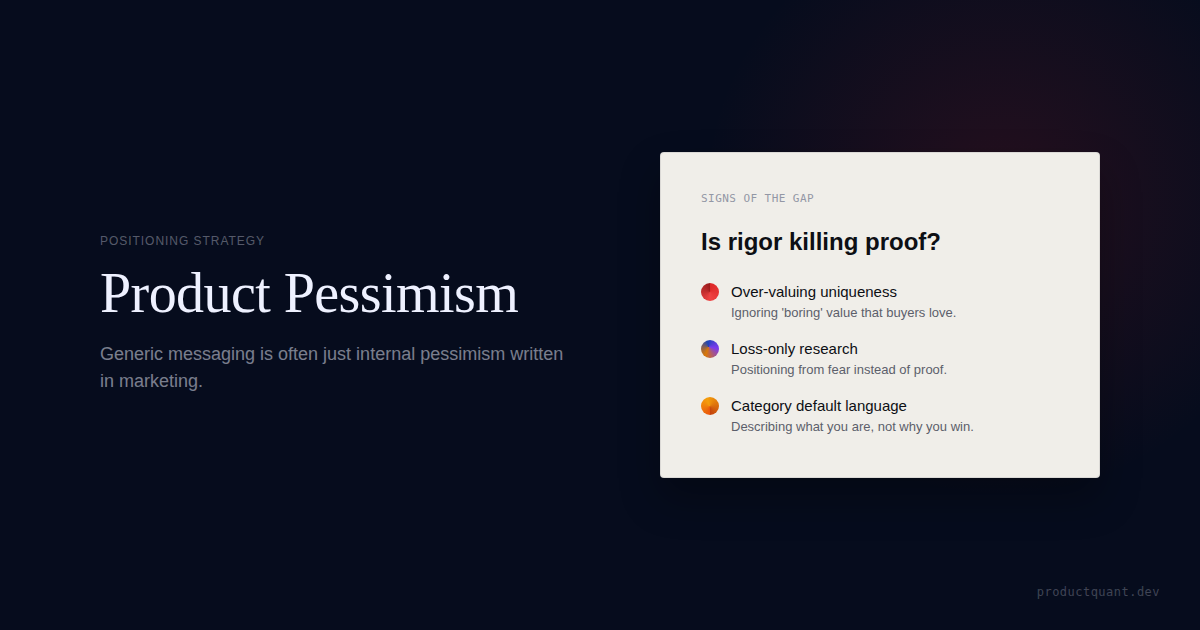
Teams build genuinely differentiated products and describe them in ways that are completely interchangeable from competitors. The problem is not the featur
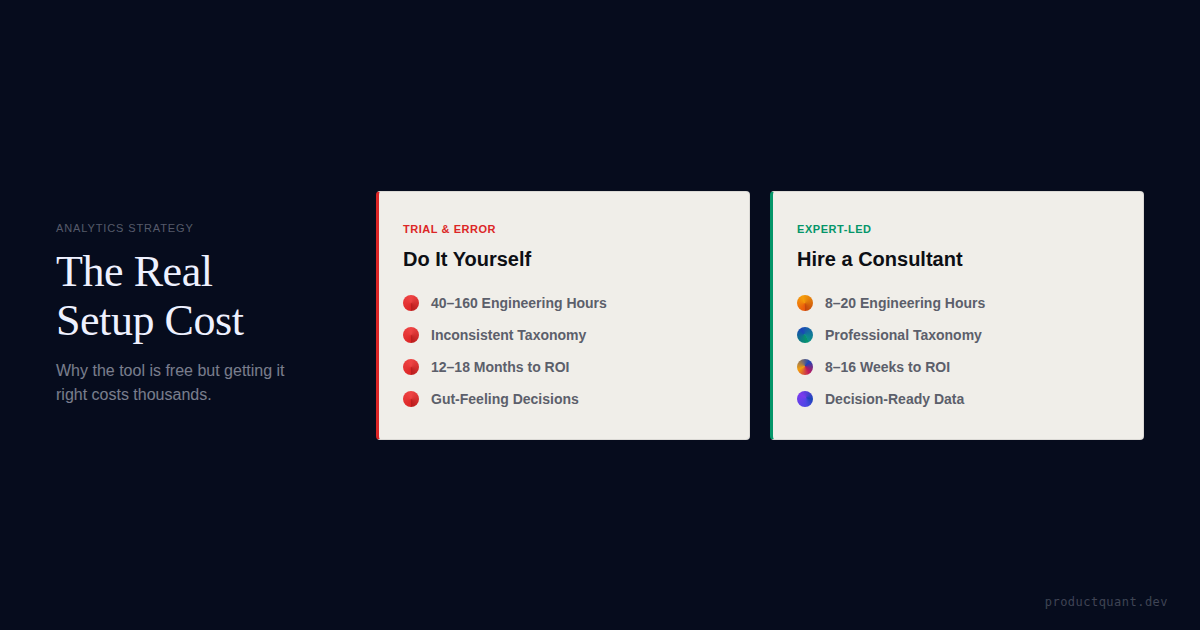
The tool costs $0-400/month. The real cost is what it takes to set it up right. The honest comparison between DIY analytics and hiring help.
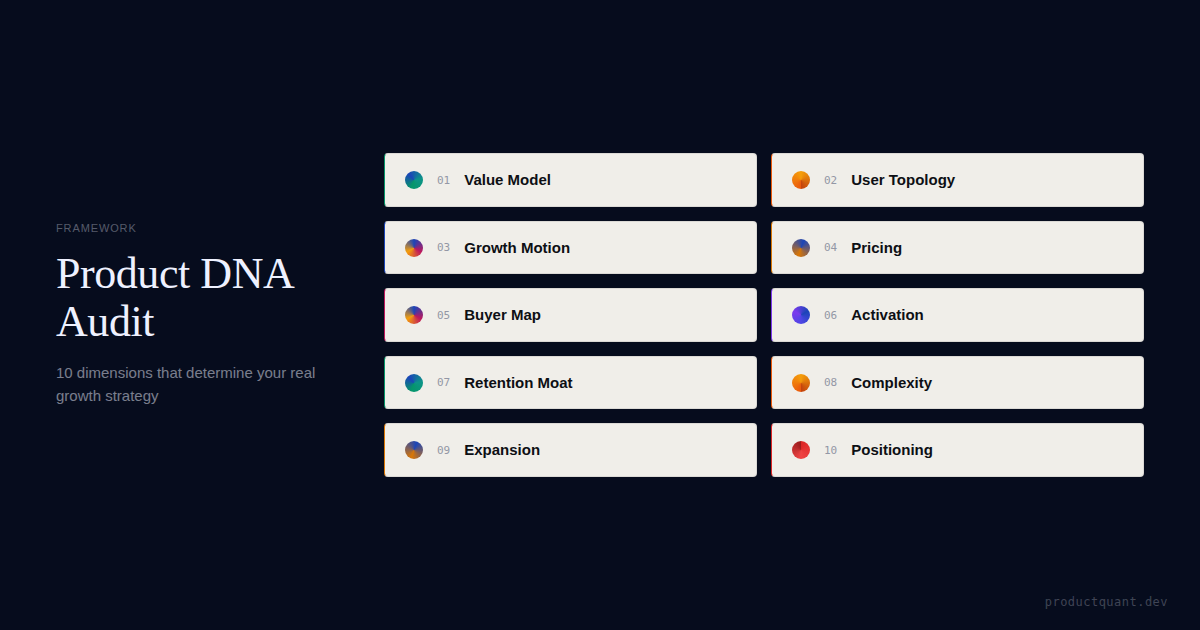
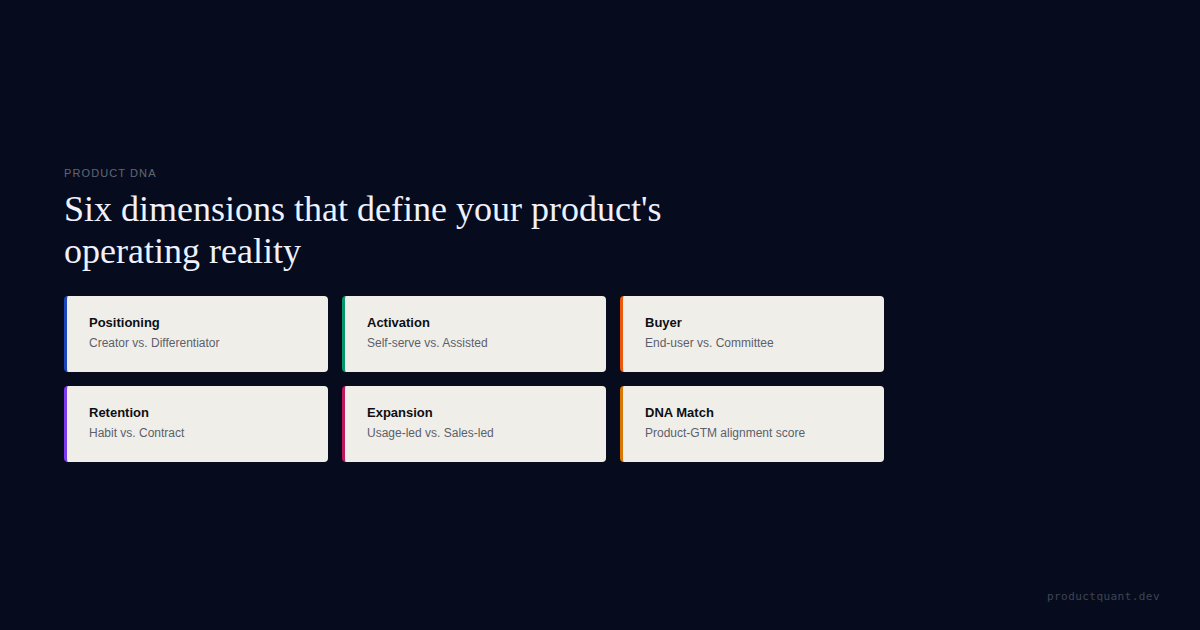
A fast Product DNA self-audit for value model, topology, pricing, activation, moat, complexity, expansion, and positioning.
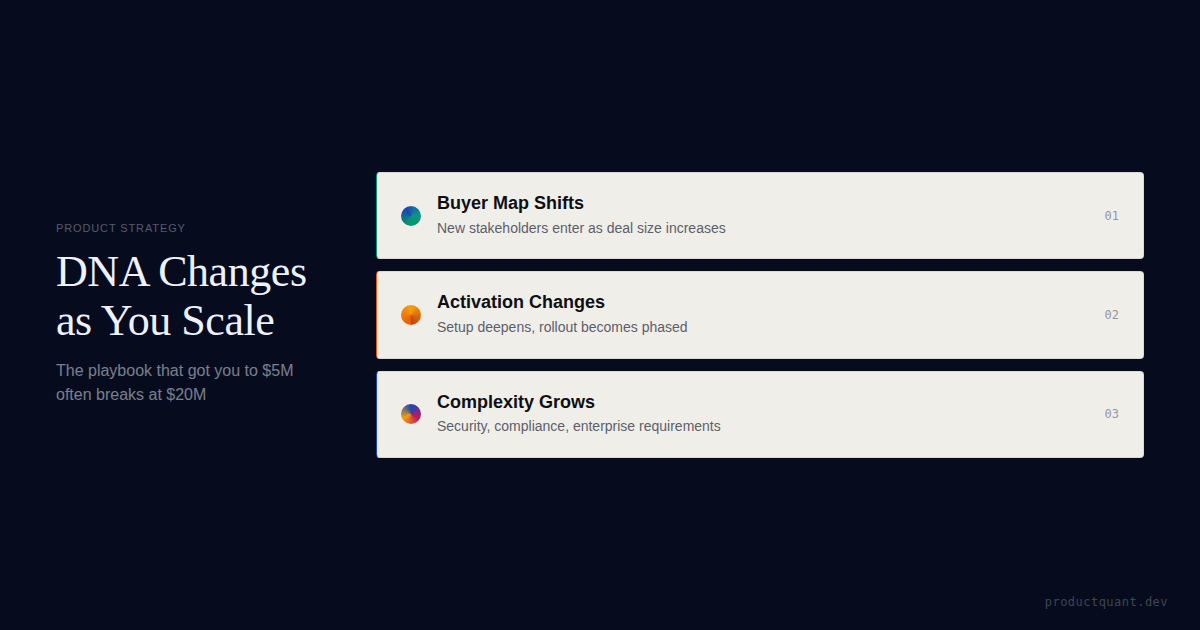
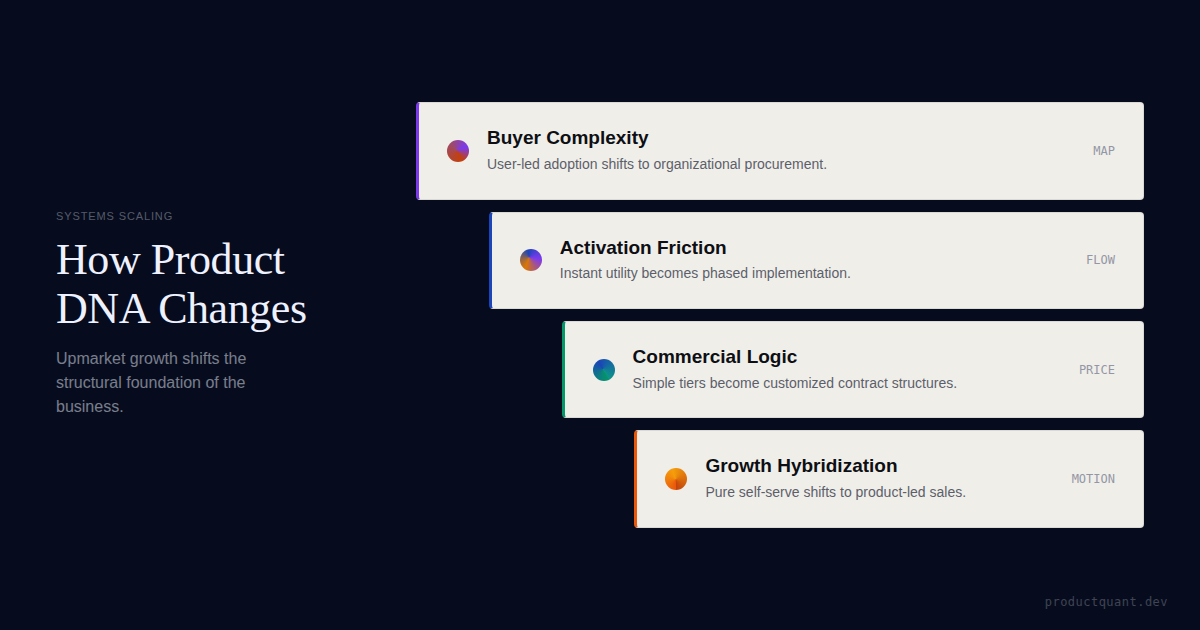
The playbook that got a SaaS company to $5M often breaks at $20M. Product DNA shifts as buyer complexity, activation, and enterprise requirements change.
The playbook that got you to $5M ARR breaks at $20M. Buyer maps, activation, and growth motion shift upmarket. Here
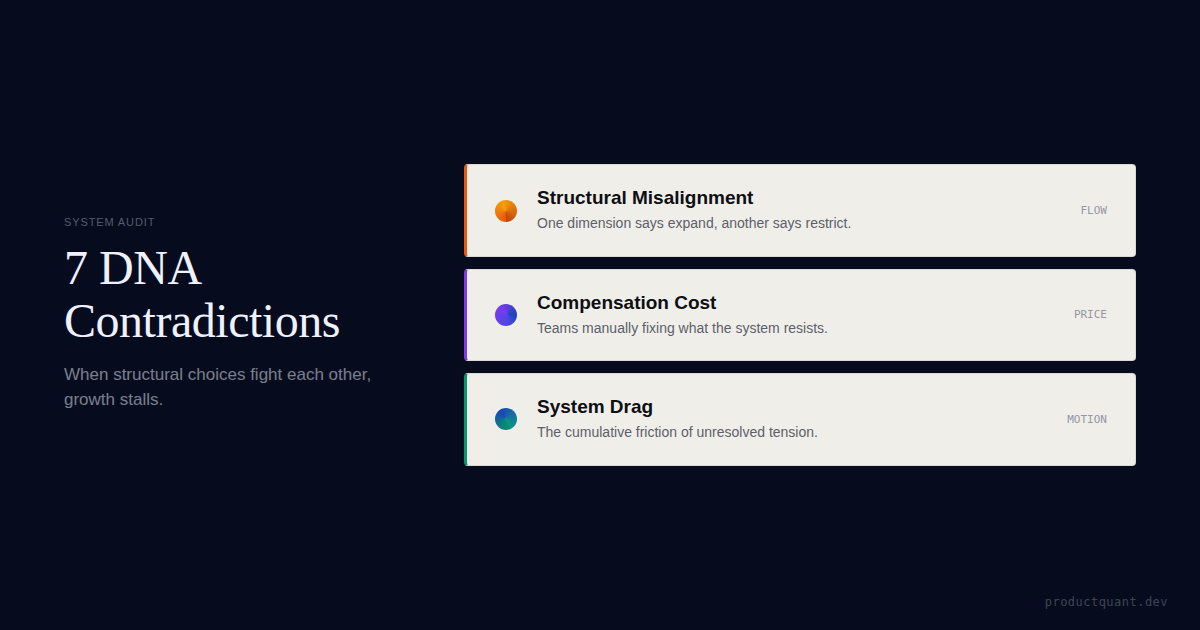
Most SaaS products have 2 or more structural contradictions in Product DNA. They look like execution problems, but they are really misaligned systems.

When a customer downgrades, they are handing you a precise diagnosis of where your product failed to deliver value at their current price point. Most teams

Involuntary churn from payment failures is the silent revenue leak in every SaaS business. Most operators ignore it until they see the gap between MRR and

Exit surveys capture what customers say after they have already decided to leave. The decision to churn forms 30-60 days before the cancellation event — th
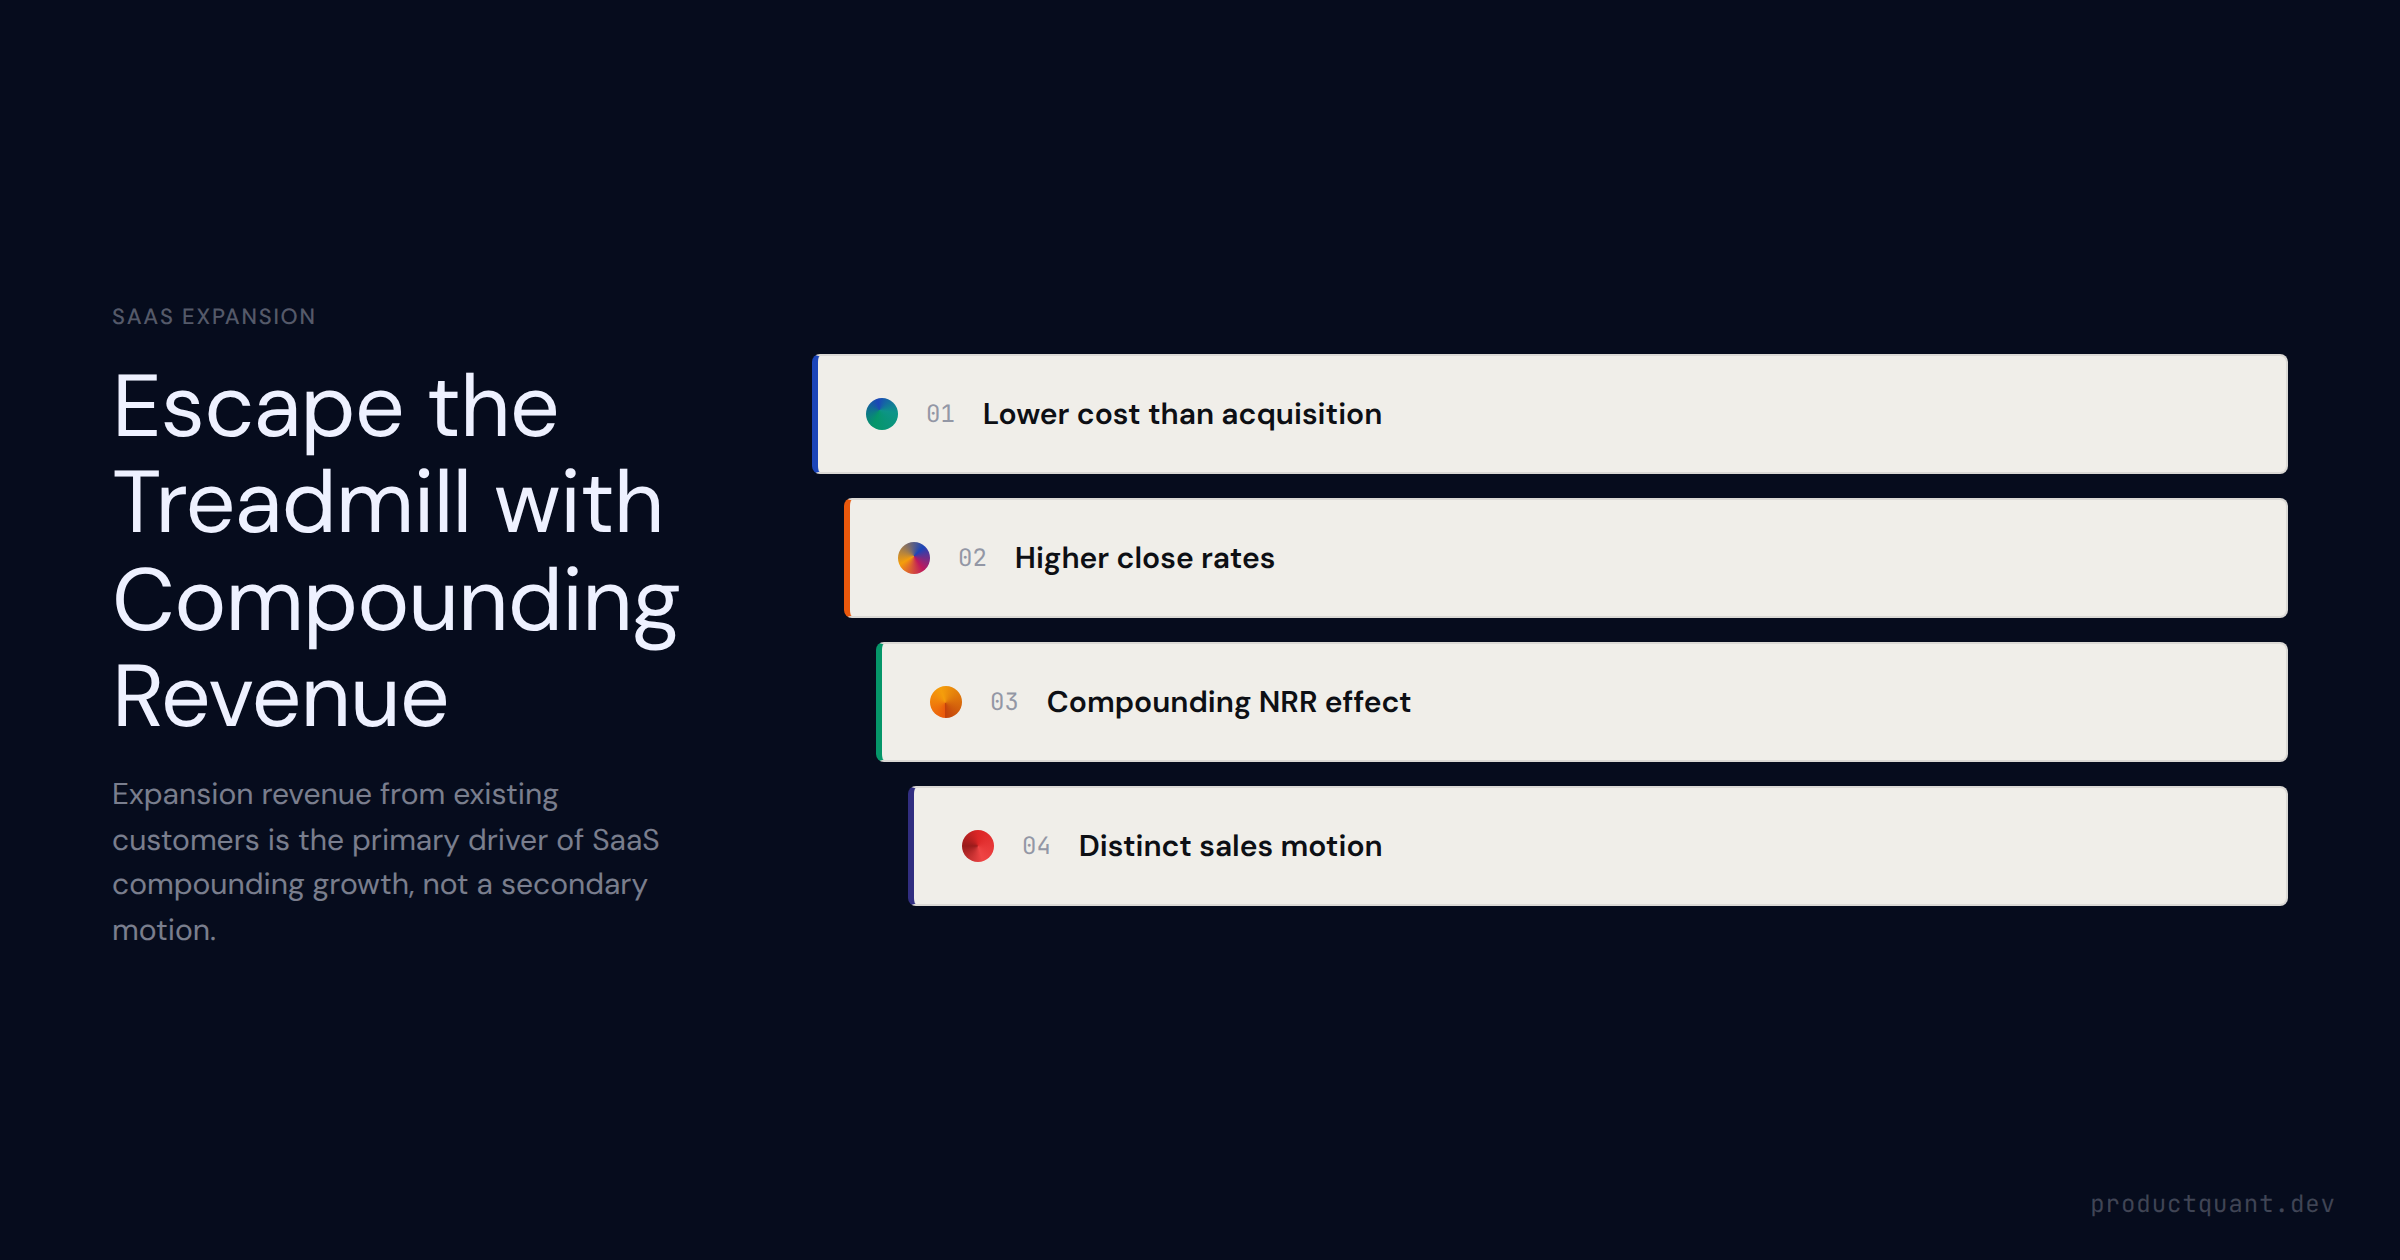
Expansion revenue is 5-7x cheaper than new acquisition. Here
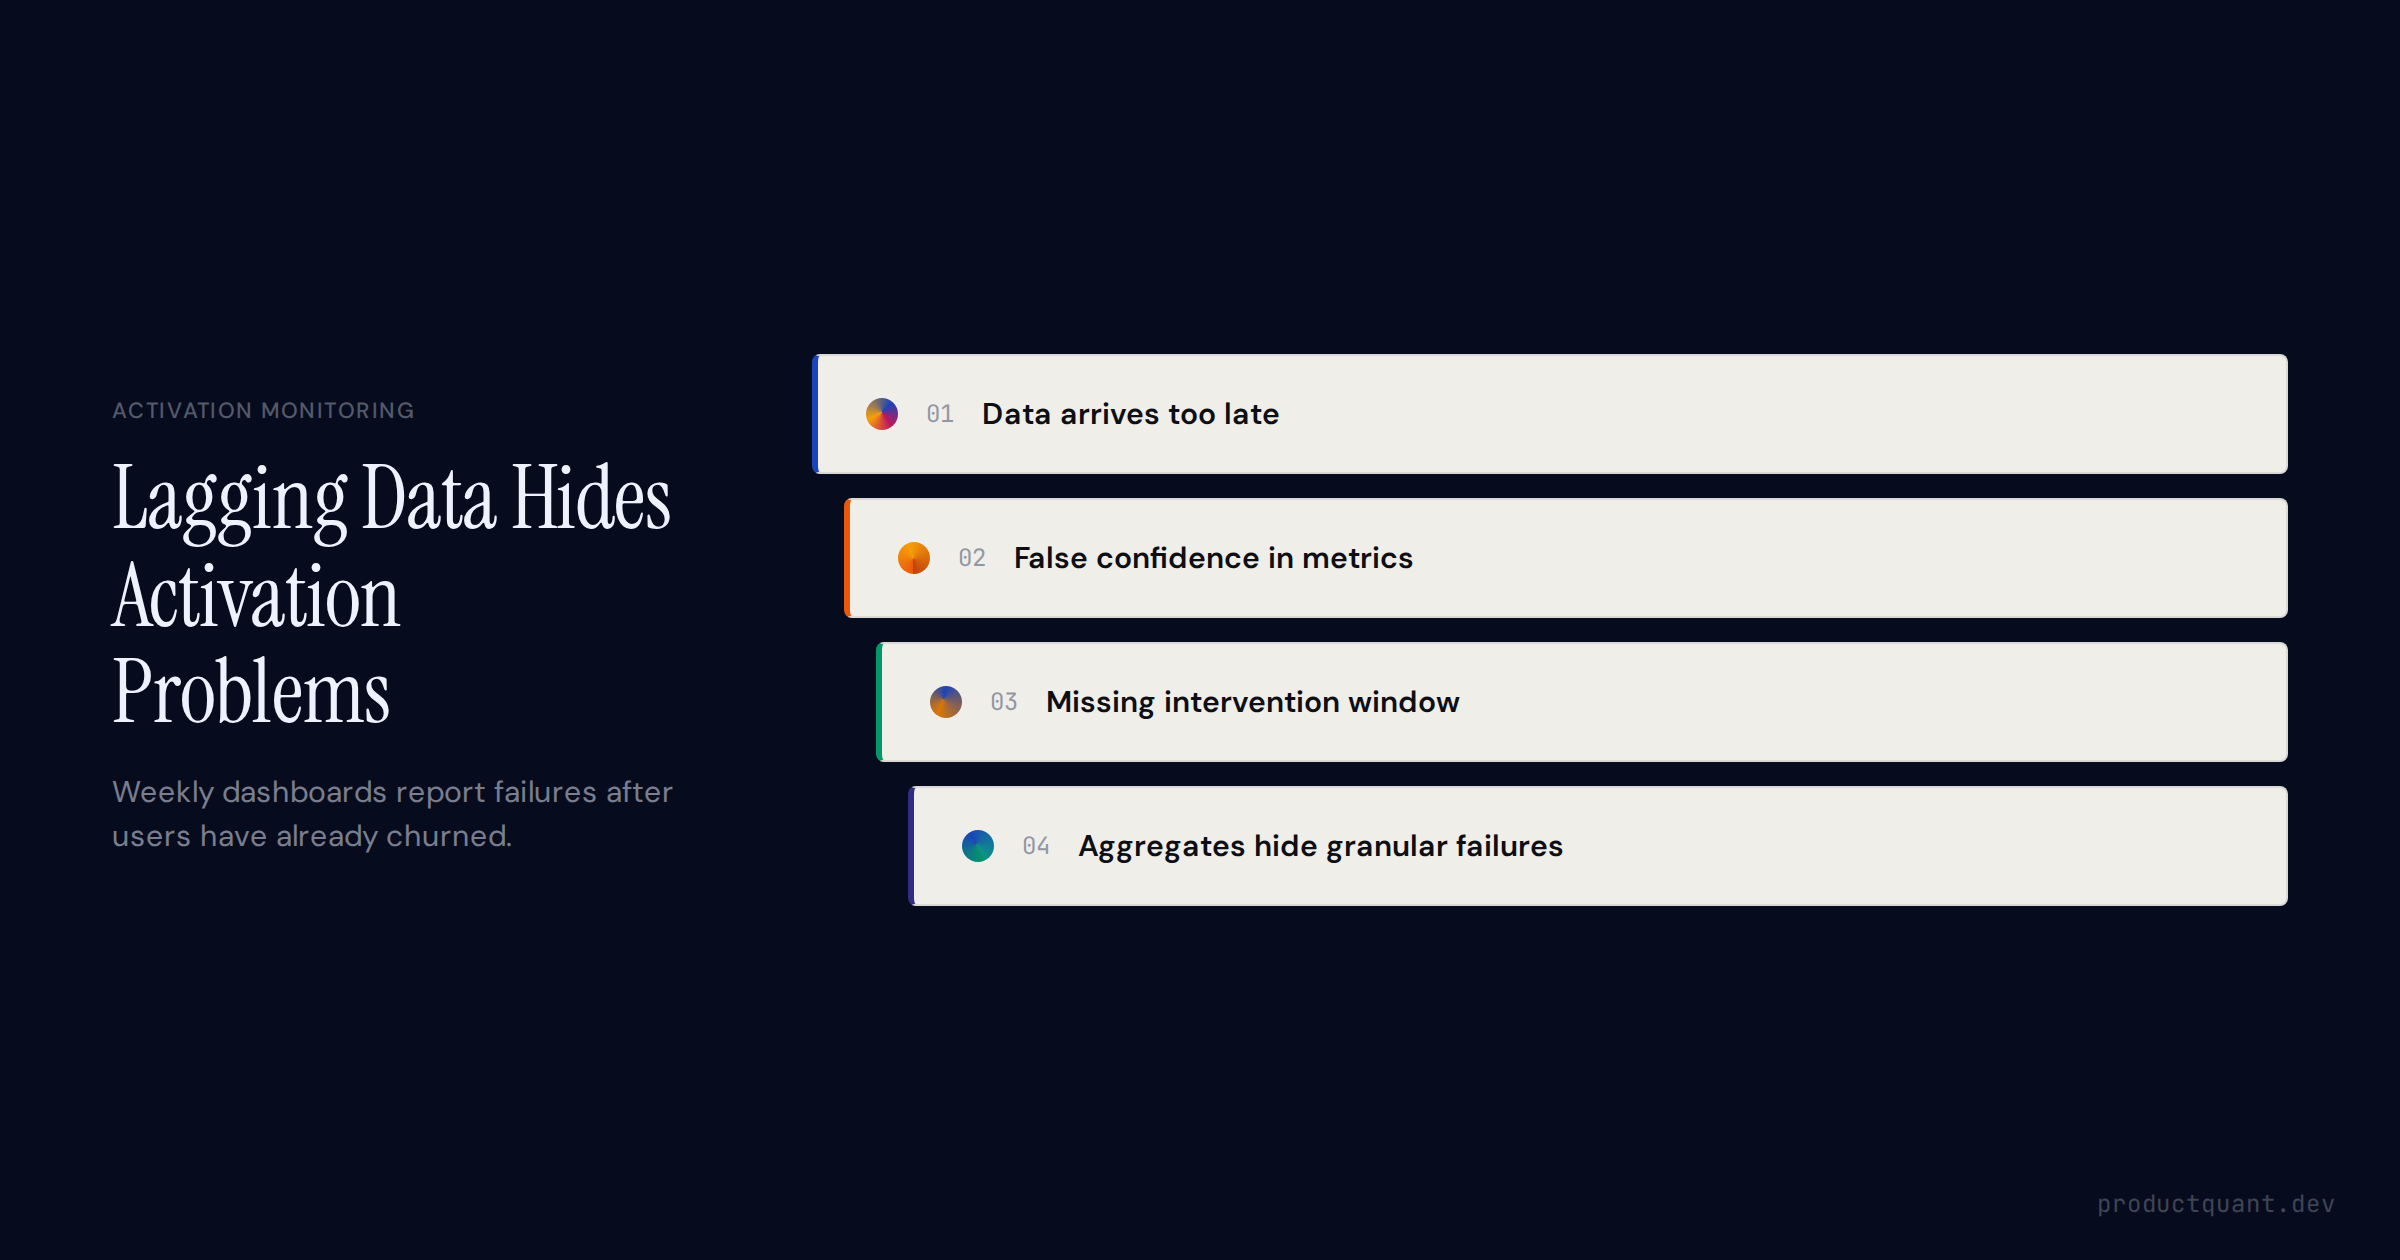
Your activation dashboard shows you last week
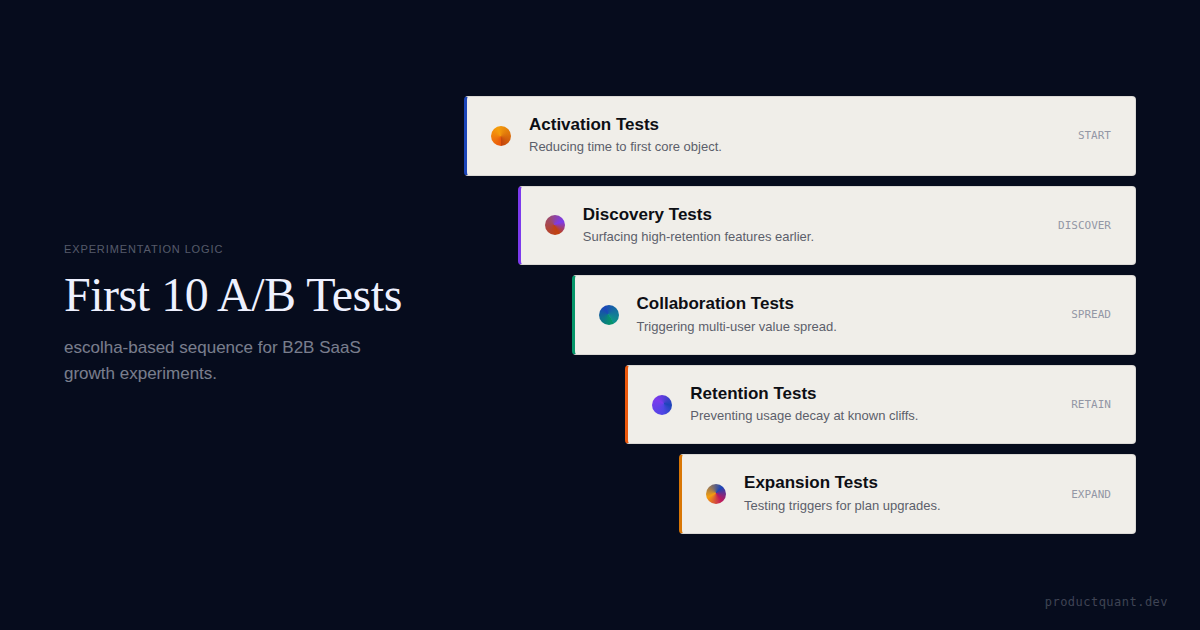
A sequenced experimentation playbook for B2B SaaS: the first 10 A/B tests to run, how to write a proper hypothesis, what to measure, and how to avoid the four strategic traps that waste experiment budgets.
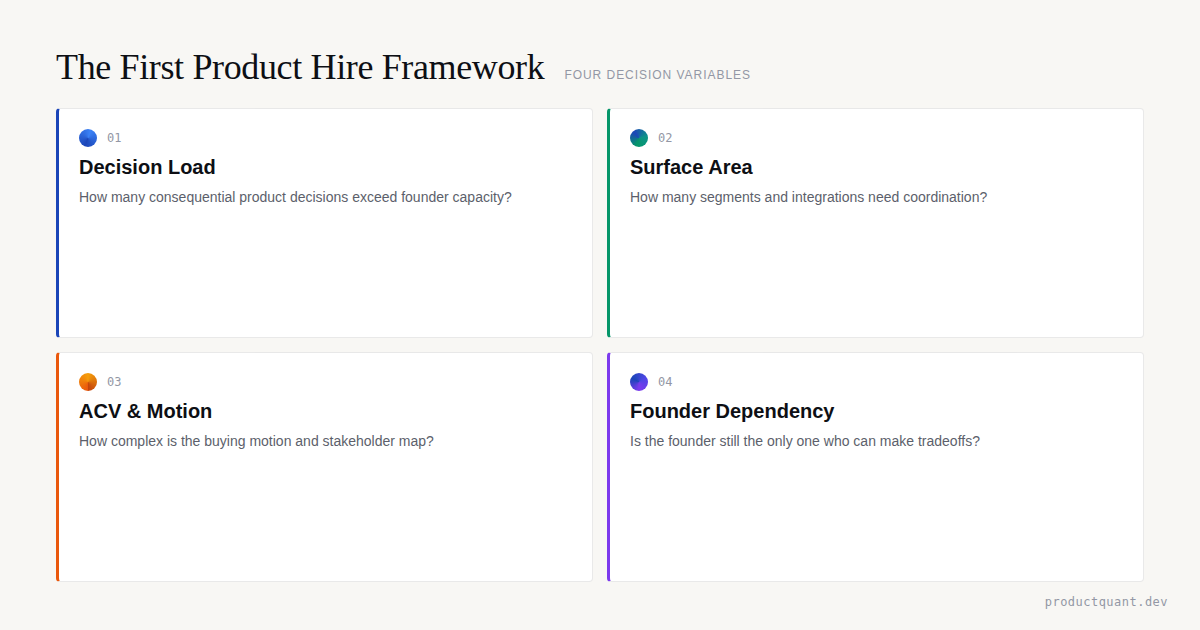
A practical framework for deciding when a B2B SaaS company should make its first product hire, what level to hire, and how to avoid turning the first PM...
Most onboarding improvements target the wrong variable. You add a tooltip, extend the product tour, send another email. The user learns how your product wo
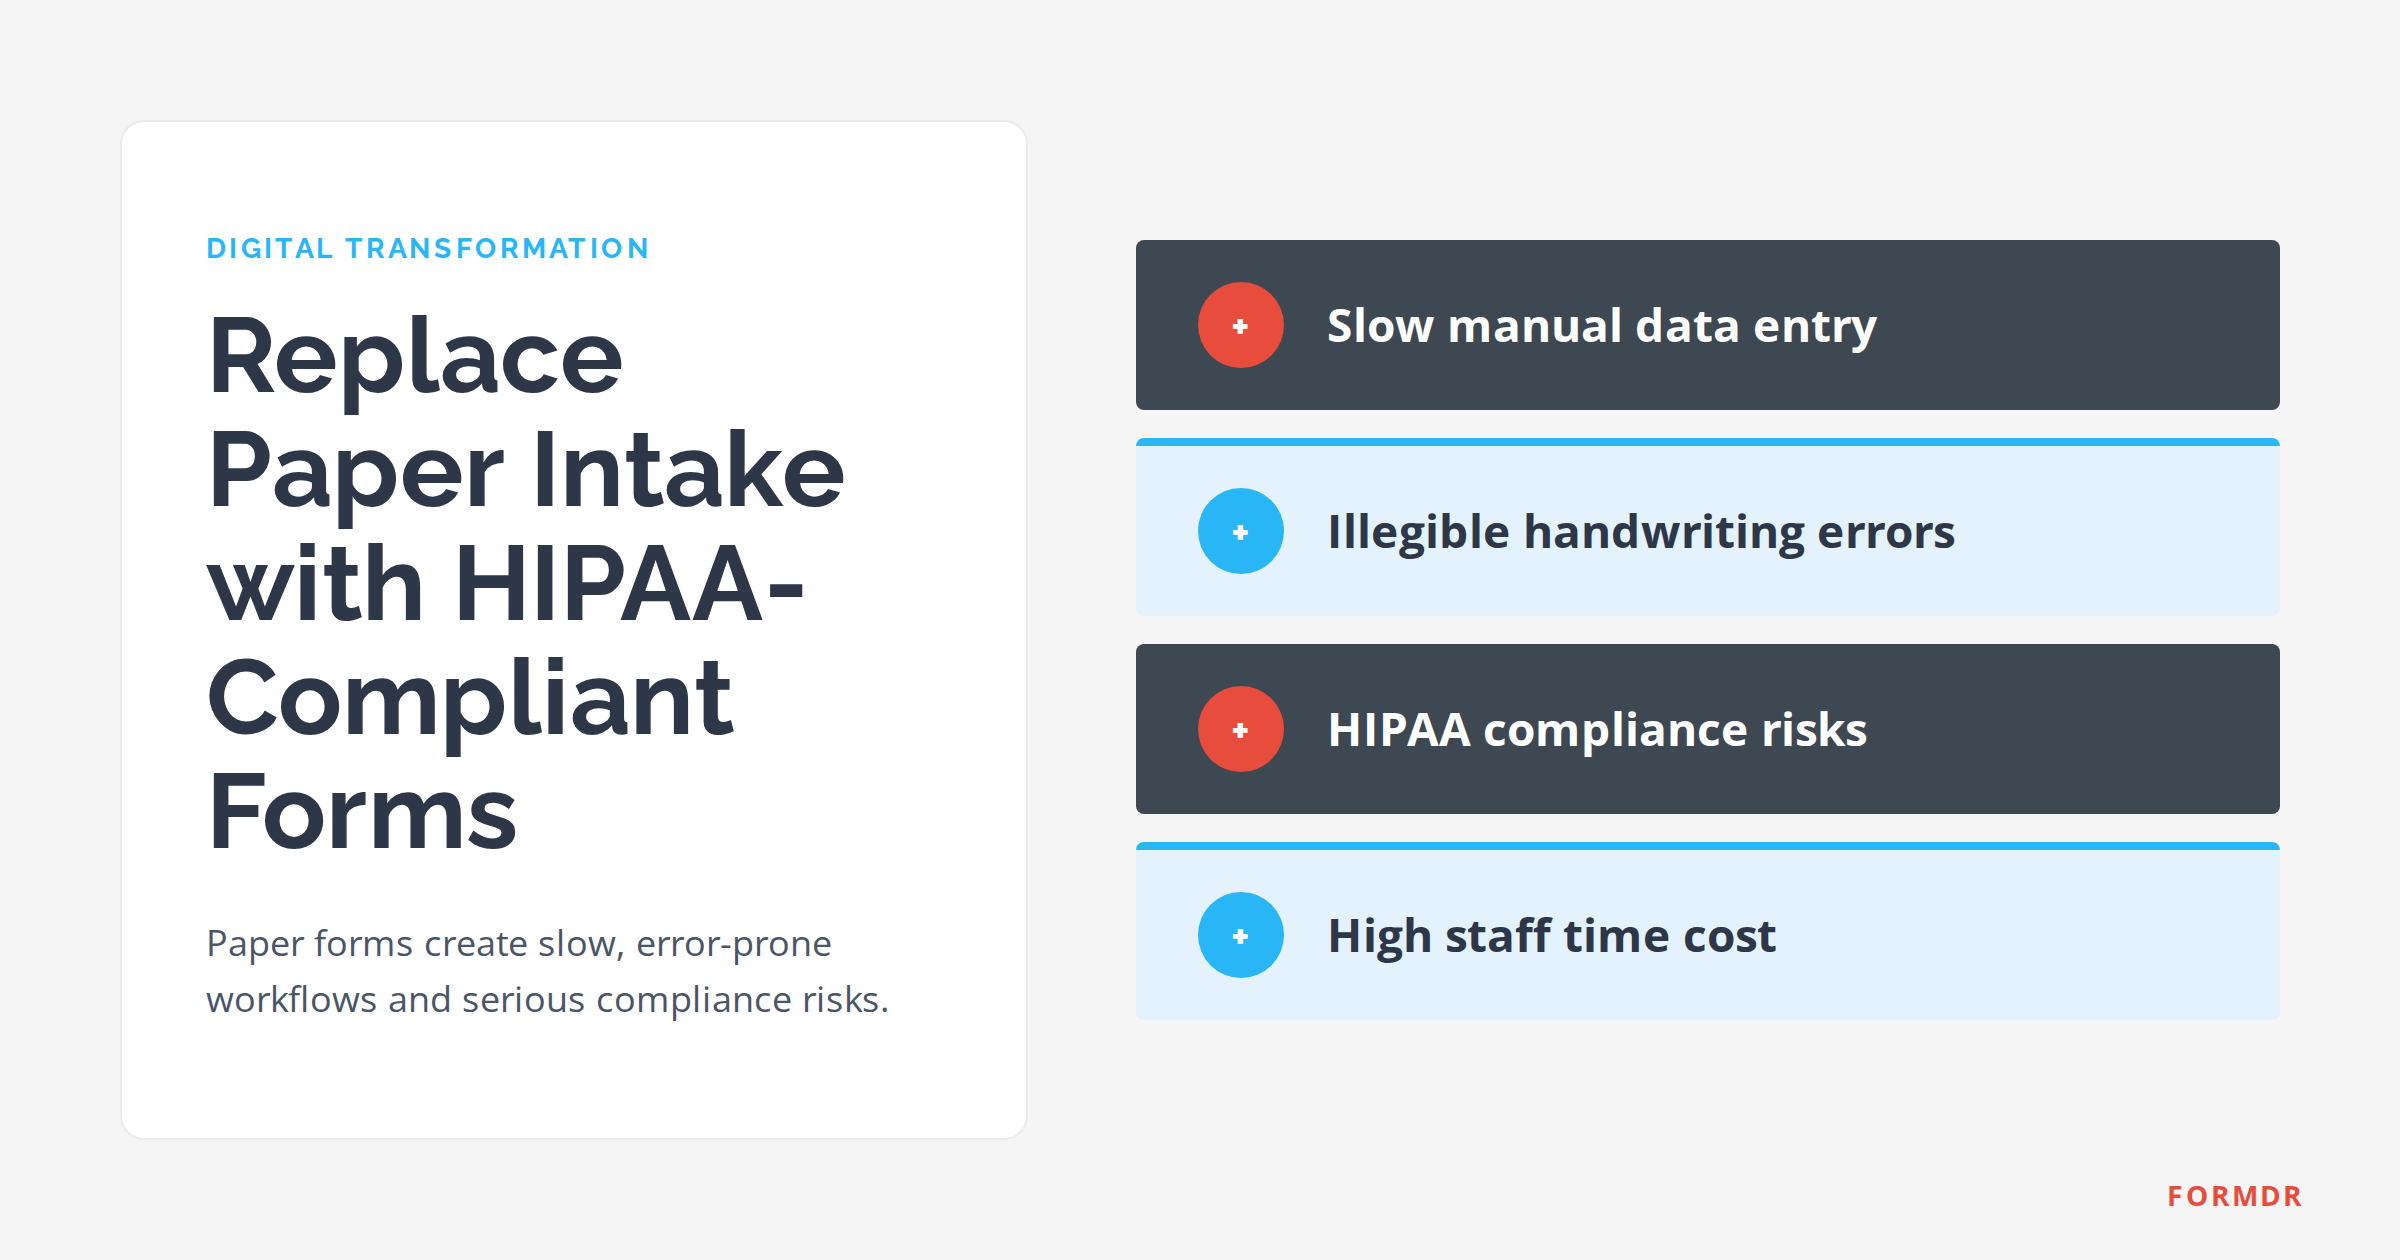
How healthcare practices can eliminate paper forms, reduce wait times, and stay HIPAA compliant with digital patient intake forms.
Founder-led sales is the fastest way to $1M ARR. It is also the fastest way to stall there. Here is why the ceiling exists, what the data shows, and what replaces intuition when it stops scaling.
The standard advice for scaling beyond founder-led sales is

An honest guide to fractional Chief Product Officers. Scope, limitations, engagement models, ideal use cases, and when a full-time CPO is the better choice for your B2B SaaS.
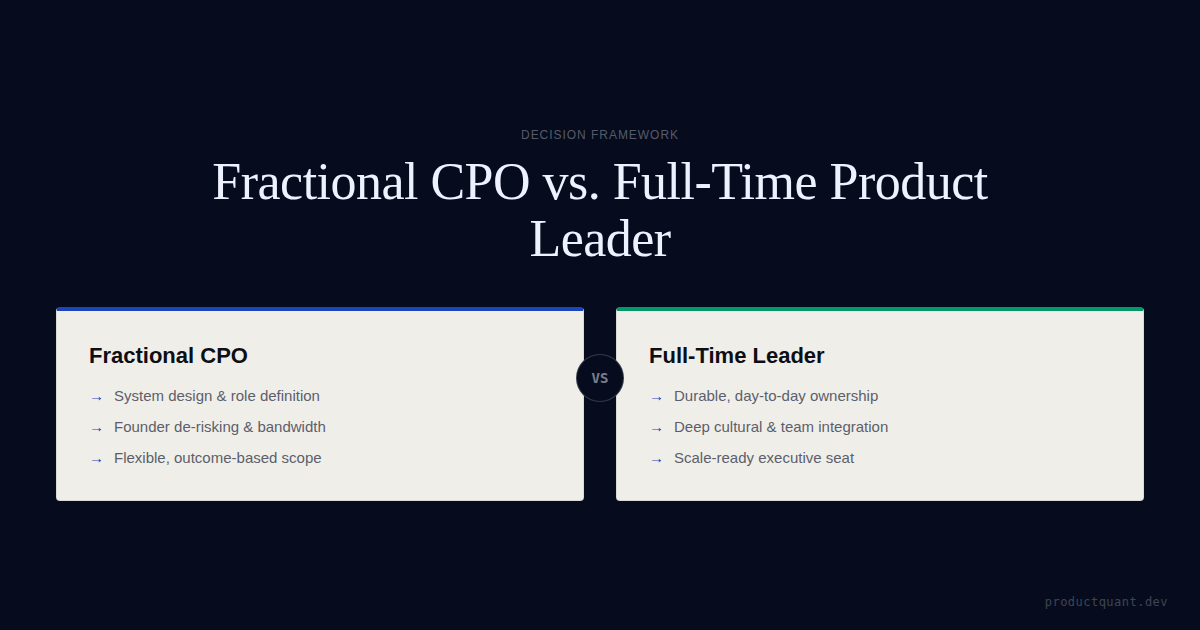
A practical guide to choosing between a fractional CPO and a full-time product leader in B2B SaaS, based on stage, product-system needs, founder...
Same price range. Different jobs. If you hire the wrong one, you

Decide between Free Trial and Freemium for your SaaS. Learn the 2026 framework based on ACV, TTV, and AI compute costs. Introducing the

Compare growth agencies, fractional CPOs, and in-house teams across cost, capability, and timeline. An honest decision framework for SaaS founders and operators.
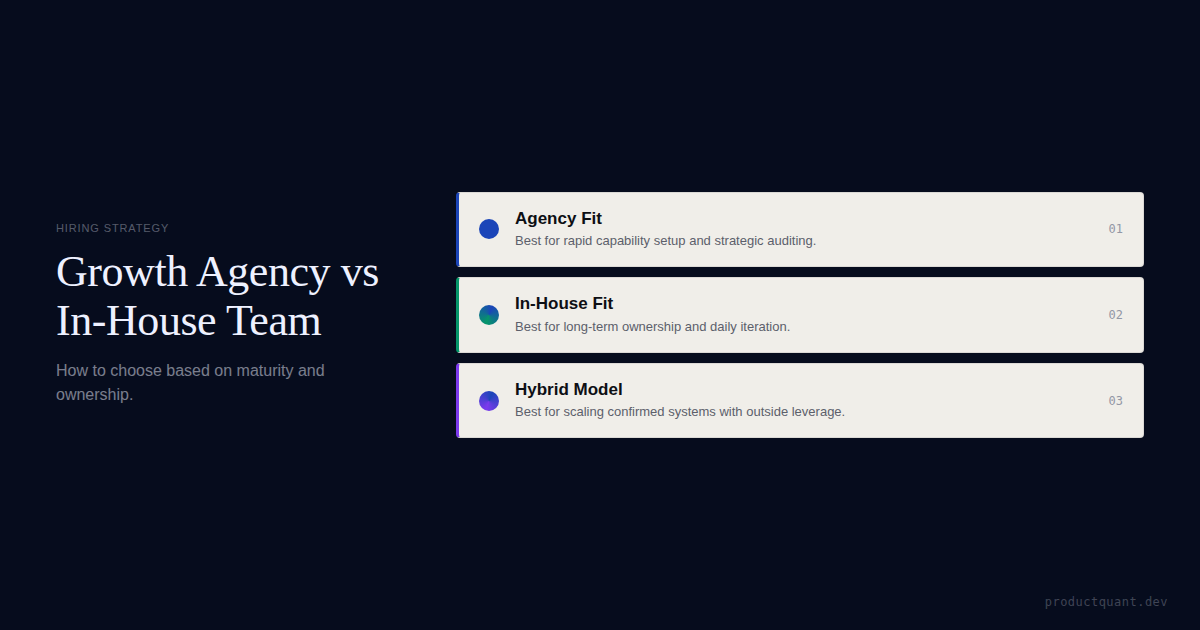
A practical guide to choosing between a growth agency and an in-house team in B2B SaaS, based on system maturity, ownership needs, speed to capability,...
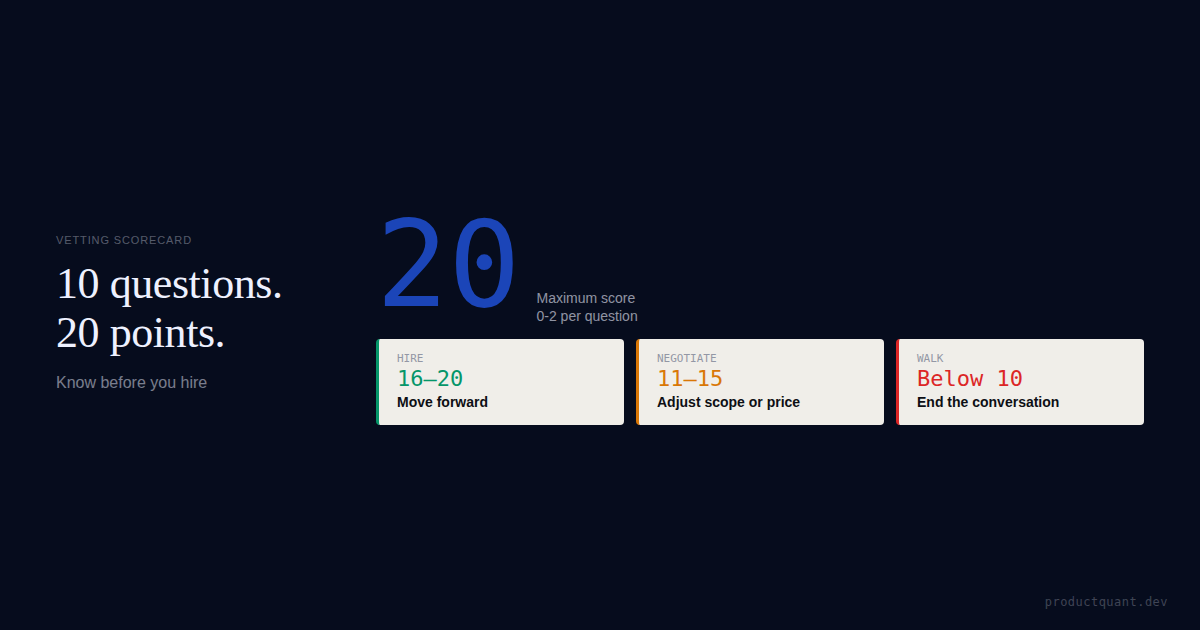
Before you hire a growth consultant, run them through this scorecard. 10 questions to separate consultants who move revenue from ones who produce slide decks.
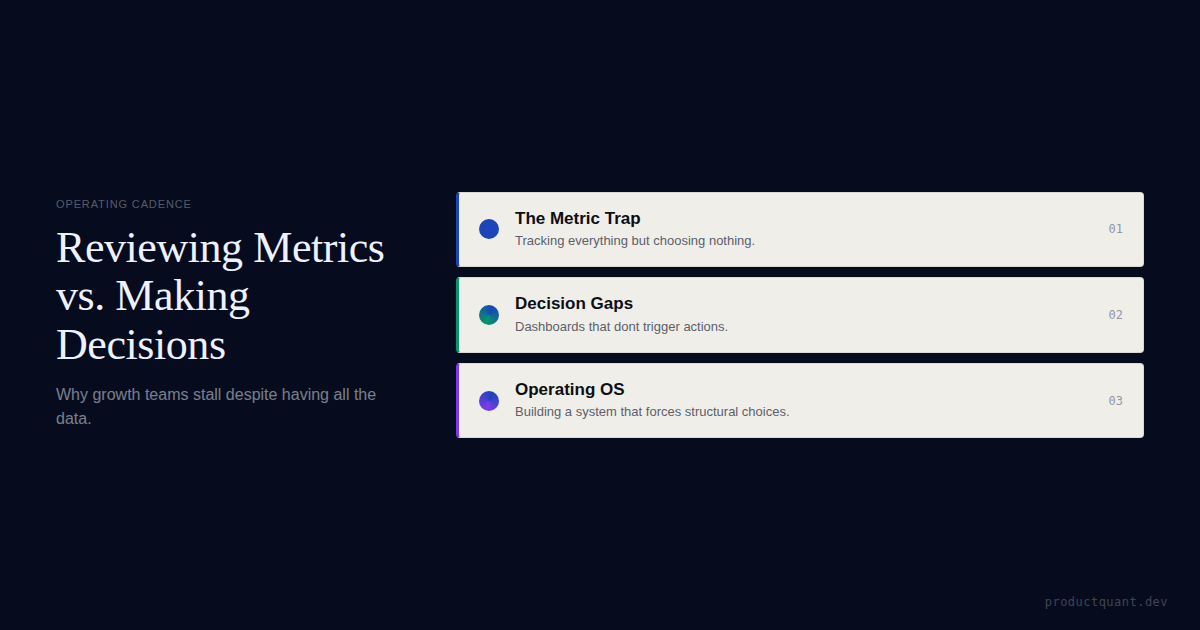
A lot of growth teams have dashboards, experiment logs, and weekly meetings. What they do not have is a decision system.
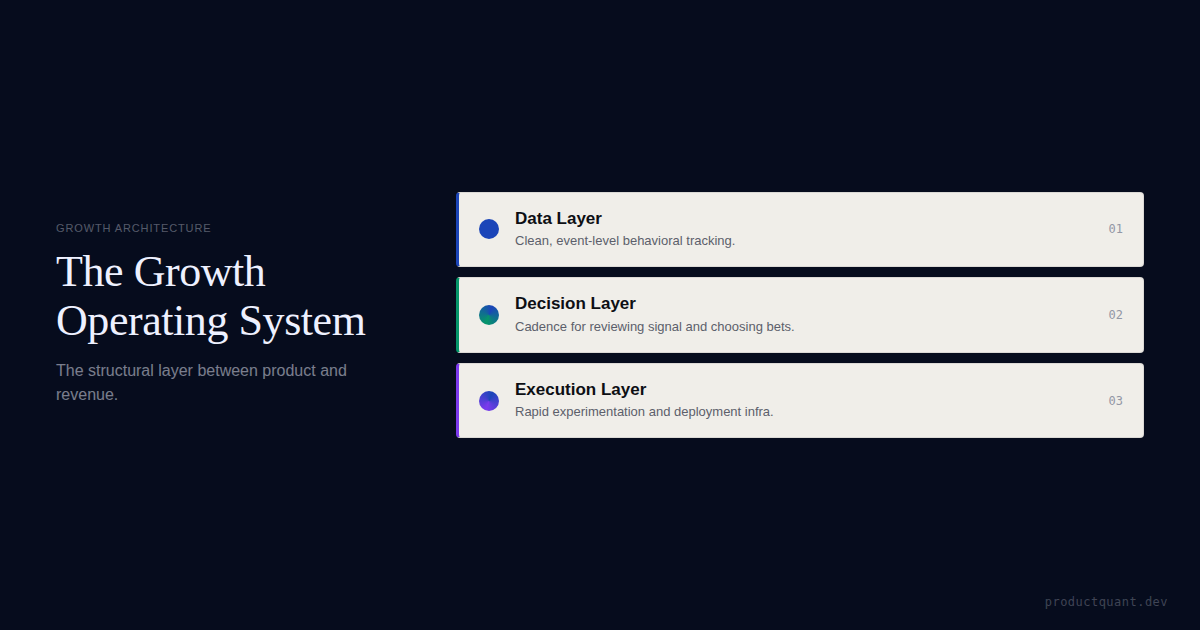
What a growth operating system actually is in B2B SaaS, why teams stall without one, and how analytics, experiments, churn, GTM, and decision cadence fit...
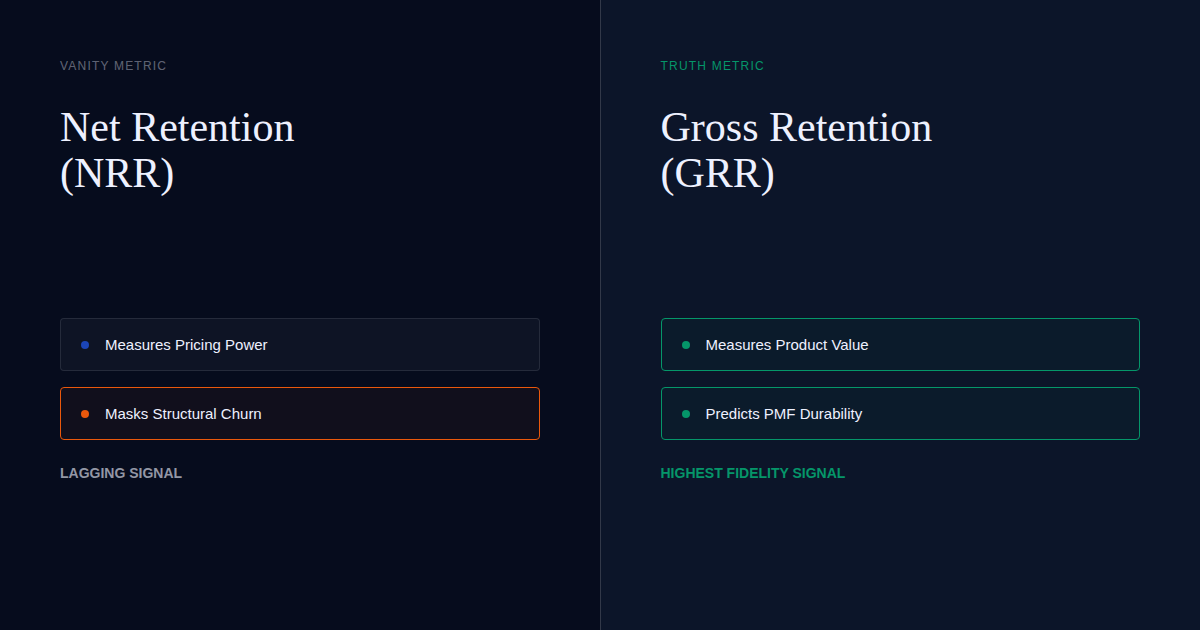
NRR is a vanity metric that masks structural churn. Learn why Gross Revenue Retention (GRR) is the only true measure of PMF for Series B investors in 2026.
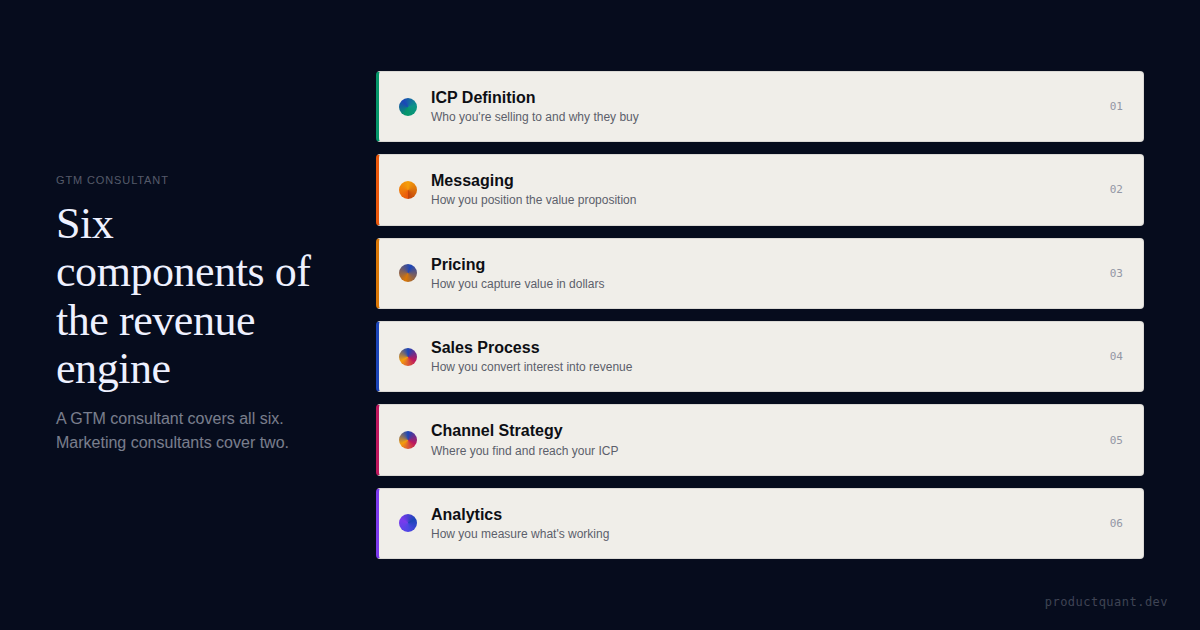
GTM consultants diagnose what

How to hire the right GTM consultant for your B2B SaaS. GTM consultant pricing, vetting framework, and what to expect from a growth engagement.

Most B2B SaaS teams run the wrong GTM motion for their product DNA. Here is how to classify your product and match it to the growth motion it supports.
Healthcare SaaS companies can run full product analytics without HIPAA risk. Implement compliant analytics for healthcare B2B SaaS while meeting regulatory requirements and protecting patient data.
A practical guide to choosing a B2B SaaS growth consultant, including how to evaluate diagnosis quality, operating fit, specialization, and whether you...

A 5-step vetting framework for B2B SaaS founders: how to name the bottleneck, match consultant type to stage, vet frameworks under pressure, demand pricing transparency, and spot the 7 red flags that predict a failed eng

Decide if a PLG agency is right for your SaaS. Learn what they do, red flags to avoid, when in-house is better, and get a decision framework to grow product-led.

Most PLG consultant evaluations happen backwards. Founders ask about methodology before asking about results. They check slide decks before checking accoun

You cannot evaluate a product analytics consultant by looking at dashboards they built for other companies. You evaluate them by how they think about your

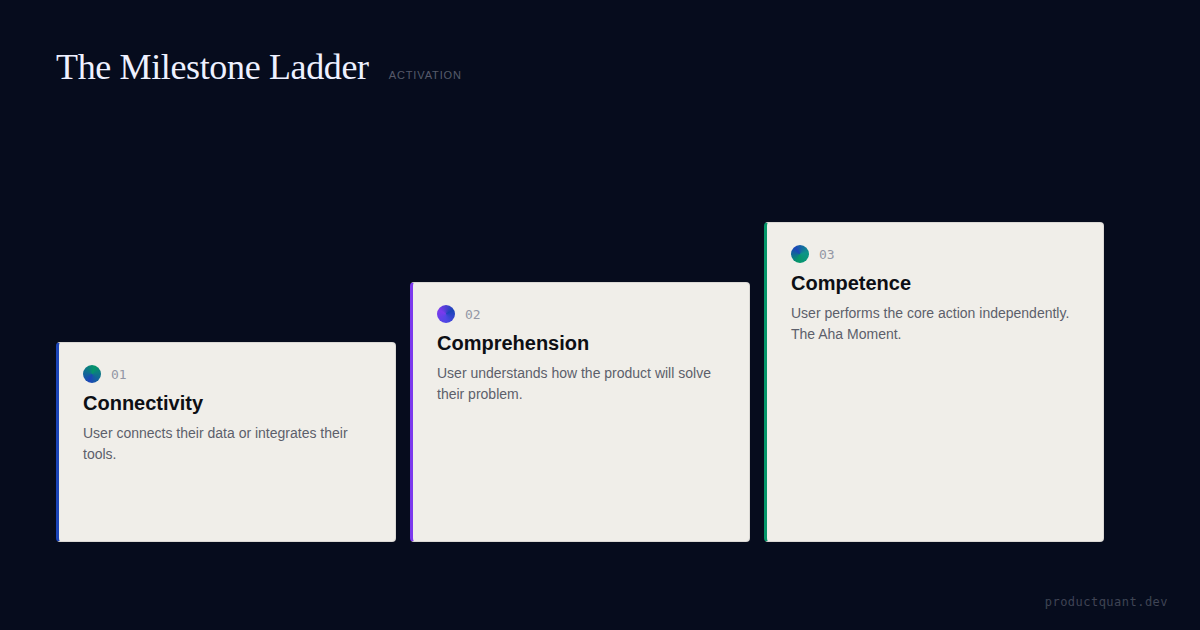
Increase your SaaS activation rate by 15-20%. Learn to identify your
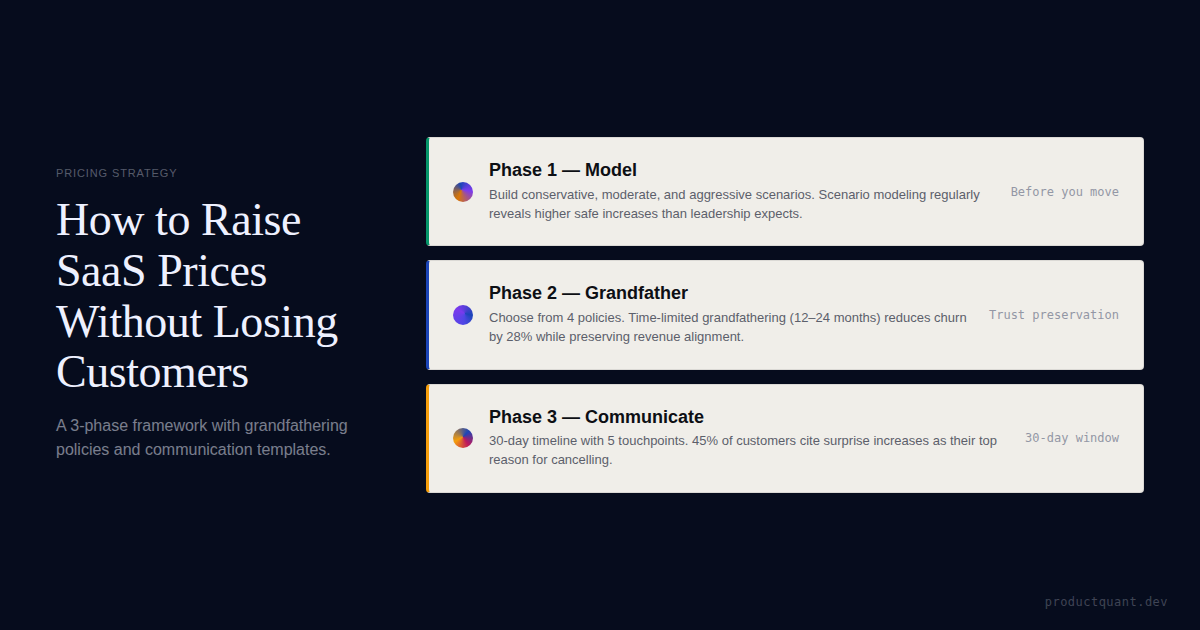
Raise SaaS prices with zero churn impact. The 3-phase framework with grandfathering strategies, communication templates, and real case studies.

Stop guessing why users leave. Learn the RFM framework for SaaS churn reduction. 2026 benchmarks, behavioral segments, and 90-day intervention flows.
Most cold email subject lines fail because they optimize for cleverness instead of clarity. B2B buyers scan their inboxes with specific jobs to do. Your su
An 8-point onboarding teardown framework for B2B SaaS covering promise clarity, activation path, friction, proof, guidance, team activation,...
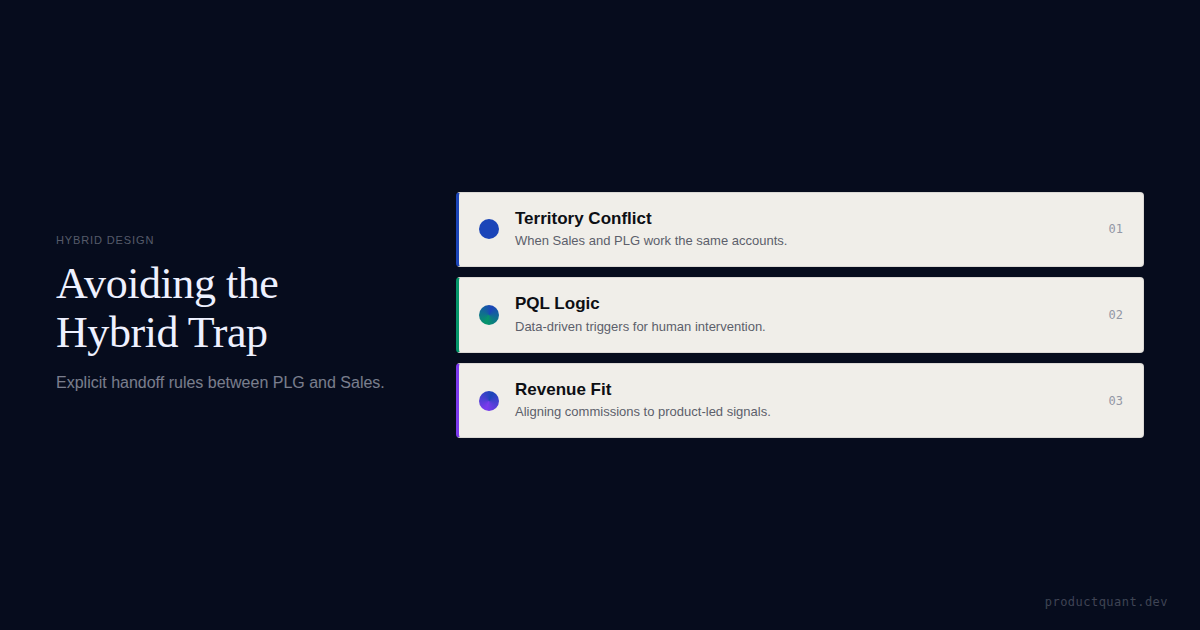
Hybrid growth fails when PLG and sales-assist lack clear boundaries. This article maps the handoff rules that keep both motions from cannibalizing each other.
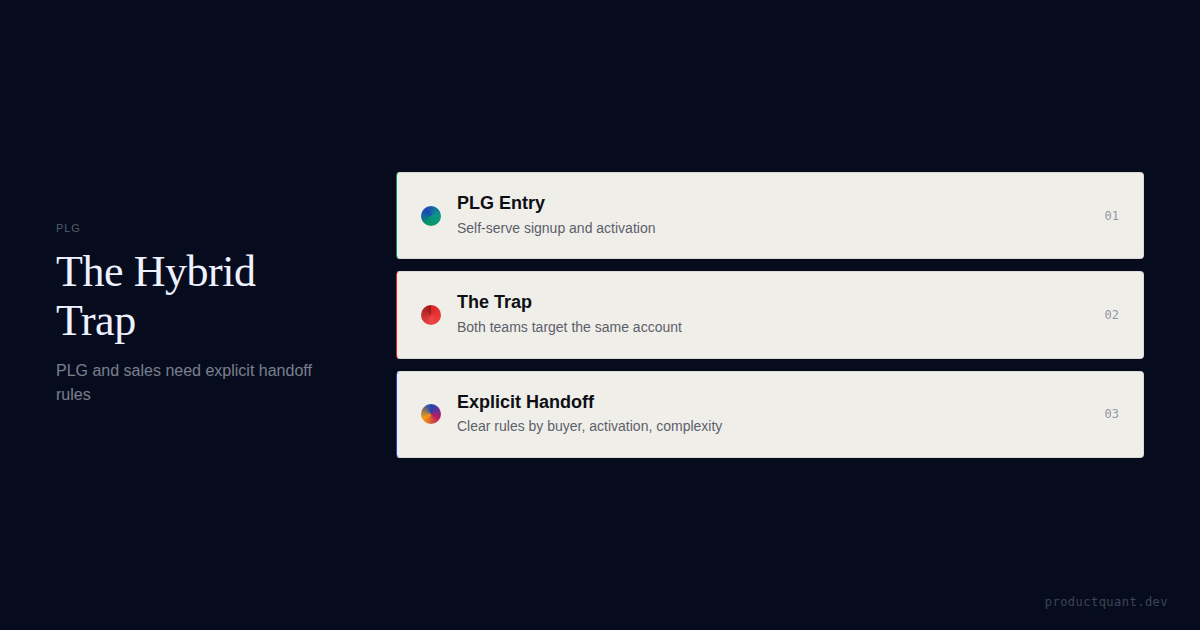
Hybrid growth breaks when PLG and sales target the same account without clear handoff rules. Design the motion around buyer, activation, and complexity.
Every contact database sells intent data. But intent is not a dataset. It is a pattern that reveals itself across platforms, over time, and only when you know what to look for.
Companies buy intent data from Bombora, G2, and ZoomInfo, but most fail to build the infrastructure that turns raw topic-level signals into pipeline. The gap between buying intent data and operationalizing it is where pi
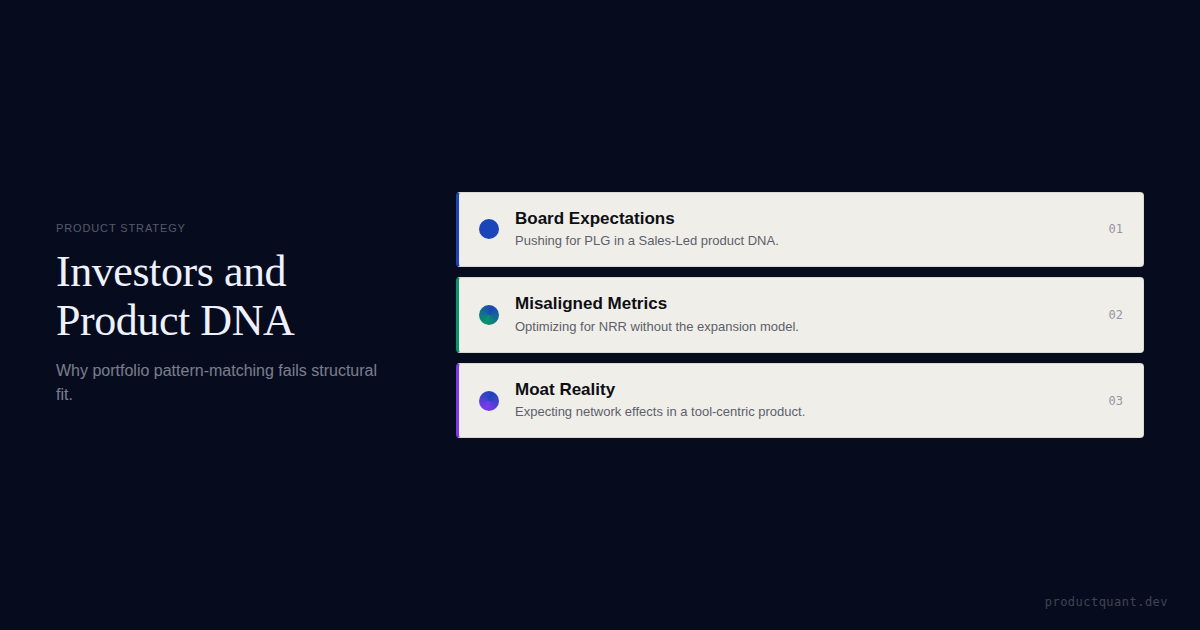
Investors often push portfolio patterns that do not fit the product in front of them. The gap is usually structural, not philosophical.

For SaaS founders and growth PMs at $1M-$5M ARR who are running CS interventions and product experiments while ignoring the billing failure quietly drainin
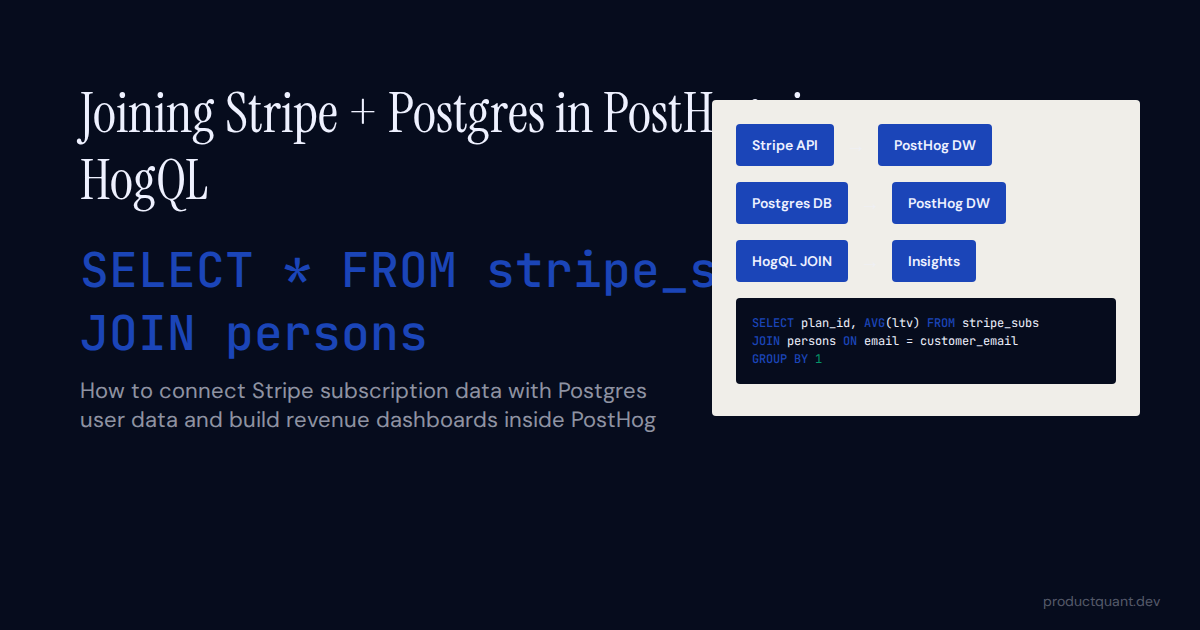
Learn how to connect Stripe and Postgres data in PostHog using HogQL joins. Build LTV queries, churn dashboards, and expansion revenue reports with examples.

Stop writing

Stop building features, start solving jobs. Technical guide to the JTBD Dashboard Template using Outcome-Driven Innovation (ODI) and Opportunity Scores.
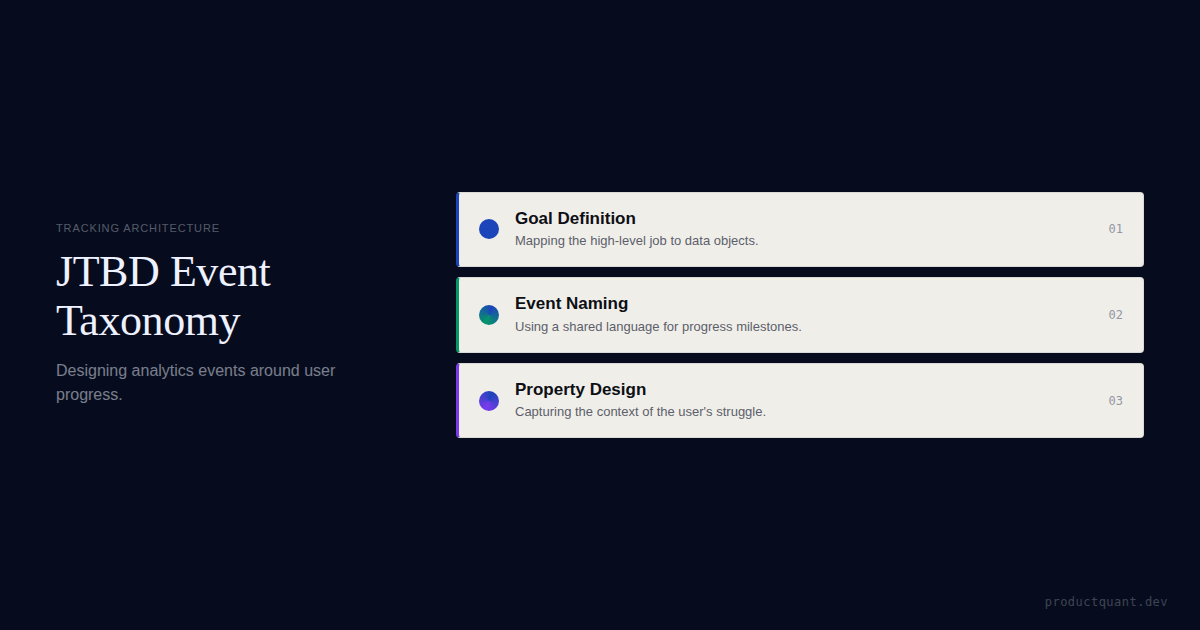
How to design a product analytics event taxonomy organised around jobs-to-be-done instead of UI interactions — a 5-step process with naming conventions,...
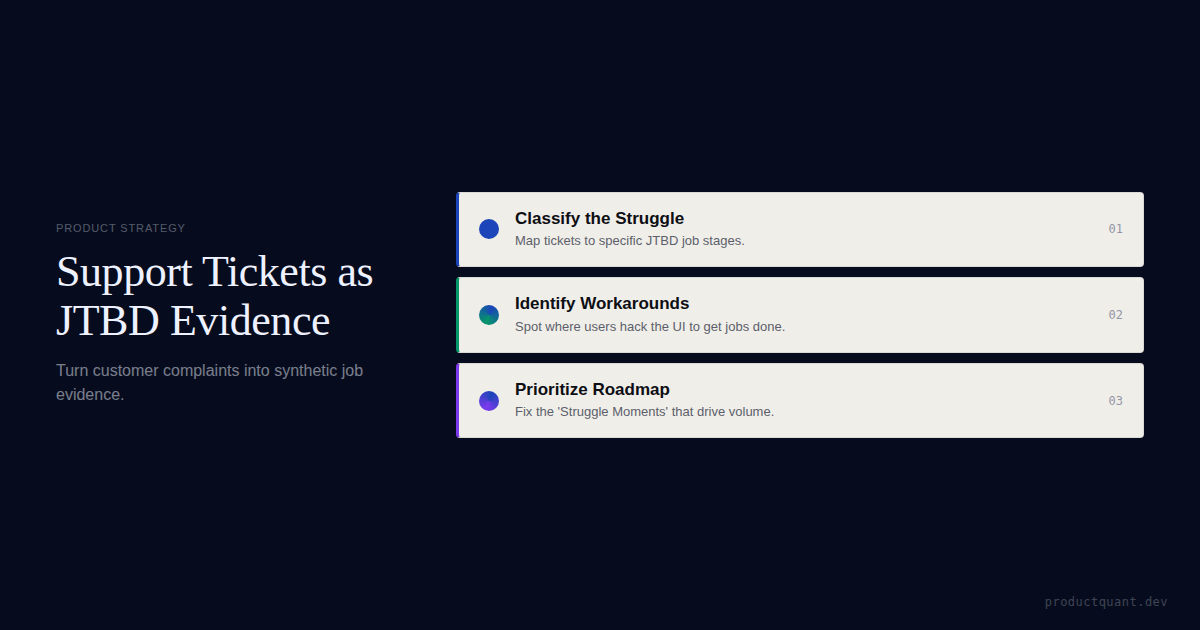
A practical guide to turning support tickets into synthetic JTBD evidence: classify recurring friction by job, spot escalation patterns, and use support...
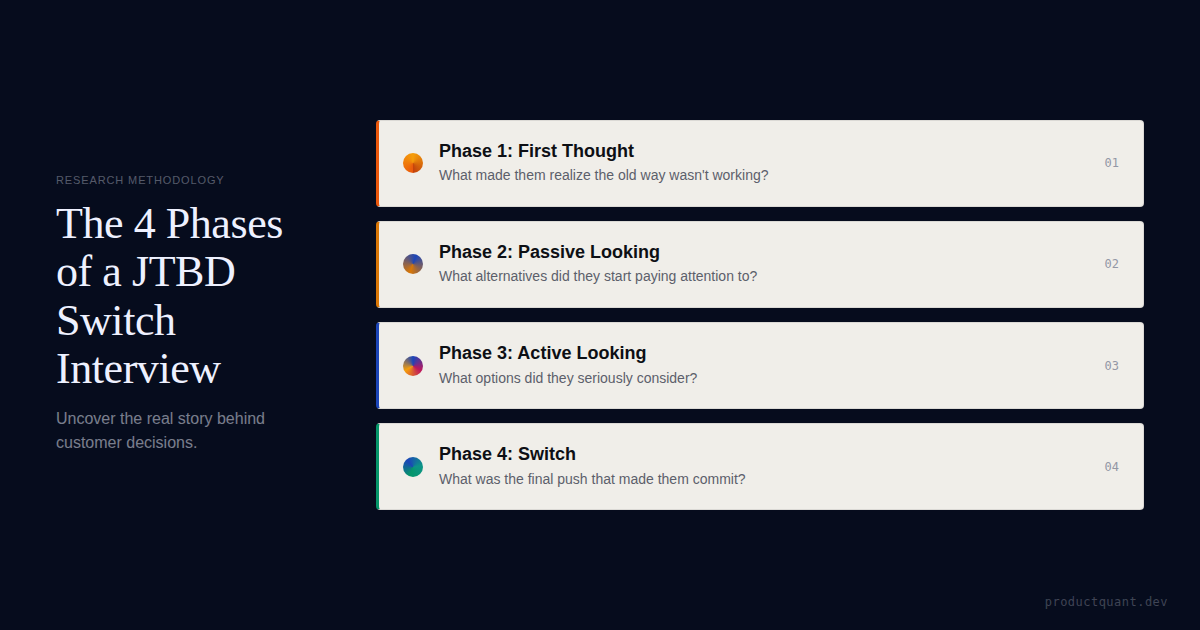
Most product teams run user interviews. They get opinions. Switch interviews get you the actual job your product was hired to do. Here is the complete scri

A practical guide to running a JTBD + Kano workshop for B2B SaaS: interviews, ODI scoring, Kano survey design, and the combined output that sharpens...
Roadmaps built from feature requests often miss the jobs that actually drive adoption and retention. The better system is a closed loop from jobs to outcomes.

JTBD is the most misunderstood framework in SaaS. Learn the job statement formula, switch interviews, ODI scoring, and how to end the feature factory for good.
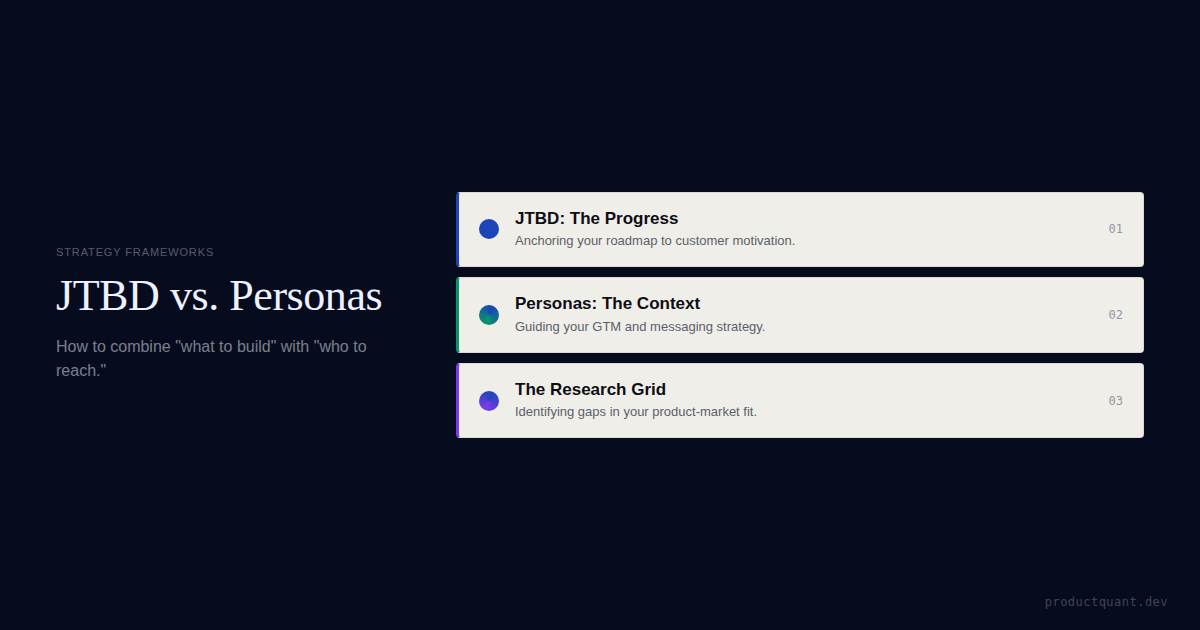
JTBD and personas are not competitors. They are two halves of the same picture. Learn when to use each framework and combine them for better decisions.
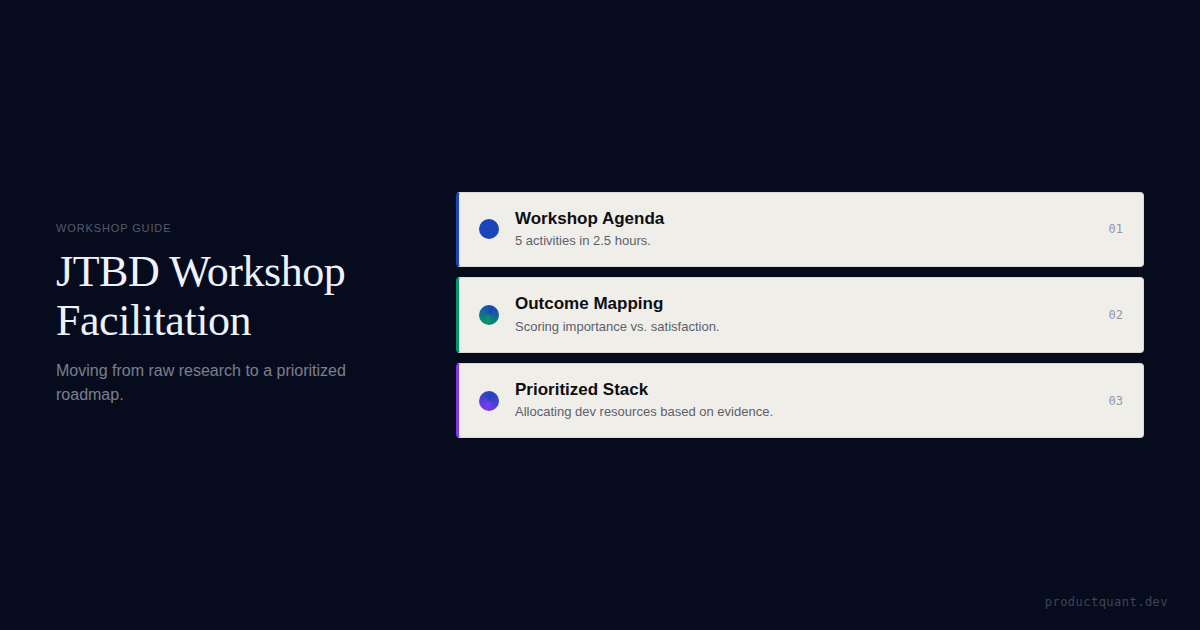
JTBD workshop guide for SaaS product teams. Run a 2.5-hour session with interview data, job statements, opportunity scoring, and roadmap priorities.

How running a Kano survey on your feature set reveals the natural pricing tier architecture — which features belong in every tier and which gate premium.
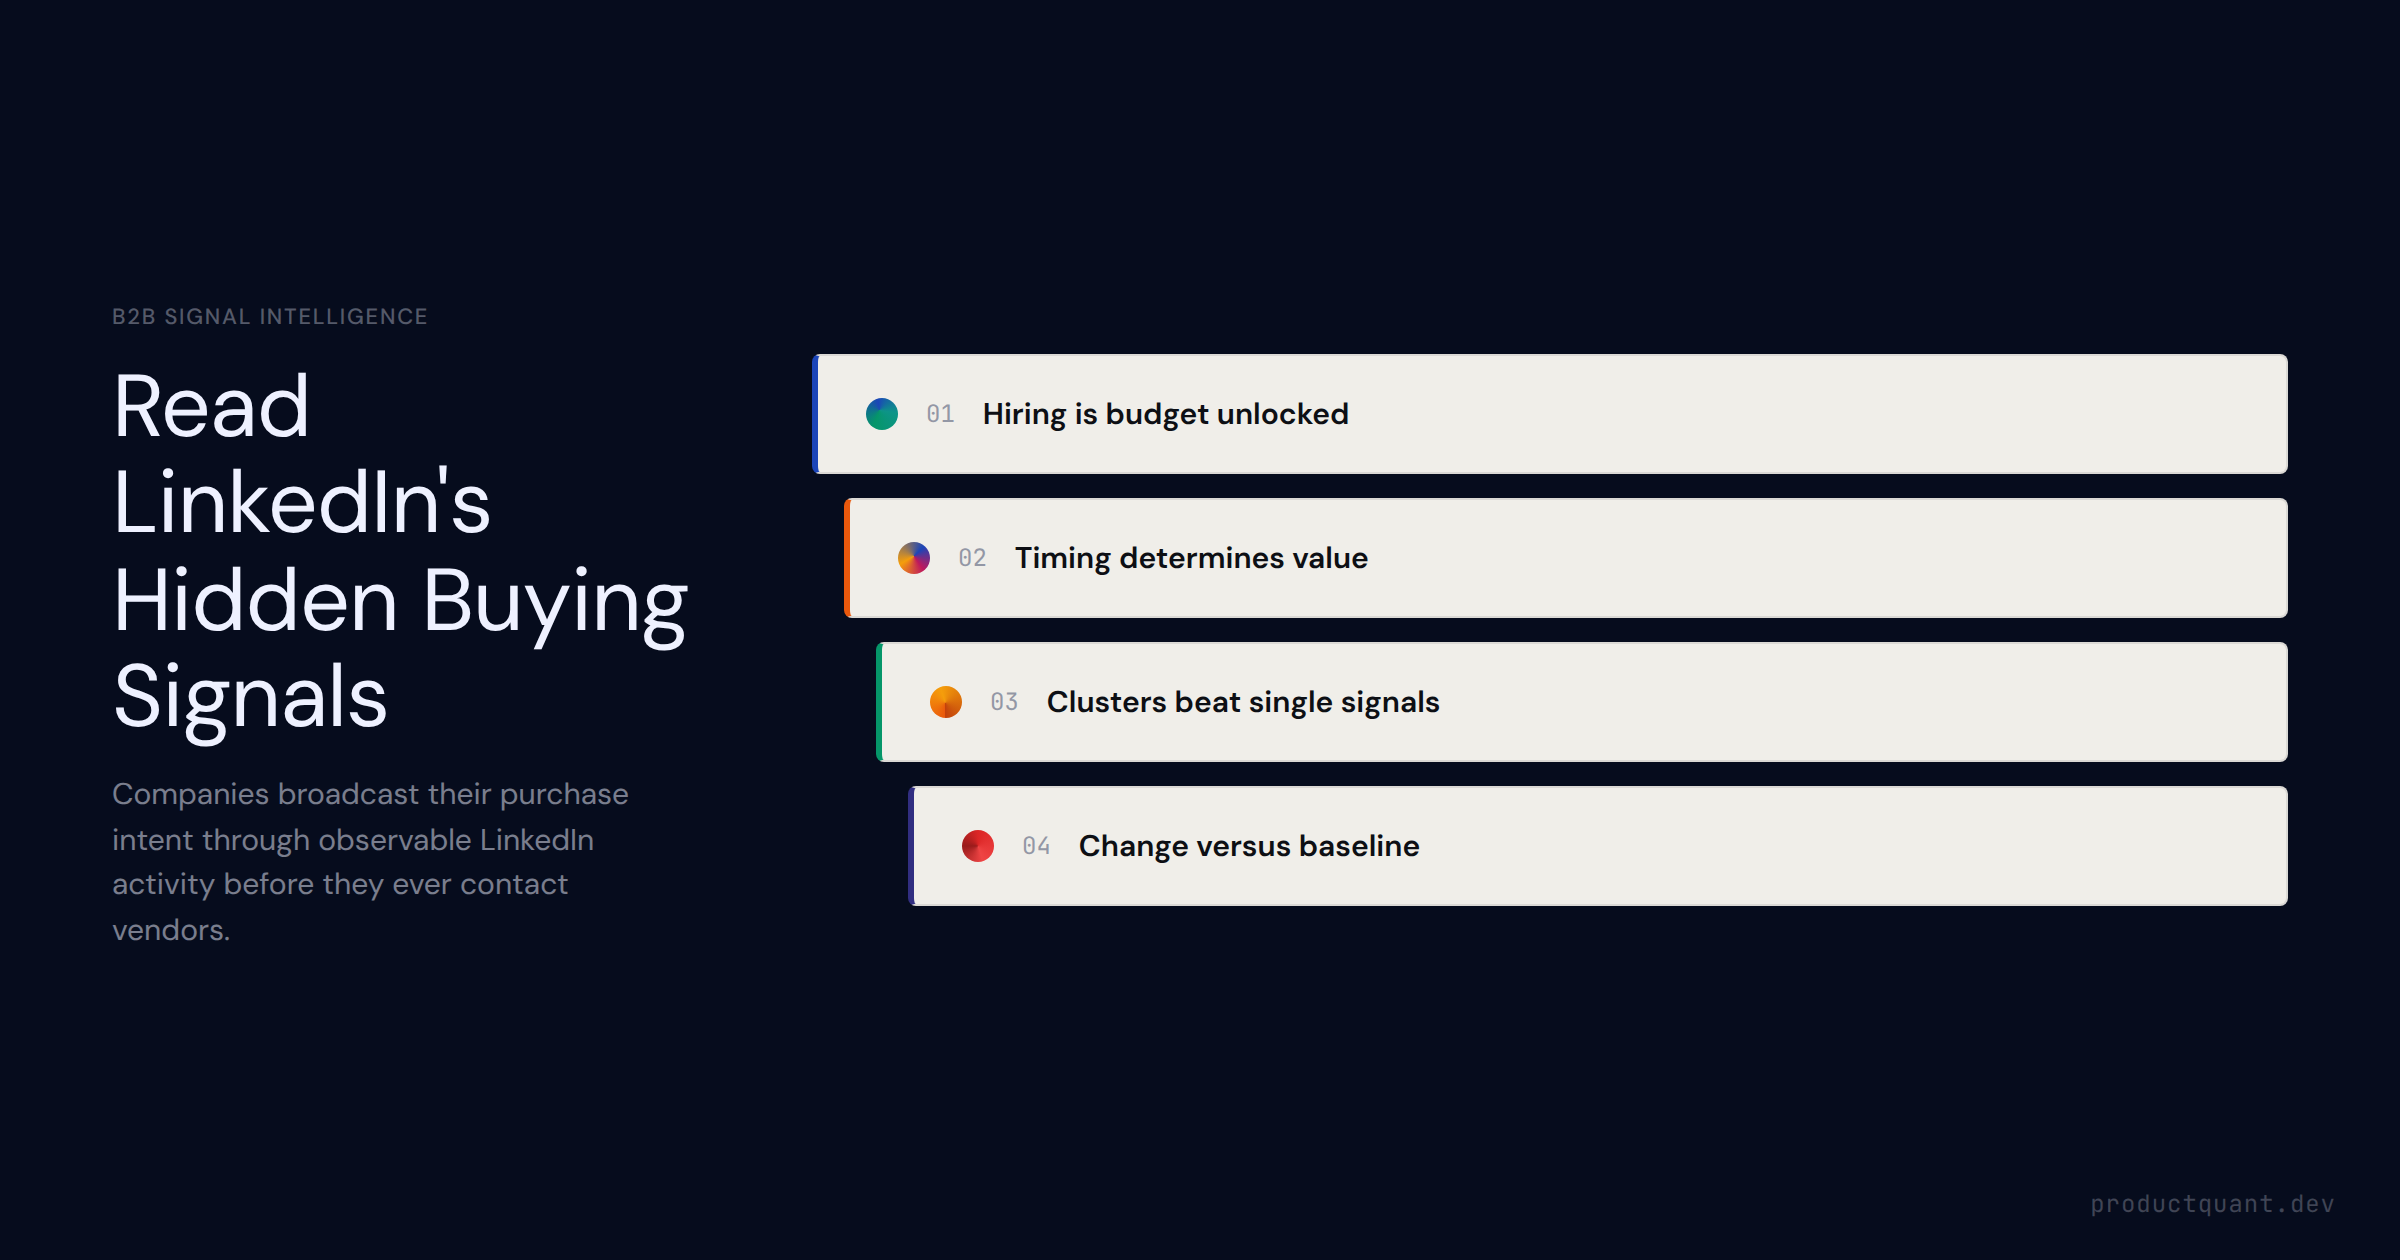
A practical guide for B2B SaaS growth teams: how to read LinkedIn intent signals — hiring posts, content engagement, growth cues — and when to act on them.

Product teams running manual cohort analysis are paying a compounding tax in analyst time, delayed decisions, and missed activation moments. This is the st
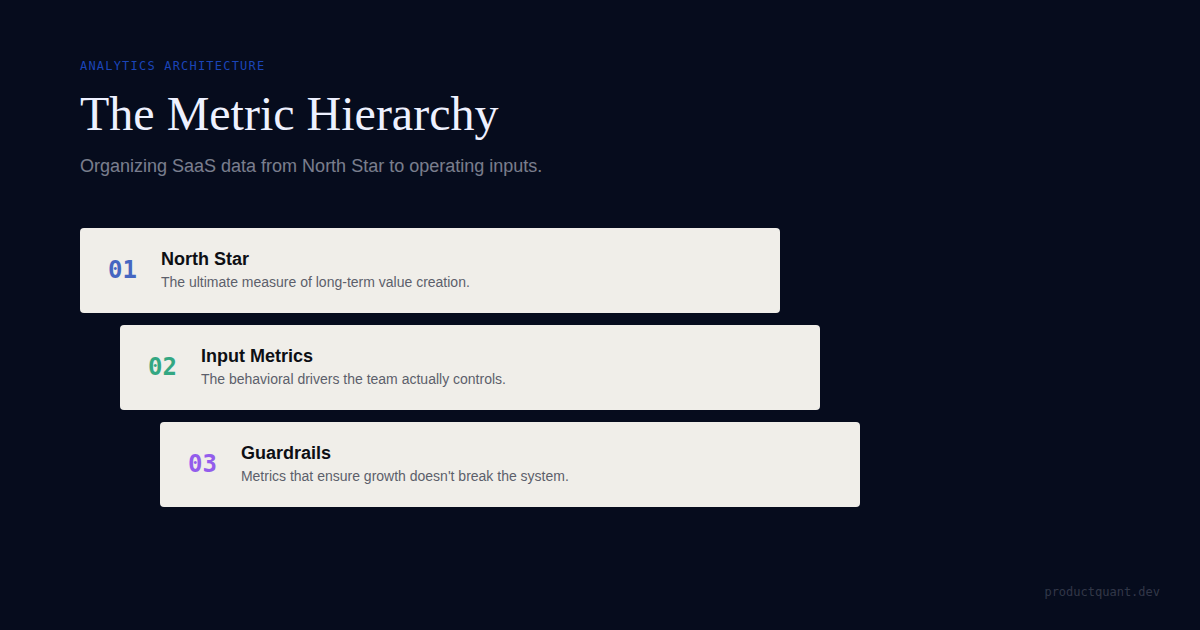
Most B2B SaaS teams have metrics but no hierarchy. Without a hierarchy, dashboards show everything and guide nothing. The three-layer structure — North Star, leading indicators, diagnostic metrics — and the three dashboa
Revenue growth and high churn can exist simultaneously. $1M ARR is where mixed signals are most common and most dangerous — growth makes problems easy to ignore. How to read ambiguous PMF data correctly.
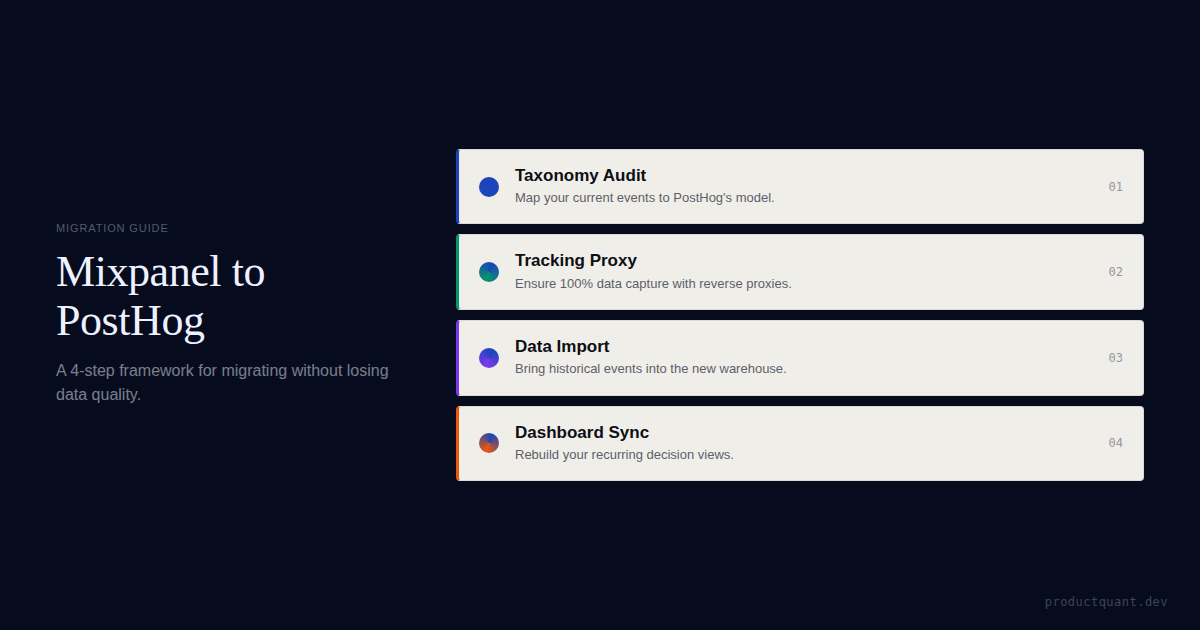
The data transfer is the easy part. The rebuild, the validation, the team training, and the silent failures that surface three weeks after go-live — those
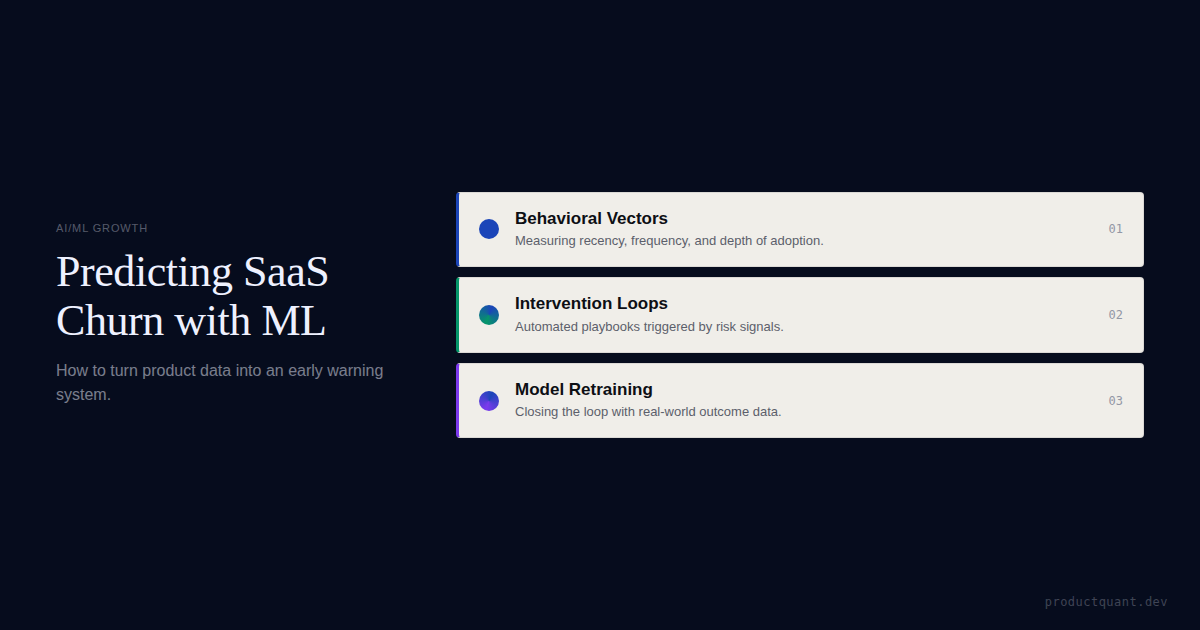
Most teams find out when a customer leaves. We build systems that tell you weeks before they decide. The full churn prediction playbook.
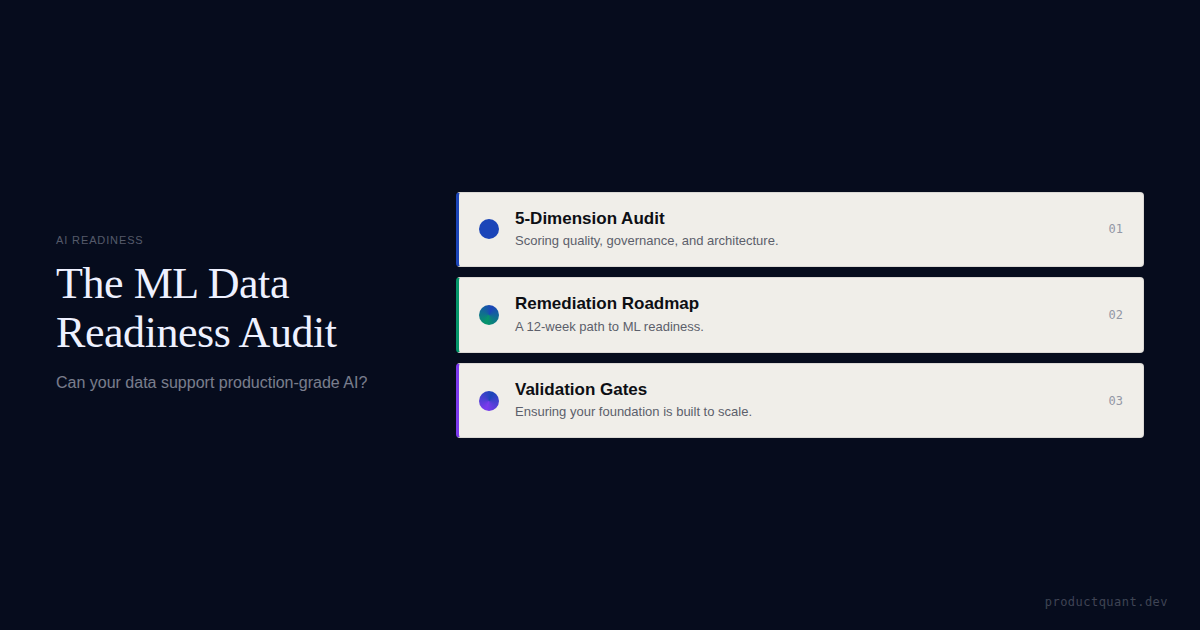
Gartner predicts 60% of AI projects will be abandoned. Run this 5-dimension ML readiness audit to check if your SaaS data supports production AI features.
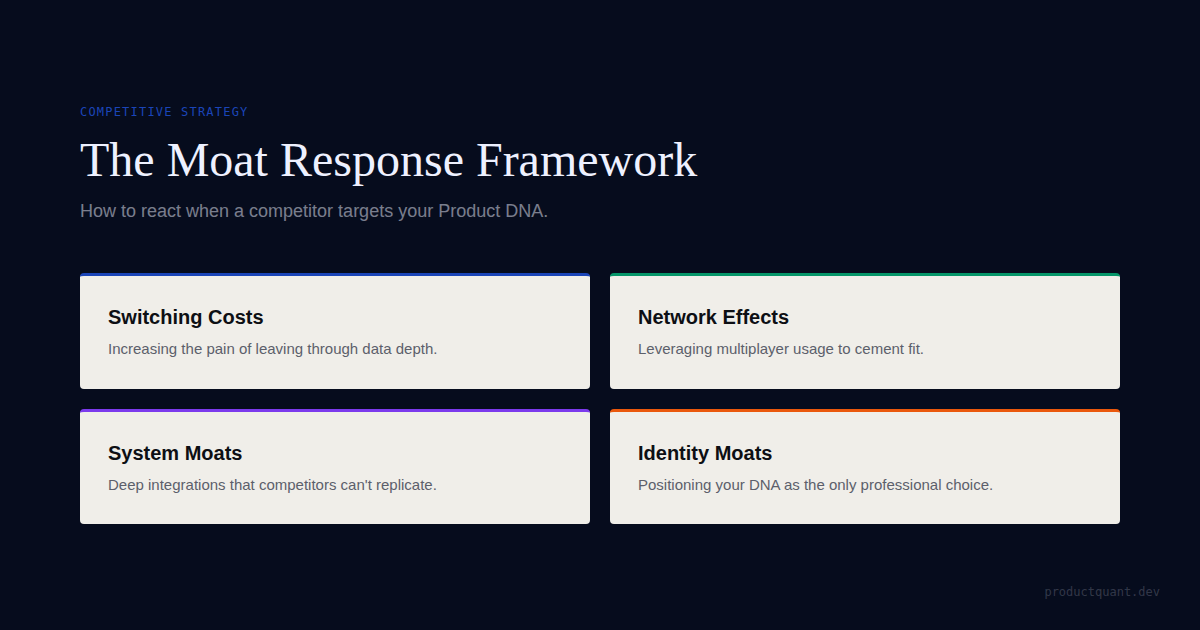
When a competitor gets aggressive, the right response depends on your retention moat. Learn to diagnose your competitive advantage and choose the right counter-move for your B2B SaaS company.
Many SaaS companies claim network effects without the user topology to support them. Network effects are structural, not aspirational.
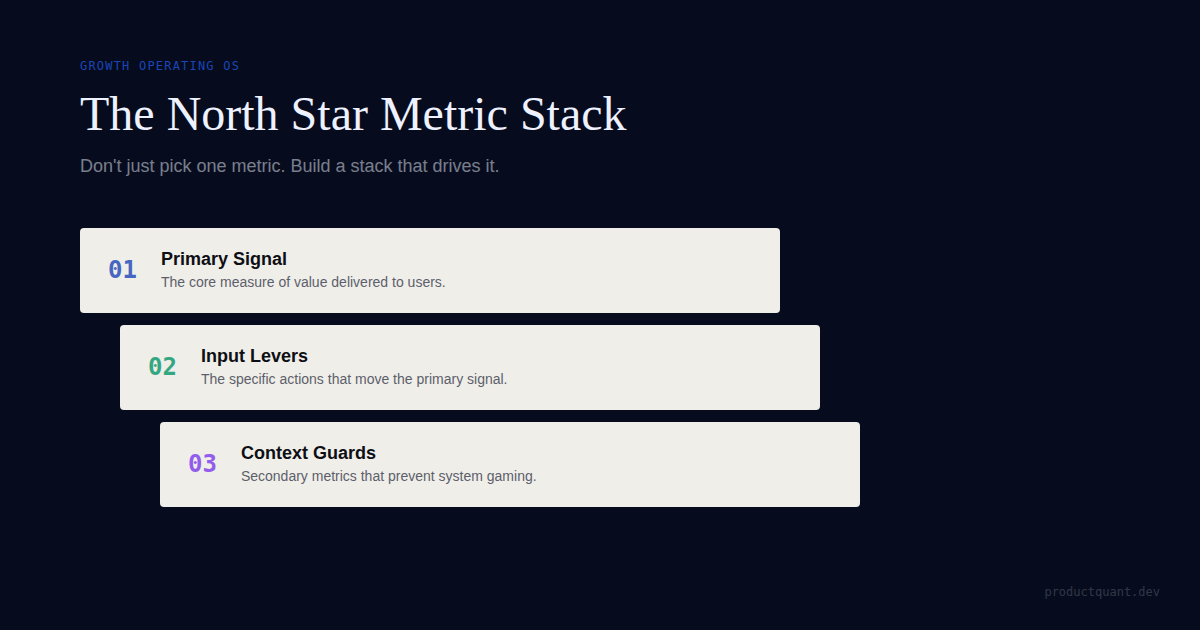
A North Star metric can align a team, but it cannot operate the system alone. Build a metric stack that connects high-level direction to daily product decisions in your B2B SaaS company.

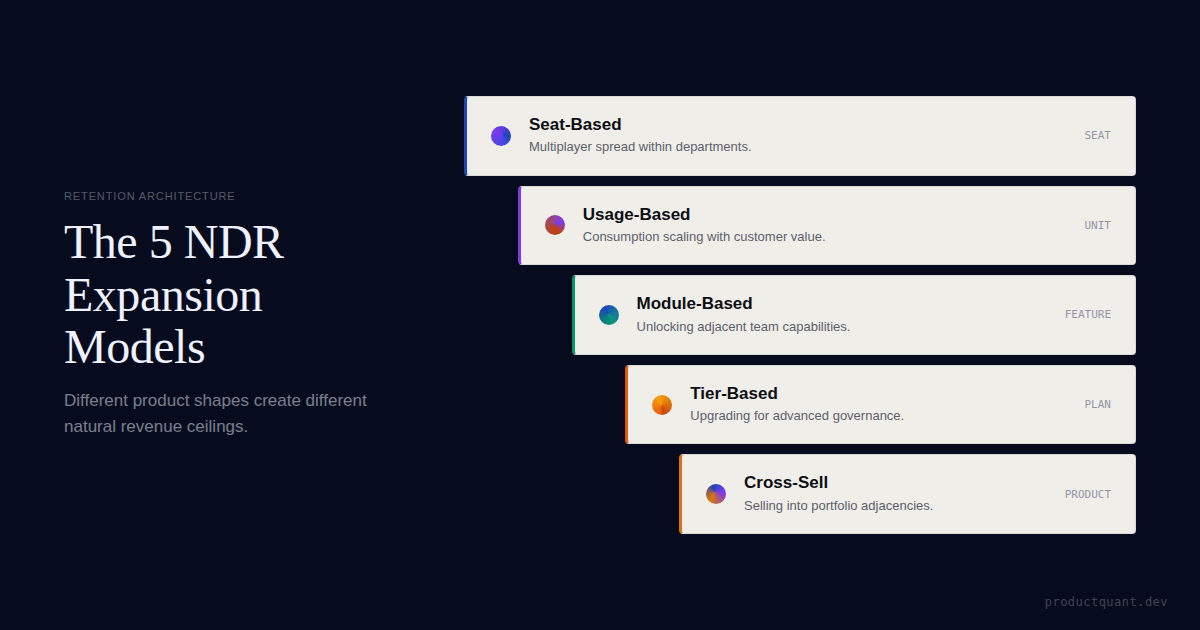
Segmented NRR benchmarks from SaaS Capital 2025: Enterprise 118%, Mid-Market 108%, SMB 97%. Plus the three-lever framework to close your gap.
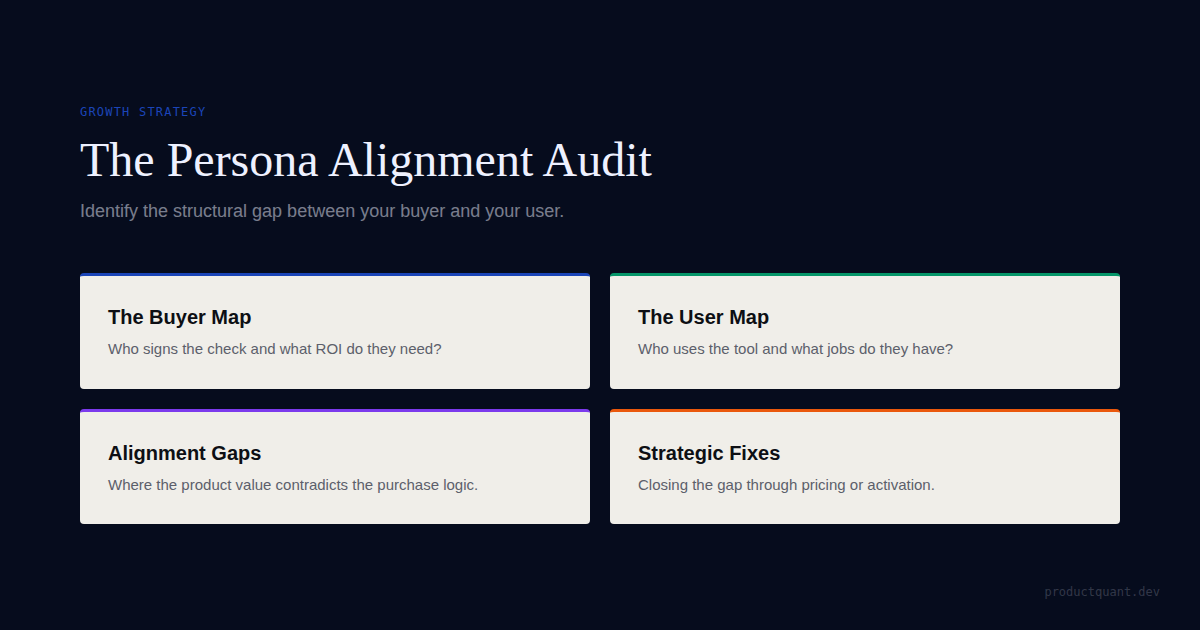
Most persona problems are validation problems, not writing problems. Audit your B2B SaaS personas against real customer data to ensure they drive product and go-to-market decisions.
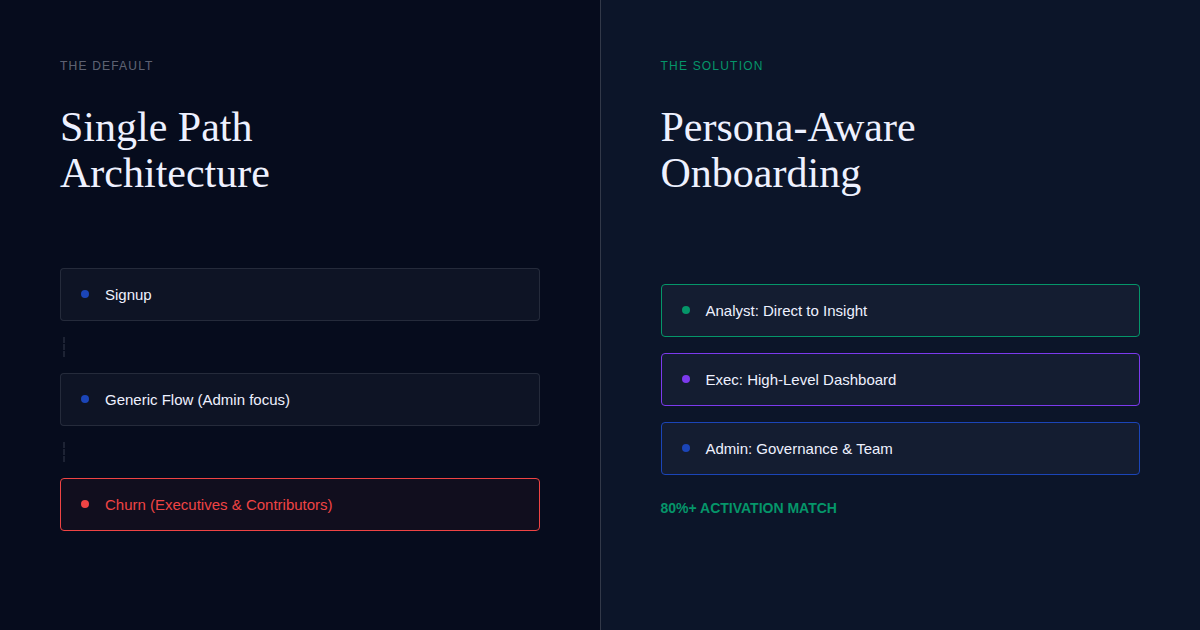
Most SaaS products ship a single onboarding path and wonder why activation rates plateau. The problem isn
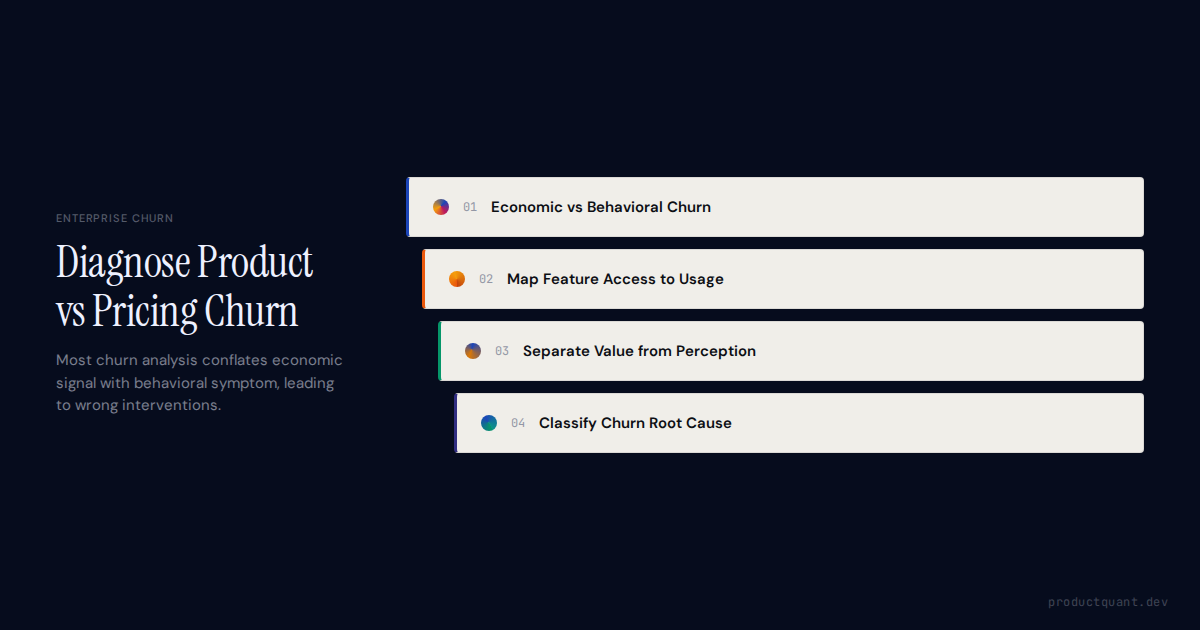
Enterprise churn can come from product gaps or pricing misalignment. Use plan-lens forensics to diagnose which is driving revenue loss and fix the root cause in your B2B SaaS.
Most B2B SaaS teams define activation as checklist completion. That metric looks good on dashboards and predicts nothing. Here
Many PLG audits overfocus on signup, onboarding, and upgrade screens. The harder question is whether the surrounding system actually supports PLG at all.
A practical guide to what a product-led growth consultant actually does in B2B SaaS, when to hire one, what a real engagement should include, and how to...

Stop tracking vanity metrics. Learn the technical PLG dashboard template for PostHog. Move beyond logins to HogQL-powered TTV, group-level retention, and PQL velocity.

Implement Product-Led Growth without breaking your revenue engine. A technical 12-week roadmap covering unified identity, activation milestones, PQL scoring, instrumentation, and expansion loops.

Dropbox, Calendly, and Zoom are all called PLG companies, but their viral loops, activation patterns, moats, and expansion logic are structurally different.
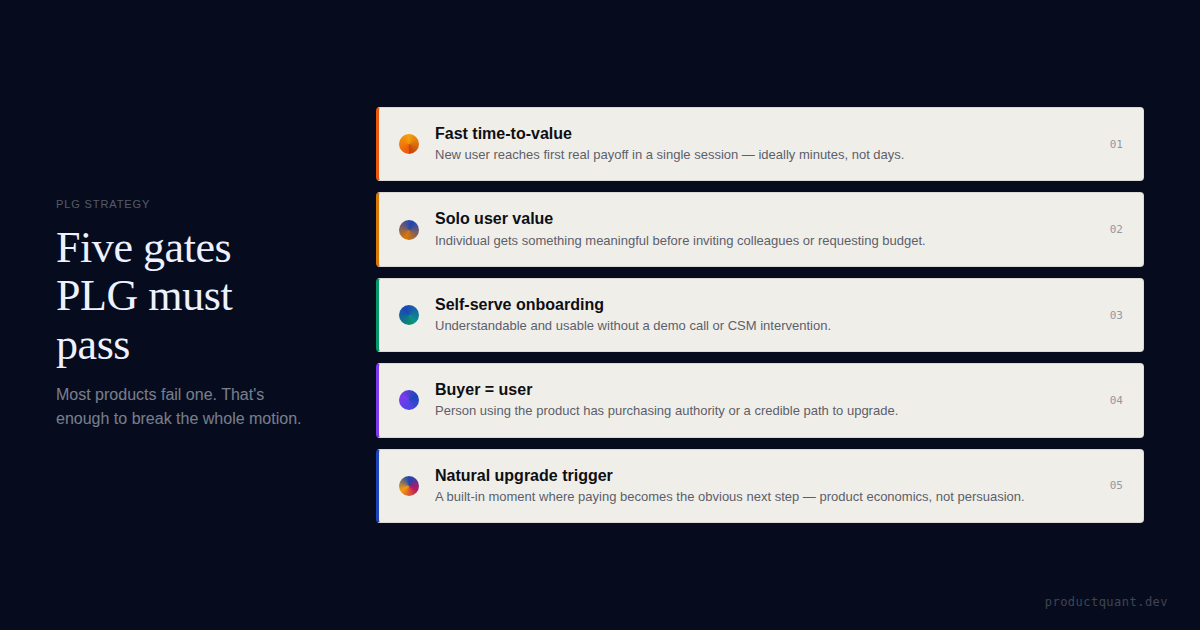
PLG is not a tactic you layer onto any SaaS product. It only works when buyer, user, activation, and upgrade mechanics line up structurally.

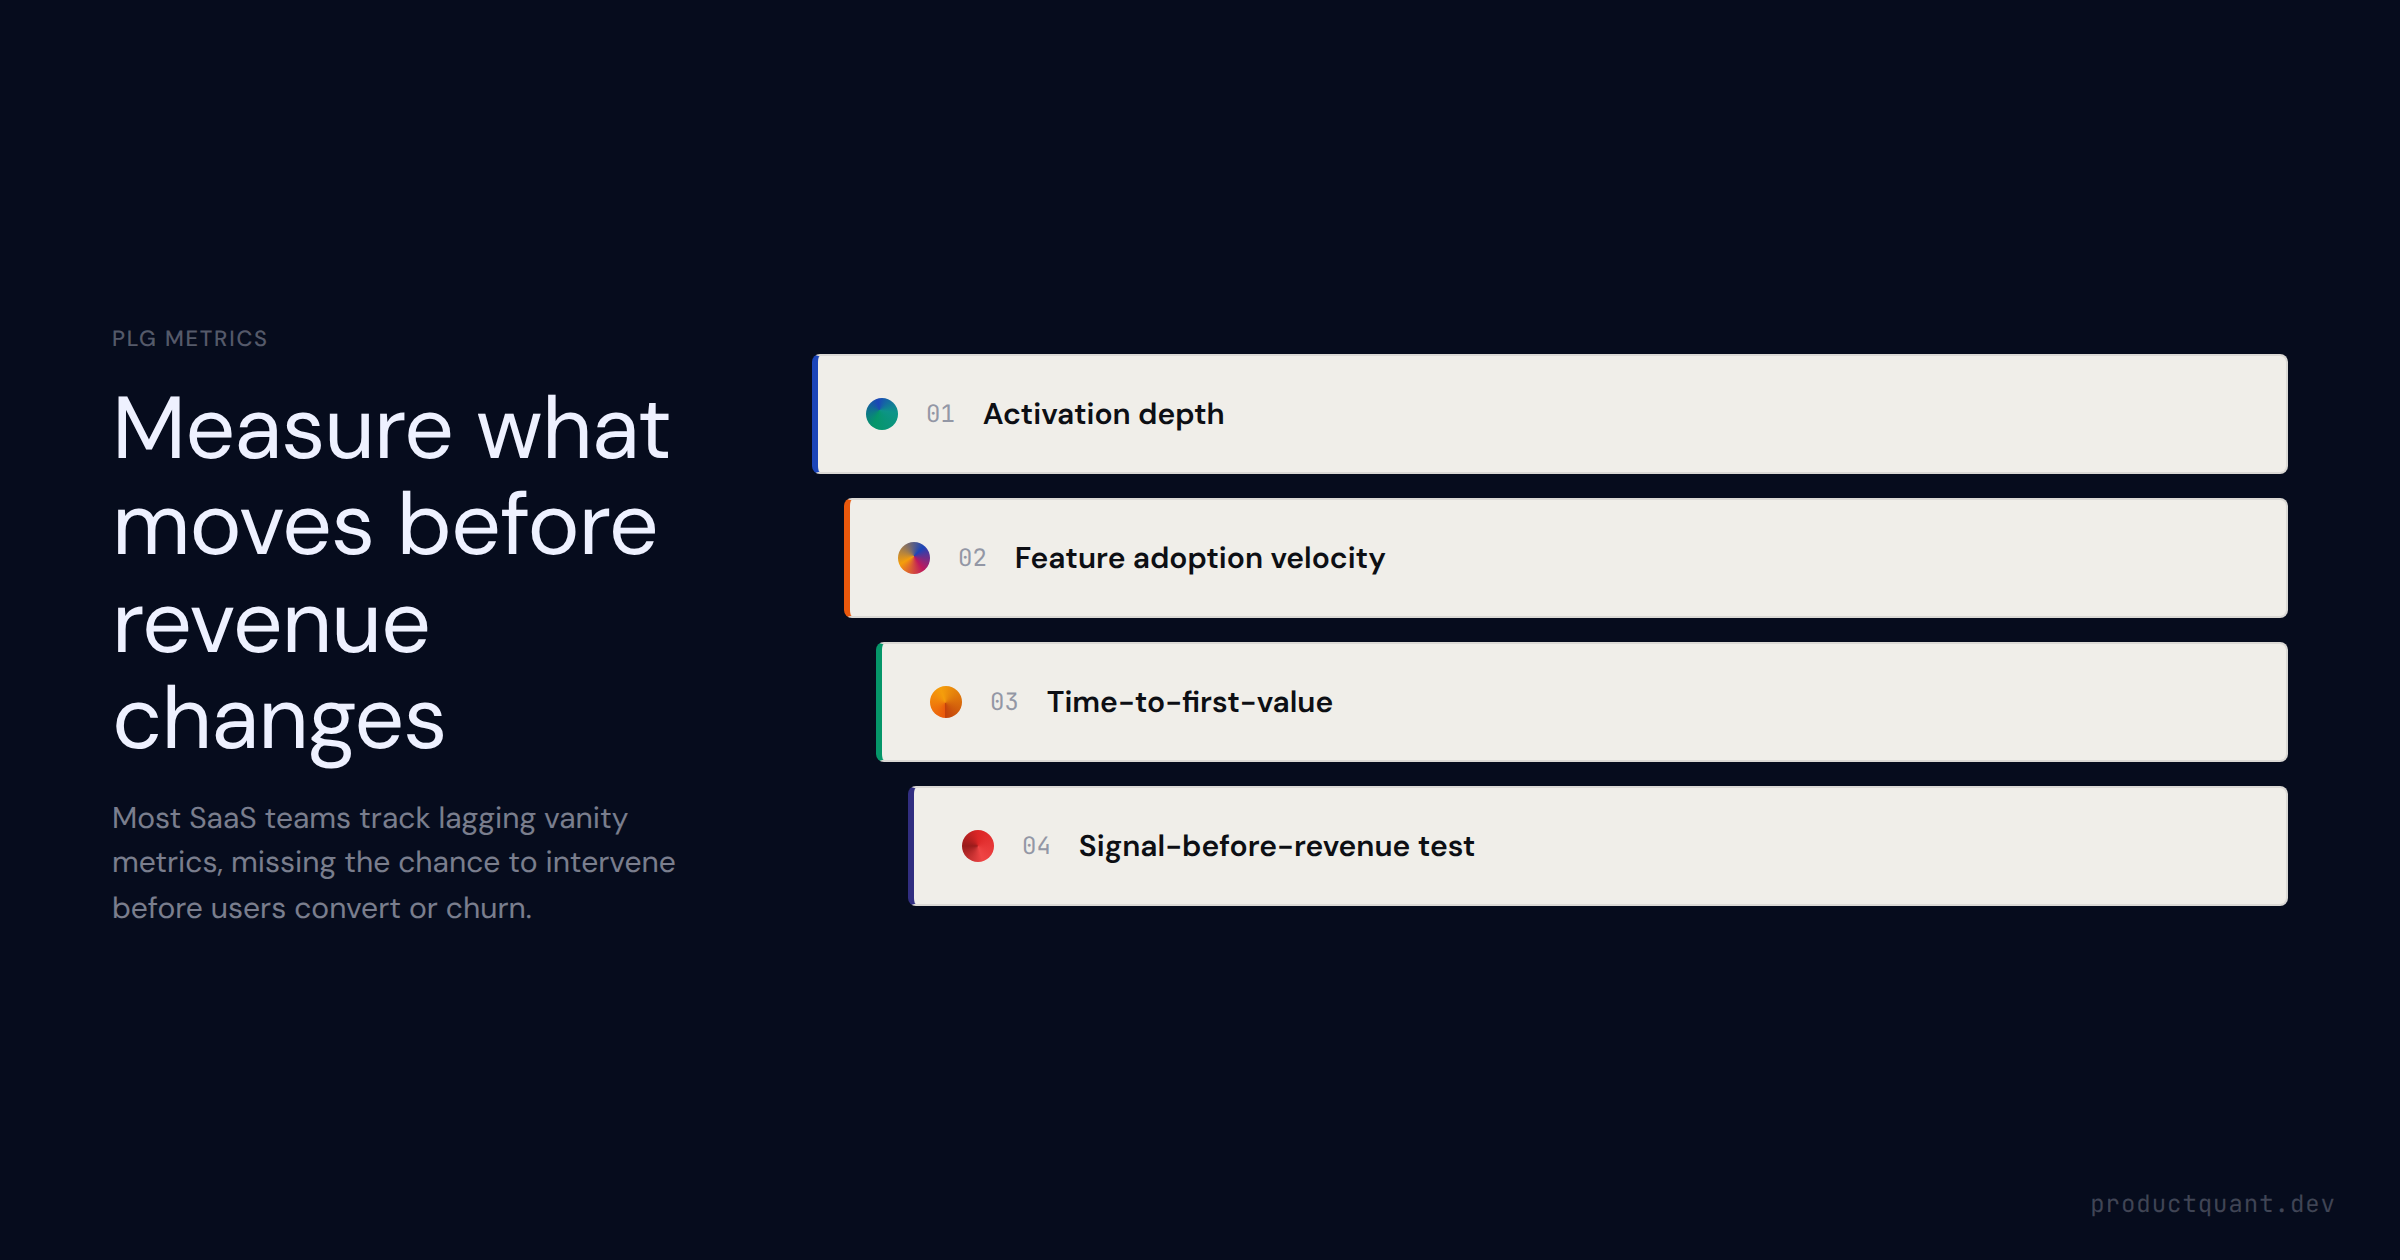
Most B2B SaaS teams track the wrong PLG metrics. Here are the 8 metrics that actually predict growth: activation rate, time-to-value, PQLs, and more.

Master B2B SaaS onboarding. A technical checklist for building zero-friction entry, intent-based routing, and behavioral activation milestones in 2026.

The median B2B SaaS trial-to-paid conversion rate is 8% — meaning 92% of your signups generate no revenue. This guide shows how to calculate PLG ROI, choose the right pricing model, and build a PQL system that closes the
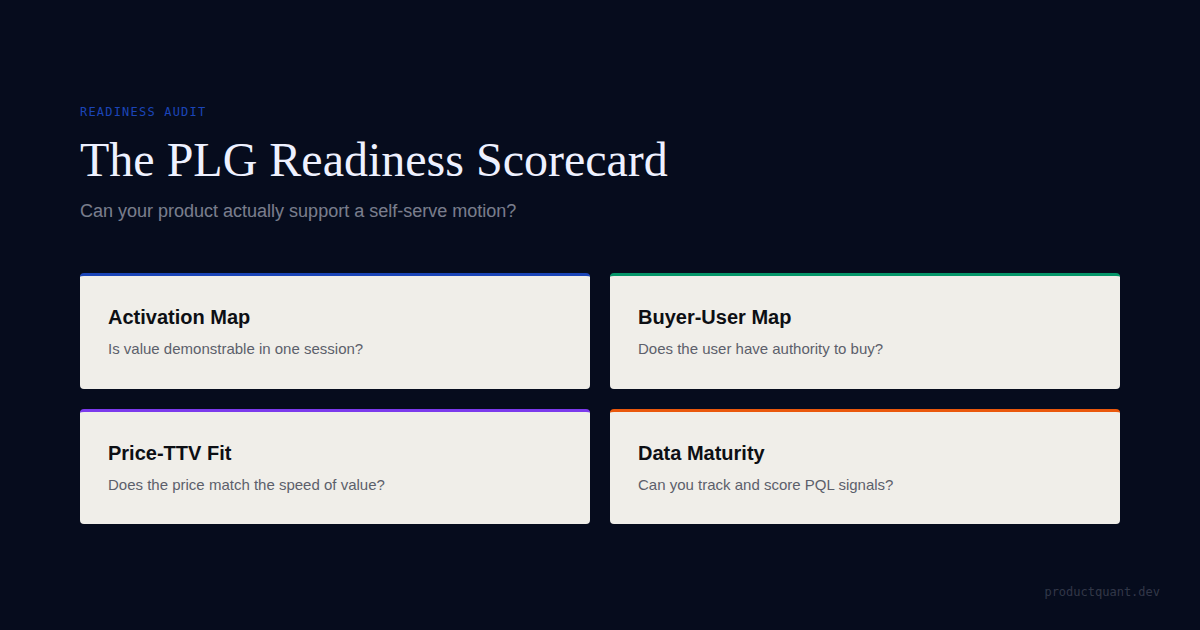
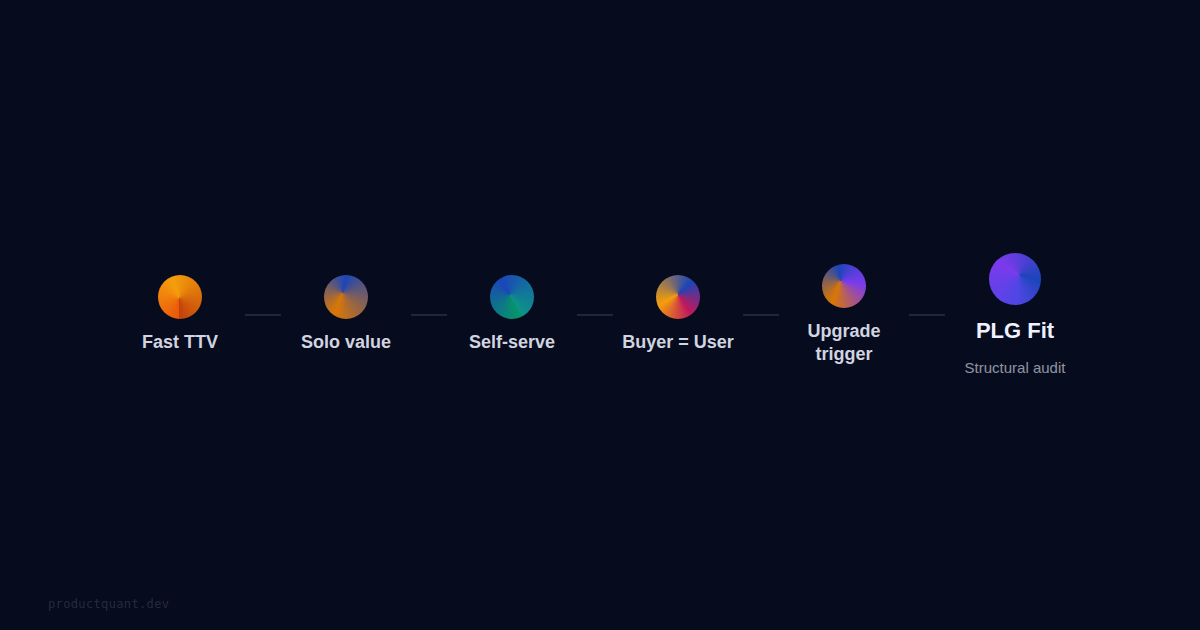
A practical PLG scorecard for B2B SaaS teams assessing product-led readiness across self-serve capability, activation, pricing, buyer-user fit,...

PLG strategy differs by funding stage. Series A focuses on activation (20-40%), Series B on expansion (NRR 120%+). Complete benchmarks and tactics.
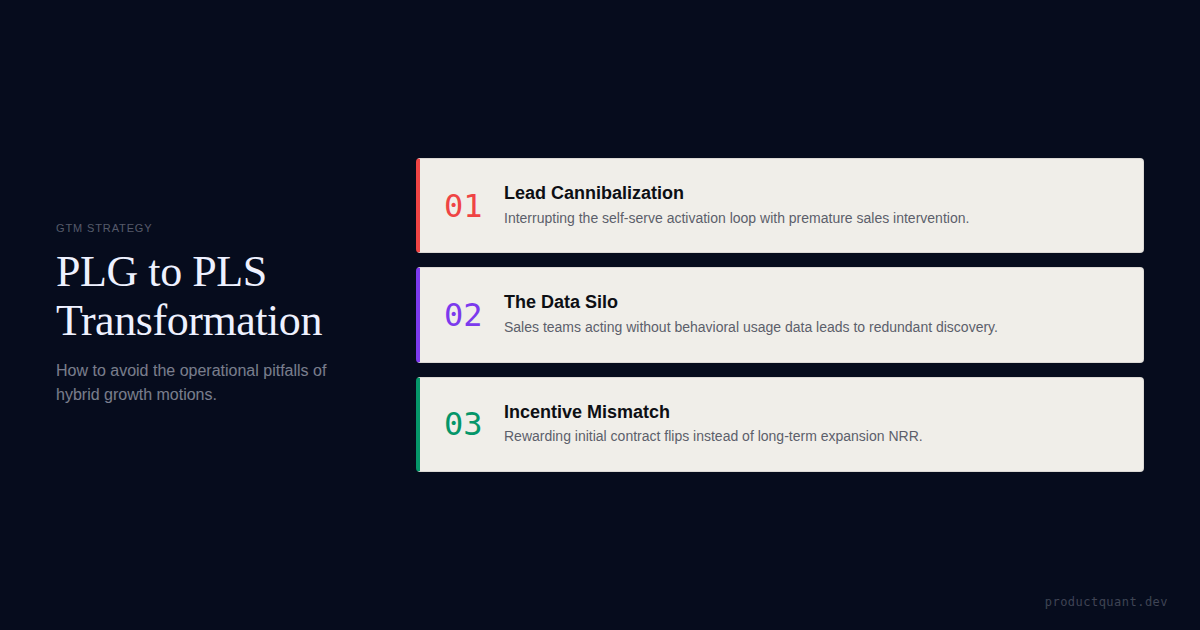
Transitioning from Product-Led Growth to Product-Led Sales is the biggest GTM challenge of 2026. Learn the 3 pitfalls that cannibalize revenue.

PLG isn
PMF is not a moment. It
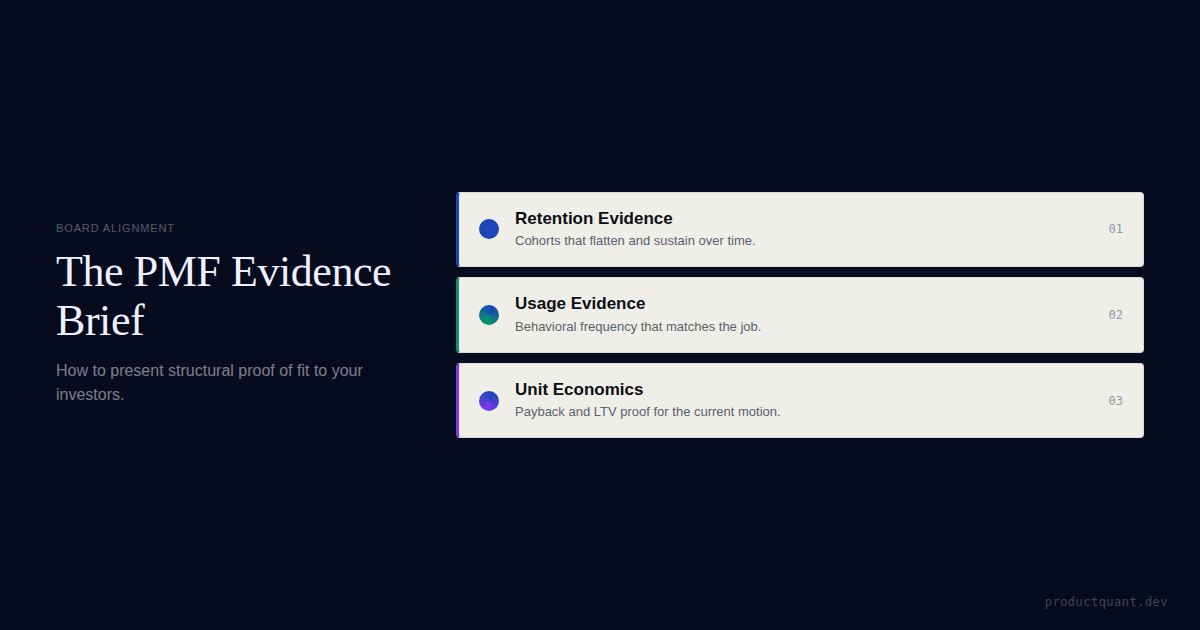
"We have product-market fit" is a claim. A PMF Evidence Brief is the documentation that supports it. What investors actually look for, and how to build the brief from product usage data, customer data, and sale
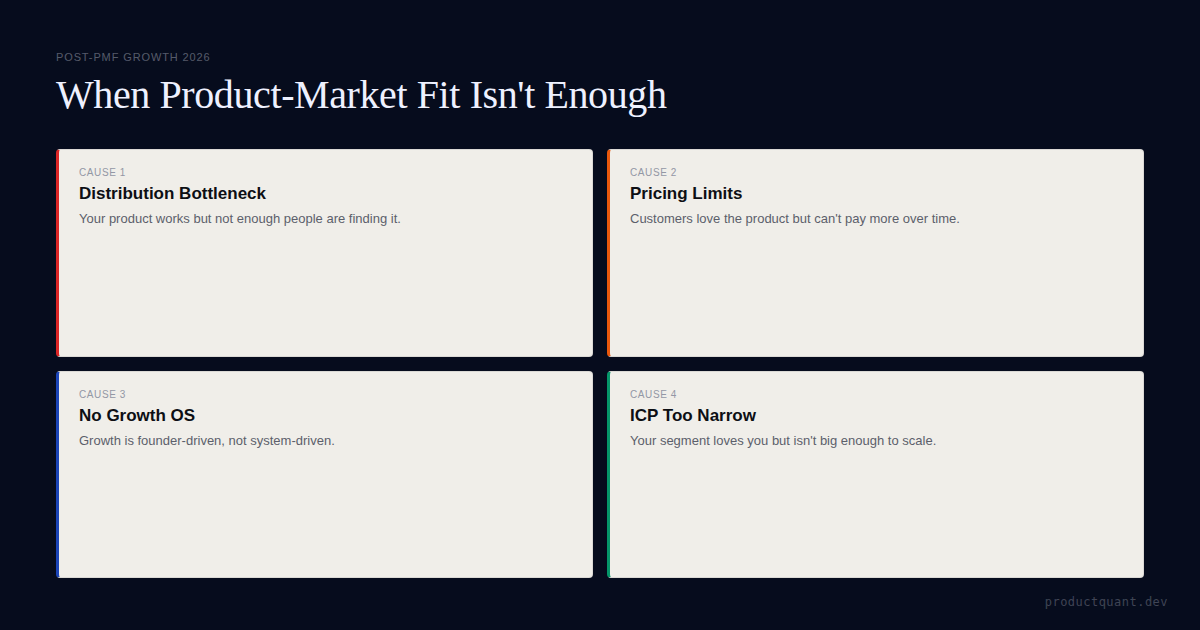
PMF was the easy part. Many SaaS companies have PMF but can
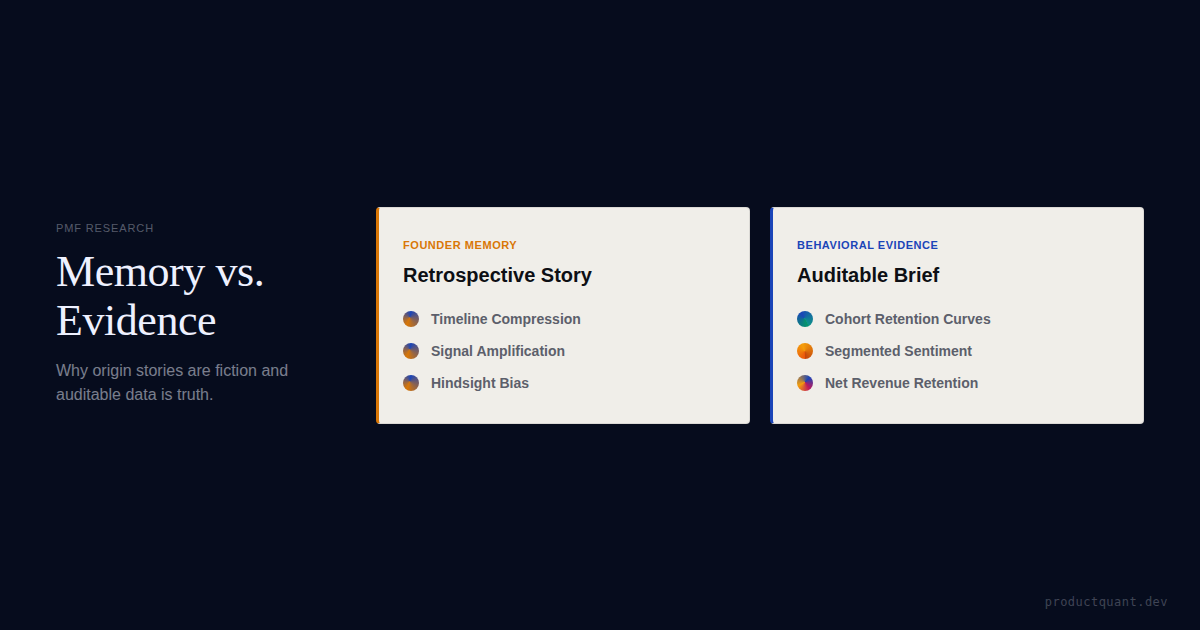
The PMF origin stories you read are fiction — not because founders lie, but because memory rewrites history. The case for evidence-based PMF documentation.

Most JTBD frameworks, ICP definitions, and feature priorities are built from what the founding team remembers hearing. The gap between recalled and actual is almost always larger than expected.
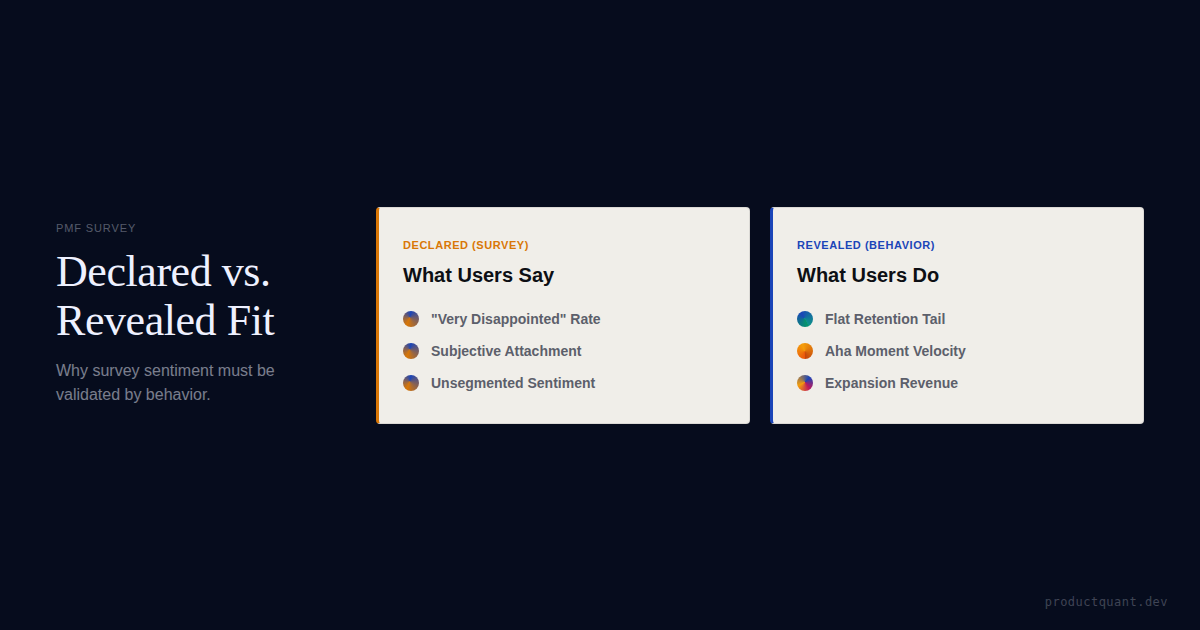
The Sean Ellis test is the most widely used PMF metric — and the most widely misused. How to run it right and what it actually tells you.

Customer interviews capture what buyers are willing to share when prompted. Sales call recordings capture what they say when they think they
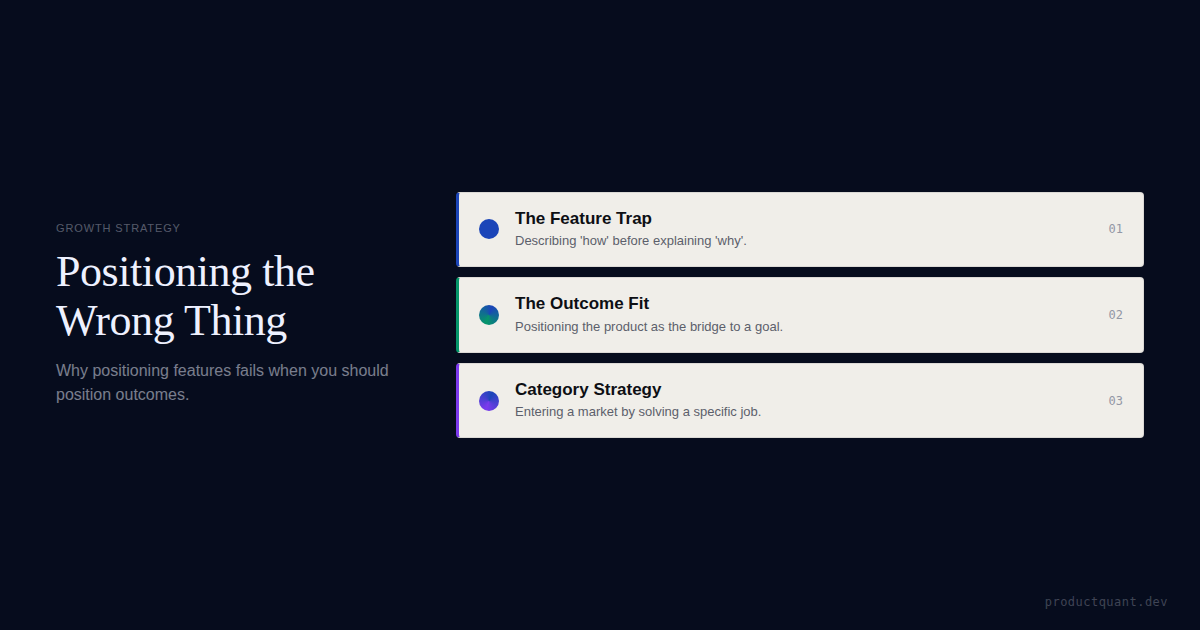
Many positioning exercises fail before they start because the team never decided whether it was positioning a product, a product line, a platform, or a company.
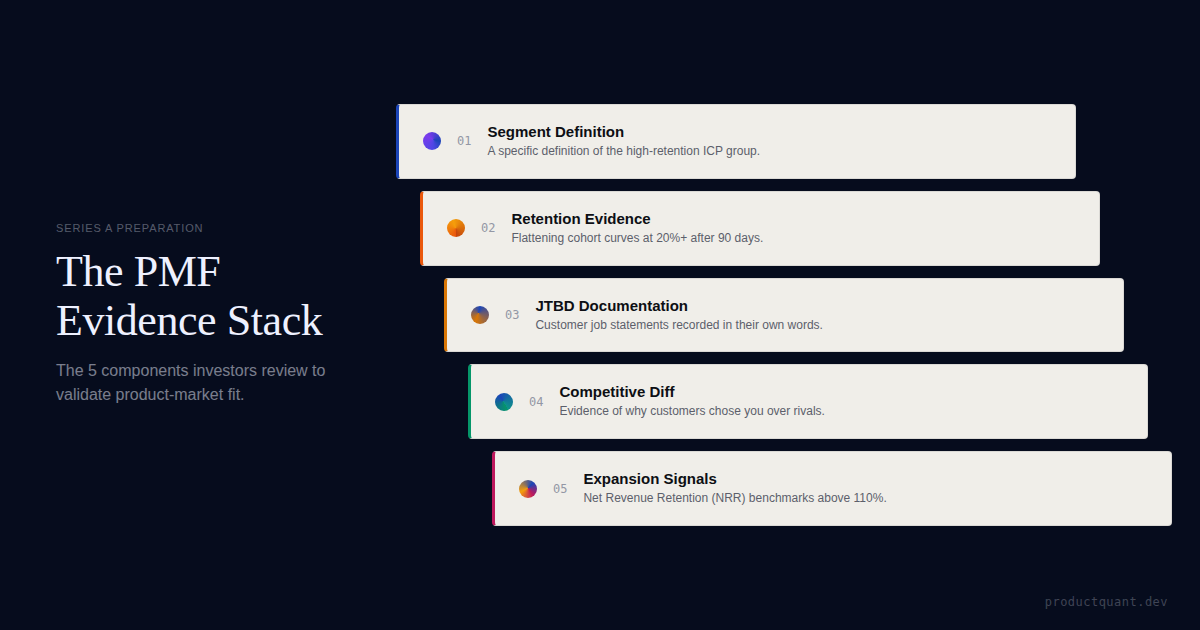
Investors don
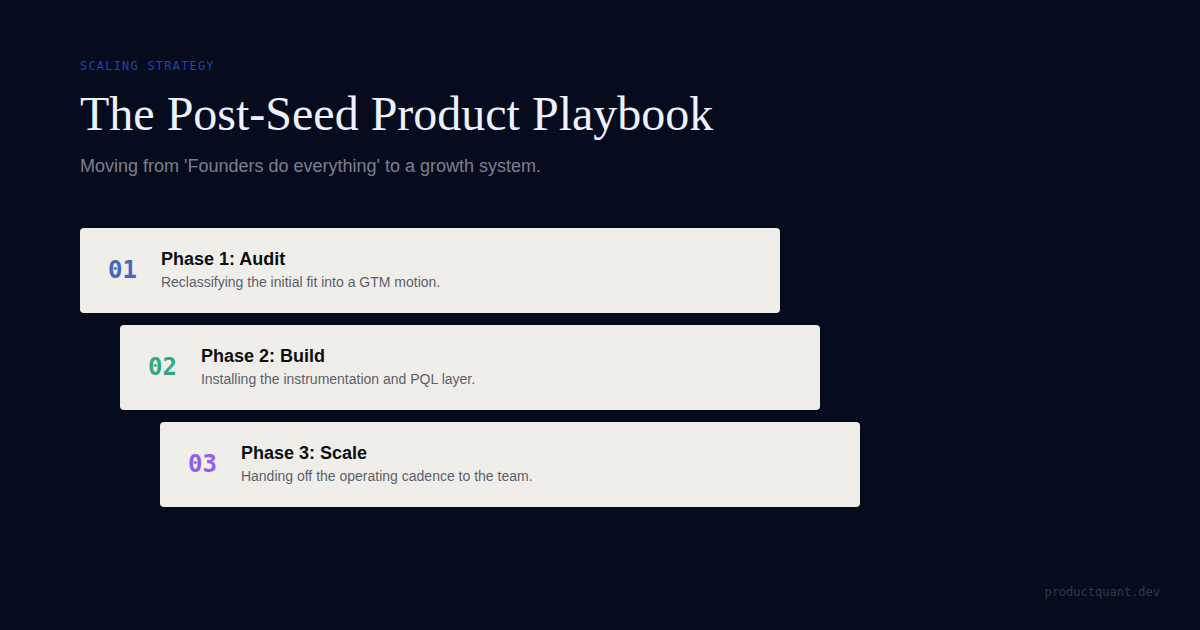
A practical post-seed product playbook for B2B SaaS covering activation, instrumentation, positioning clarity, retention, and the operating cadence needed...

Master PostHog Autocapture. Technical guide to setting up snippets, reverse proxies, and autocapture exceptions for clean, reliable SaaS analytics in 2026.
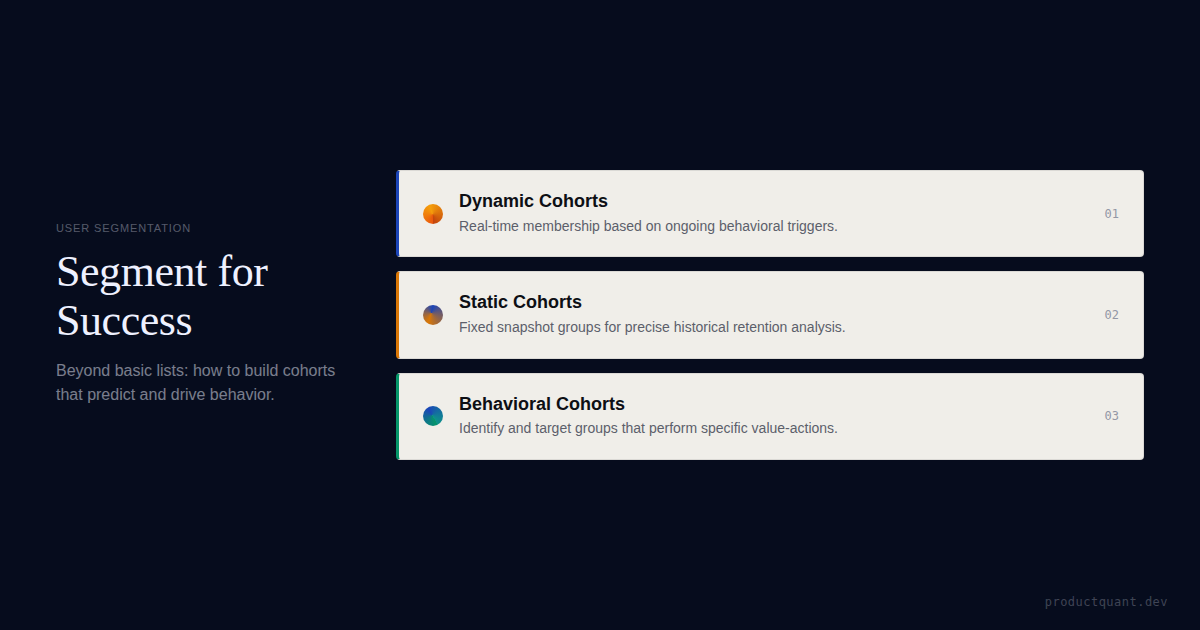
Cohorts are the most powerful feature in PostHog — and the most underused. Here

These 5 PostHog dashboard templates cover activation, retention, feature adoption, revenue signals, and experimentation so B2B SaaS teams can answer the...
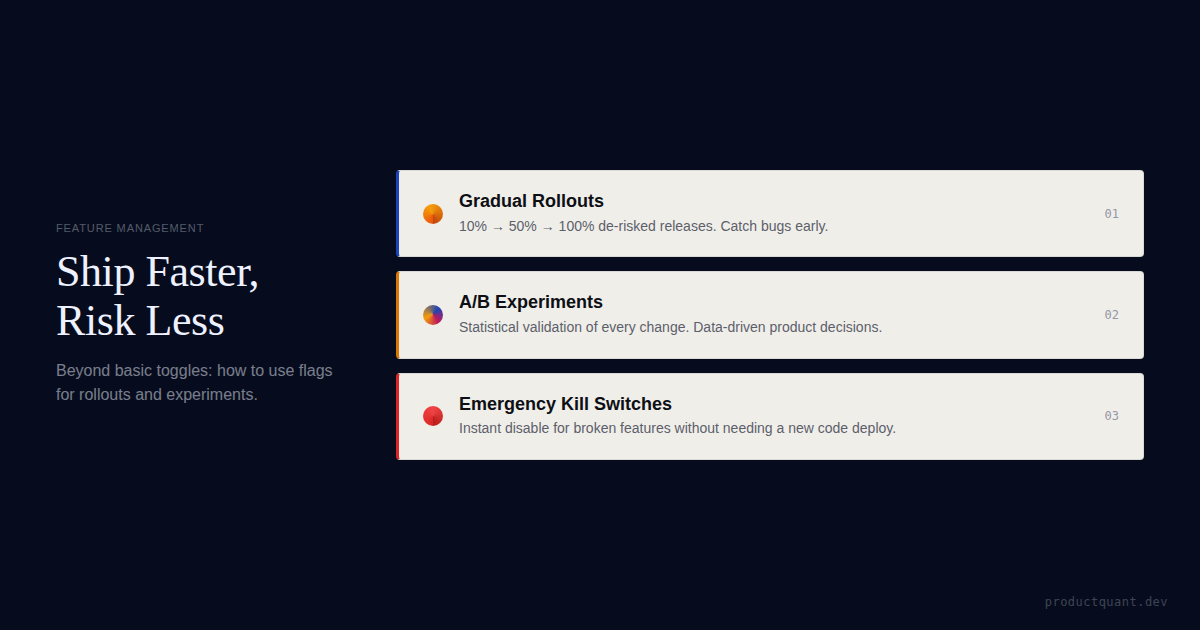
Feature flags guide: the bridge between product strategy and safe execution. PostHog feature flags, rollouts, A/B testing, and kill switches.

Build a product-led growth engine in PostHog. Technical guide to attribution persistency, PQL scoring engines, and reverse ETL workflows for B2B SaaS.
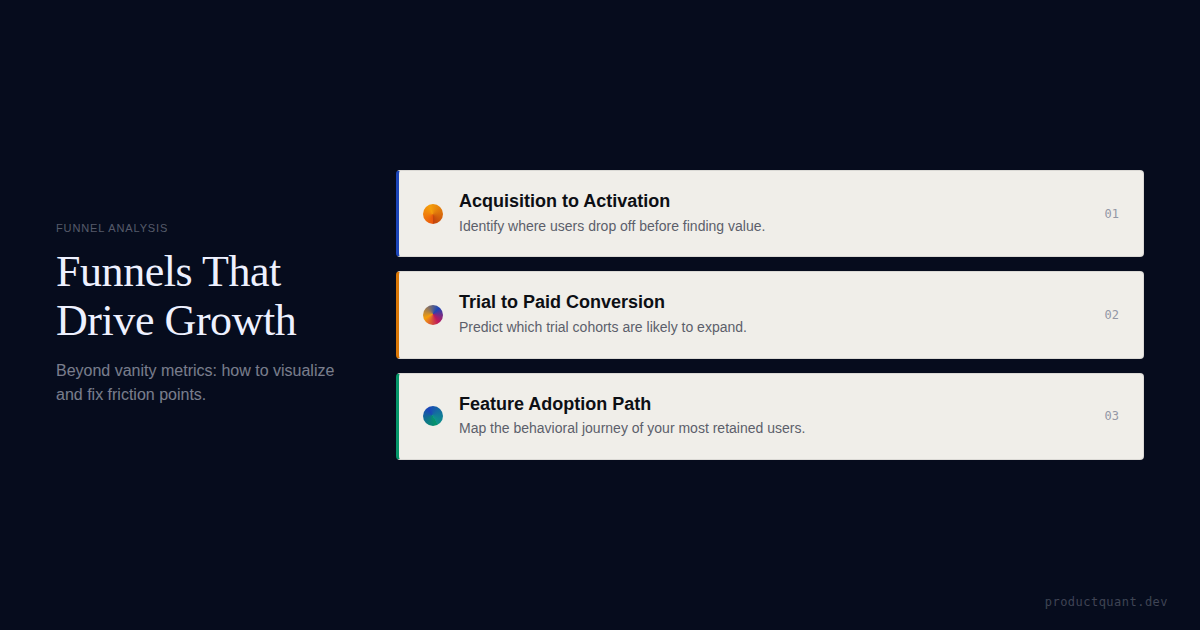
Funnels don

PostHog implementation costs range from $0 to $25,000+ depending on scope. Here
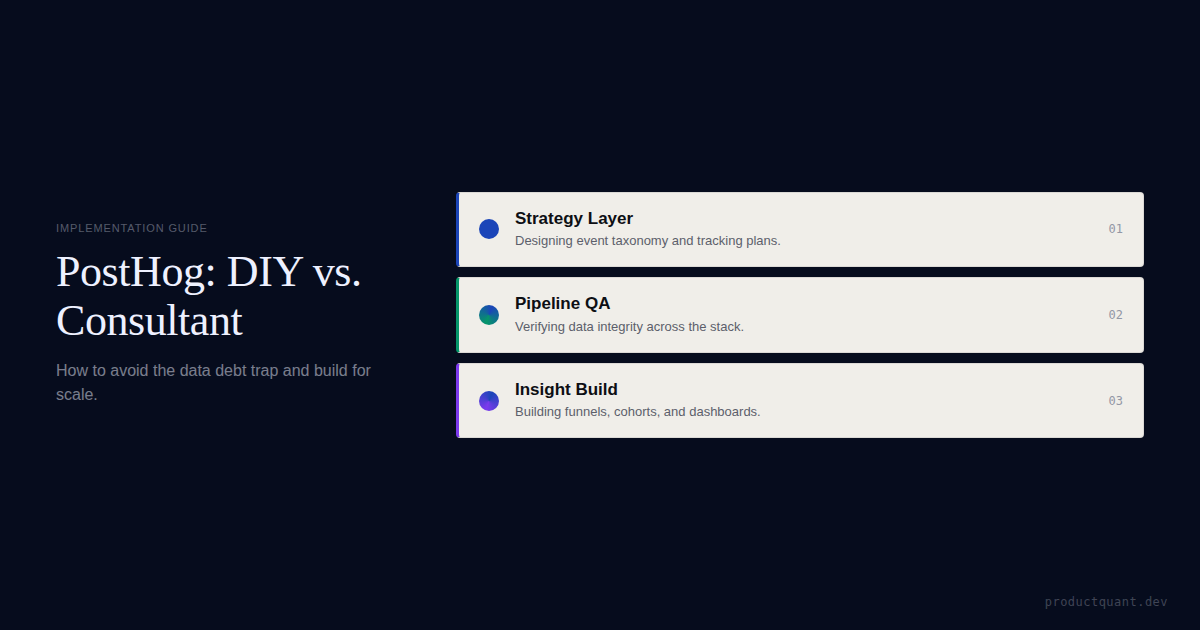
Compare DIY vs. hiring a PostHog consultant. Detailed breakdown of timelines, costs, and strategic implementation steps for B2B SaaS teams.

PostHog collects PII and PHI from more places than most teams realise: the distinct_id, autocapture, raw IP, GeoIP, URL patterns, JWT tokens, session recording, console logs, and backend events. A checklist for each.
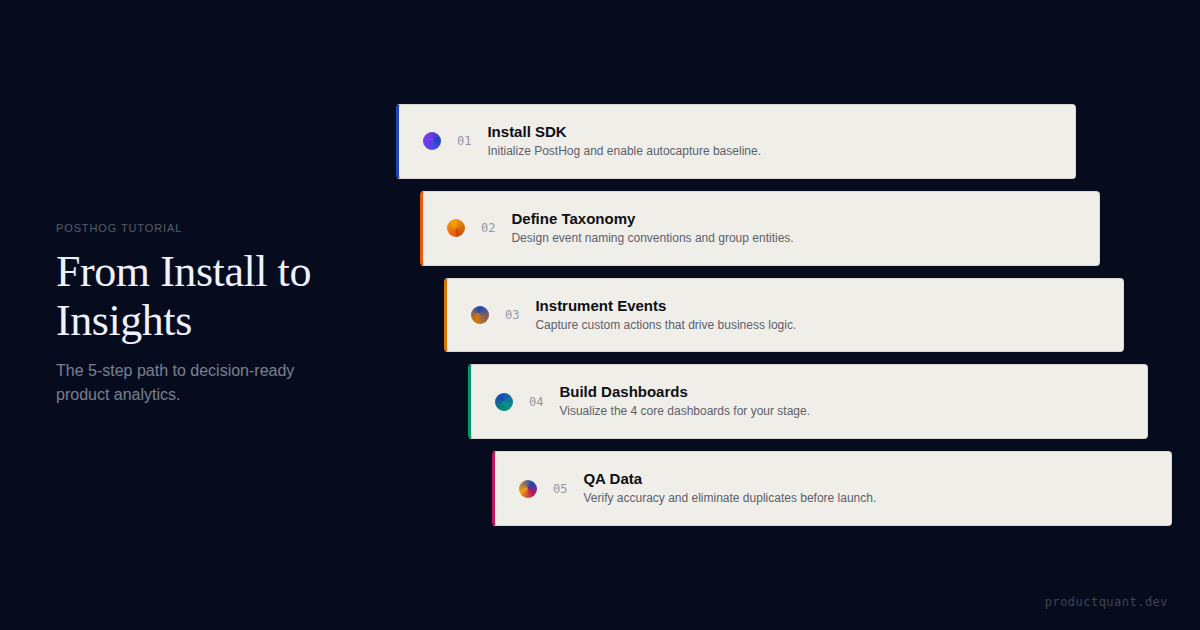
A practical PostHog setup guide for B2B SaaS: event taxonomy, group analytics, first dashboards, setup checklist, and the tracking plan ProductQuant uses...
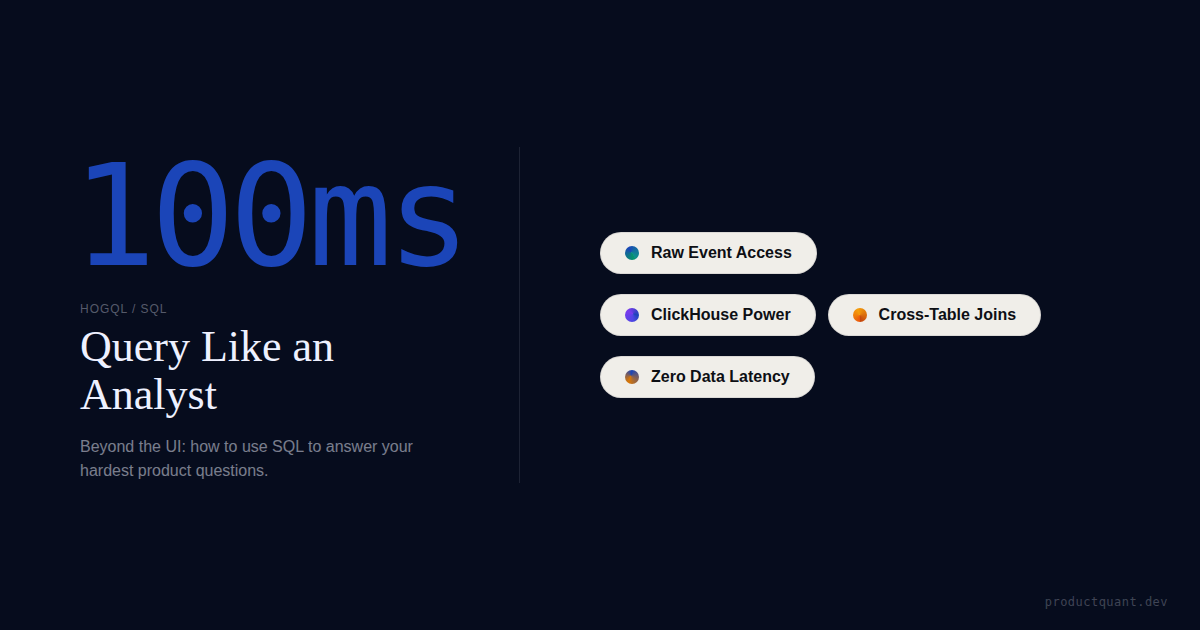
The PostHog UI answers 80% of questions. HogQL answers the other 20% — the ones that actually move revenue. Five query patterns every analyst needs, with t

A practical PostHog tracking QA checklist for B2B SaaS teams: verify properties, identify(), group analytics, frontend vs server-side events, duplicates,...
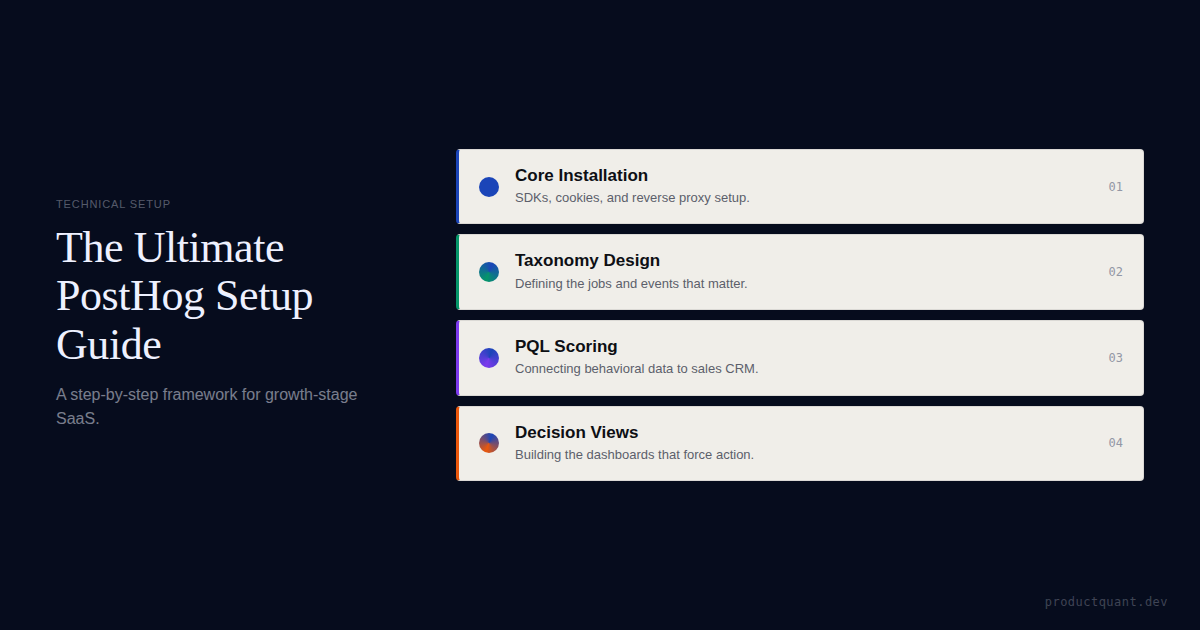
PostHog is the easiest analytics tool to install and the hardest to use well. This guide covers everything from account setup to your first business decisi

Choosing between PostHog and Amplitude? This in-depth guide compares both platforms across Seed, Series A, and Growth stages, covering pricing, features, and migration for your SaaS.

Real pricing data, data retention, HIPAA, SQL access, and group analytics — a practitioner
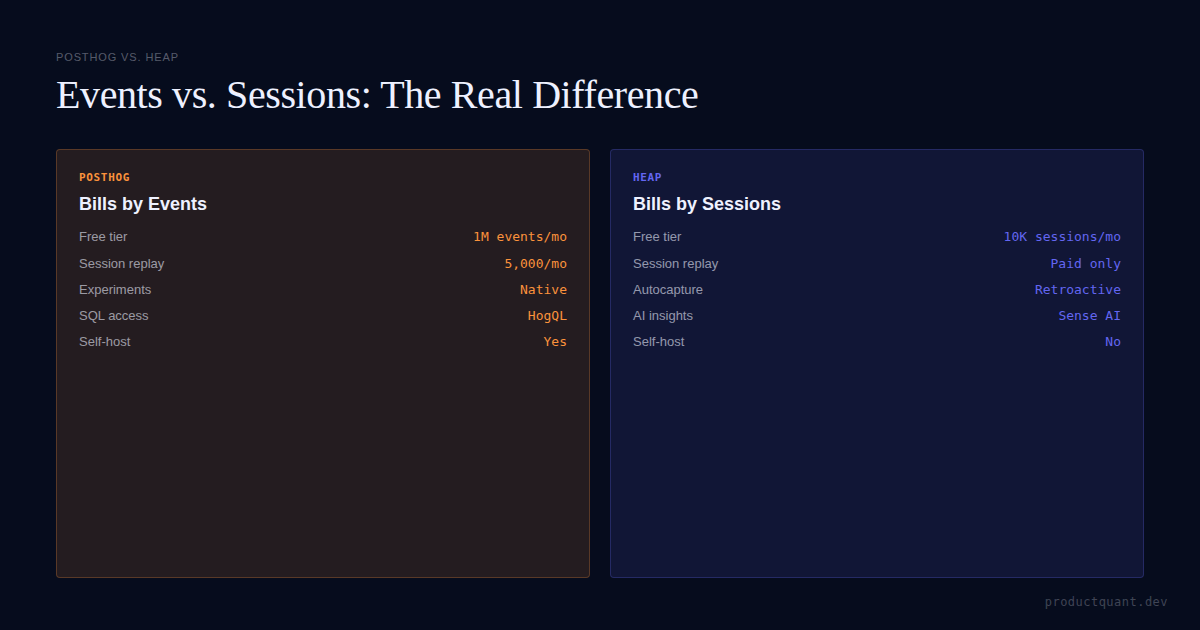
PostHog bills by events. Heap bills by sessions. The billing model drives what you measure, what you skip, and renewal surprises.
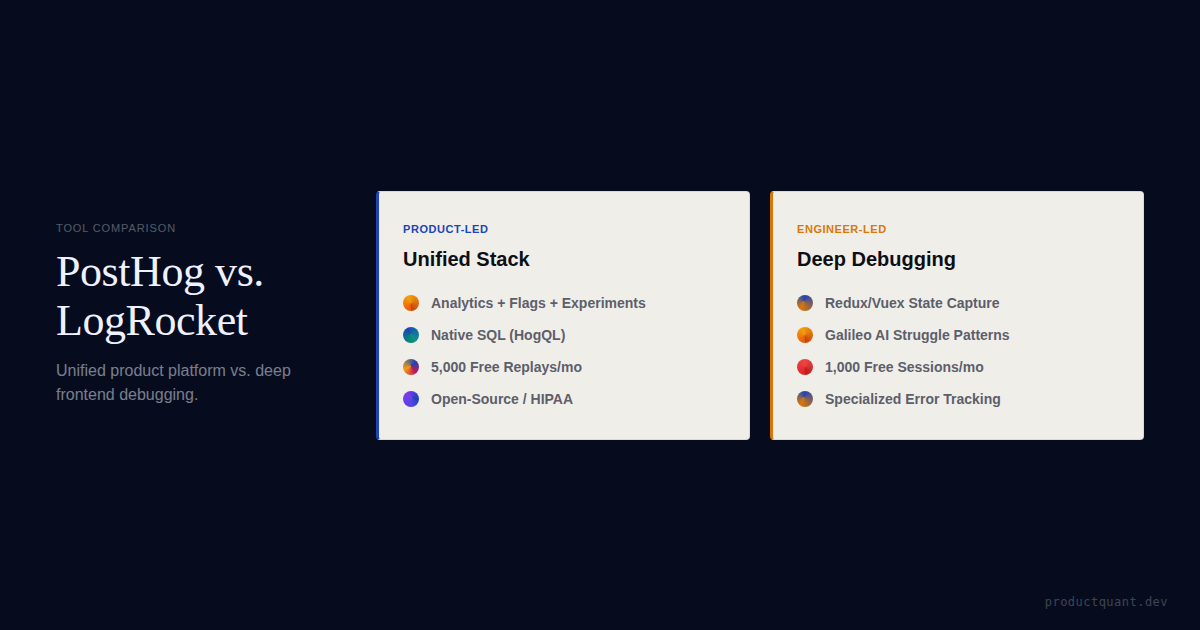
Both tools do session replay. Only one does product analytics, experimentation, and feature flags. Complete comparison with pricing and G2 user ratings.

Three things that actually matter when choosing between PostHog and Mixpanel: data retention (7 years vs 2 years), pricing transparency, and SQL access via HogQL.
Side-by-side comparison of PQ Intel and 6sense for B2B sales intelligence. Feature comparison, pricing breakdown, signal architecture, and who should choose which.
Most B2B SaaS churn models predict the wrong thing, too late, with signals nobody acts on. Here is what to build instead.
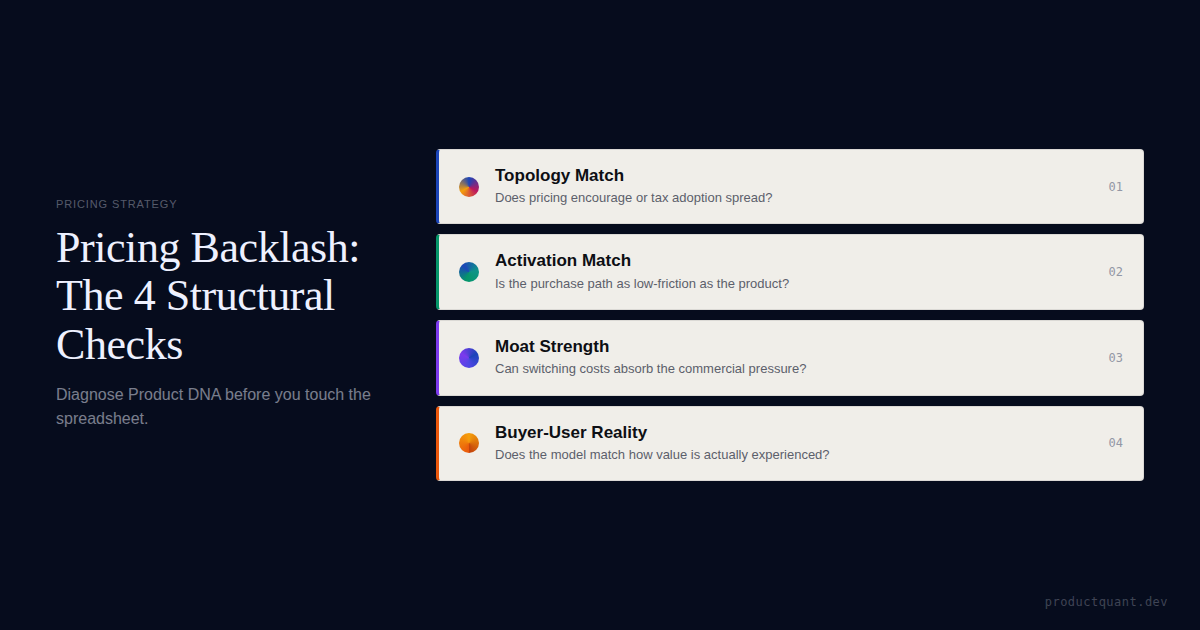
Pricing backlash usually starts when the new model contradicts topology, activation, moat strength, or buyer reality instead of matching product DNA.
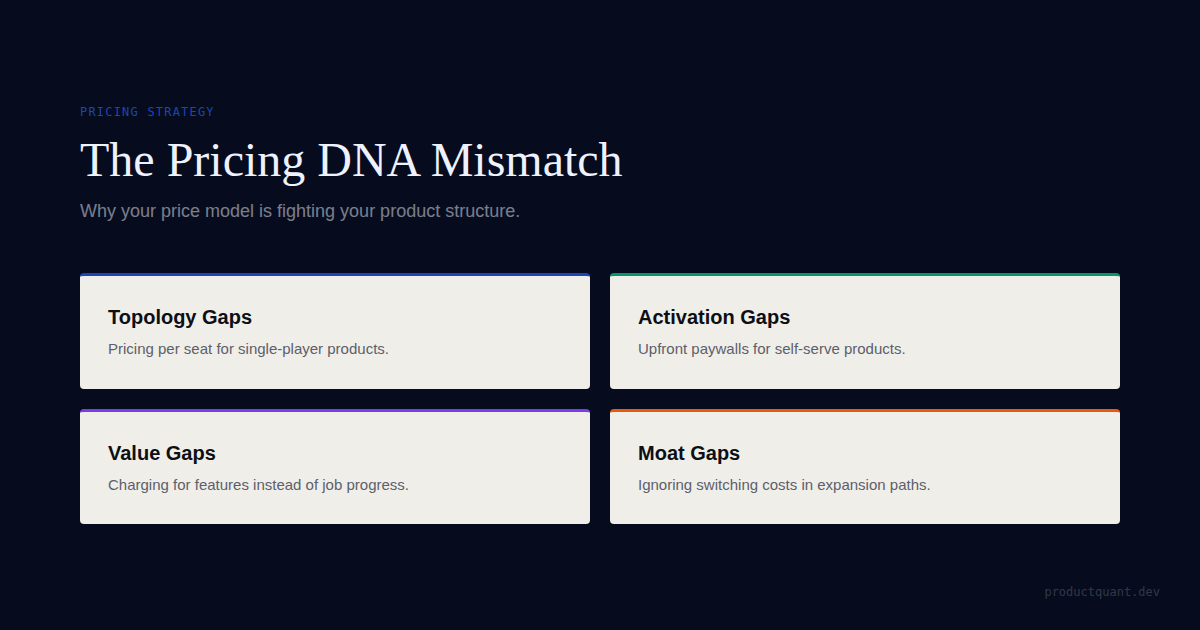
Pricing backlash usually starts before the launch. It happens when a pricing change contradicts topology, activation, moat strength, or buyer reality.

A practical framework for testing B2B SaaS pricing without creating customer backlash, buyer confusion, or noisy results you cannot trust.
Pricing and growth motion often get designed in separate meetings. When they clash, expansion stalls, forecasting breaks, and the funnel gets heavier.
Per-seat pricing on a single-player product is flat-rate with extra steps. Here
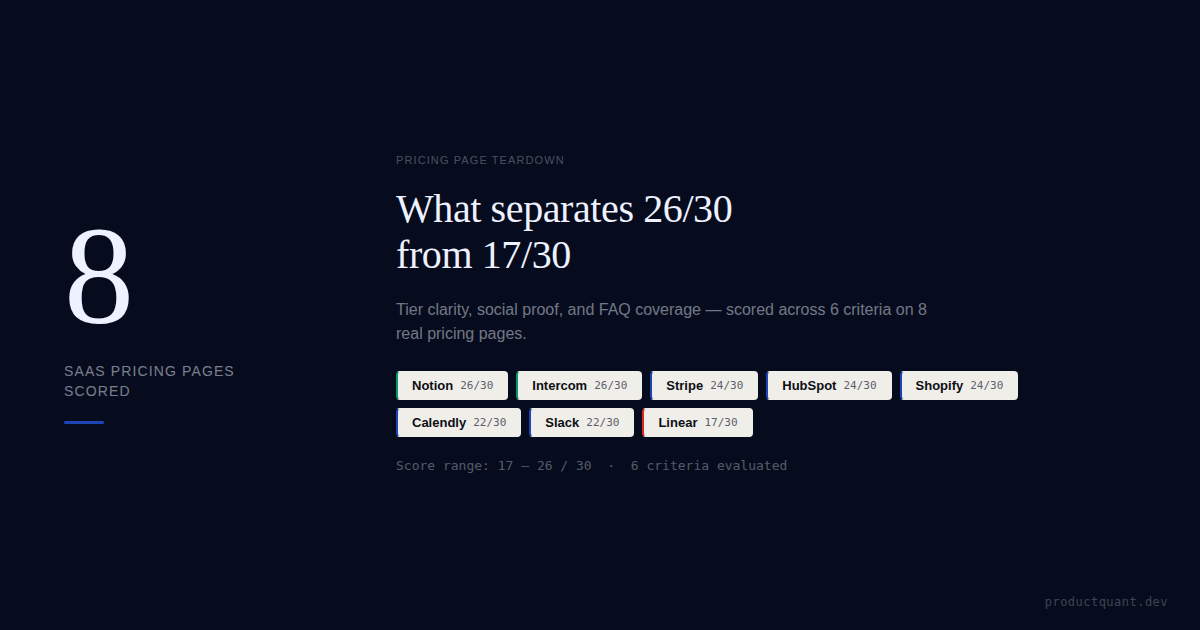
Pricing page teardown: Notion, Stripe, Calendly, Linear, Slack, Intercom, HubSpot, Shopify. What works, what doesn
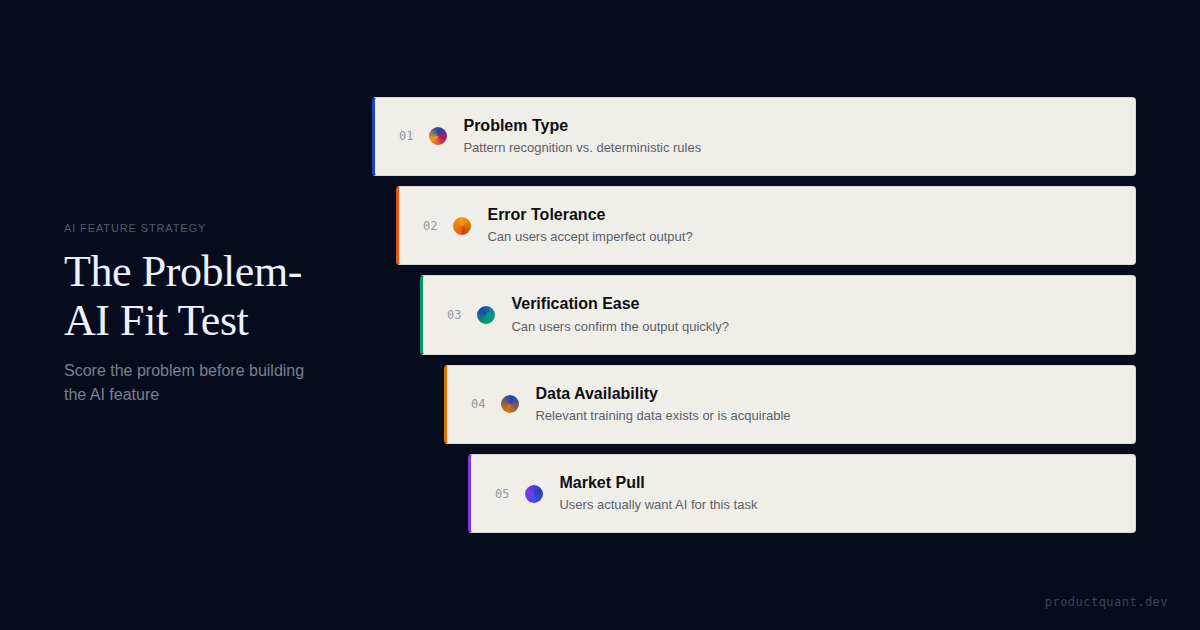
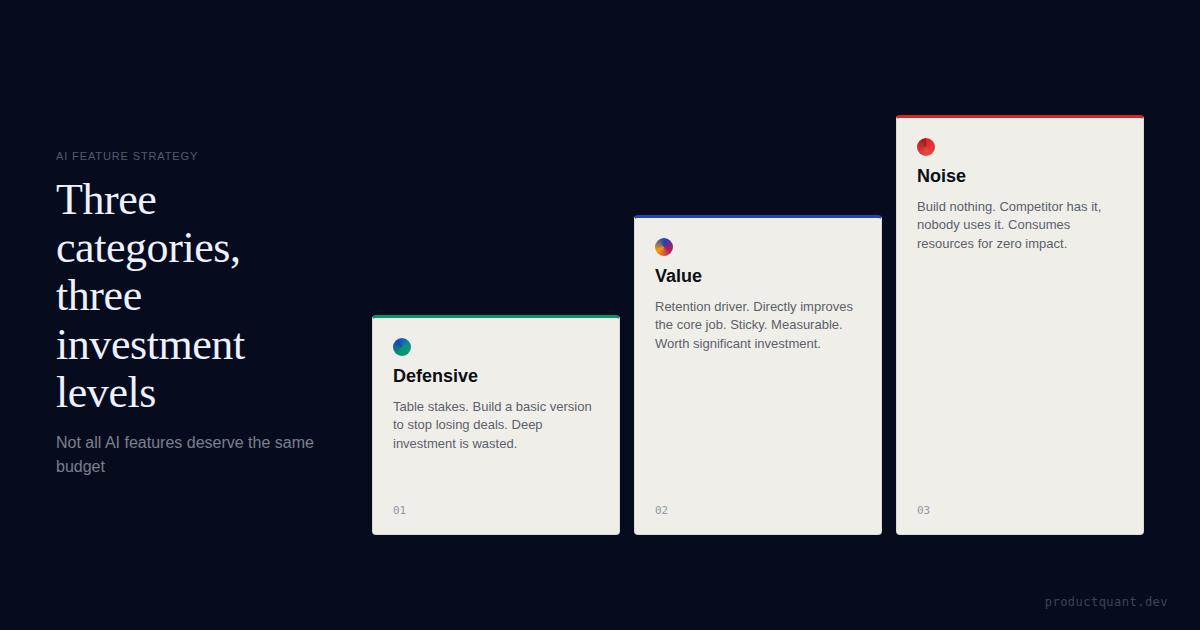
A practical framework for deciding whether a SaaS AI feature deserves to exist before you waste time on model choice, launch plans, or pricing debates.

81% of analytics implementations contain errors. Here
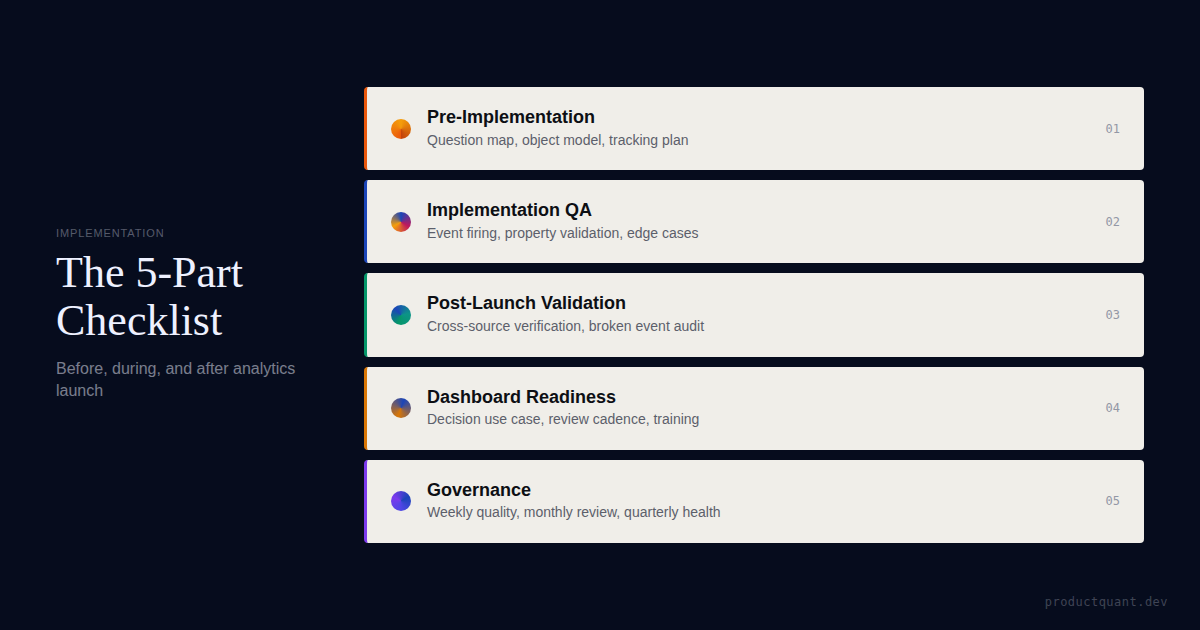
A practical implementation checklist for product analytics: question map, tracking plan, QA, dashboards, governance, and rollout steps ProductQuant uses...
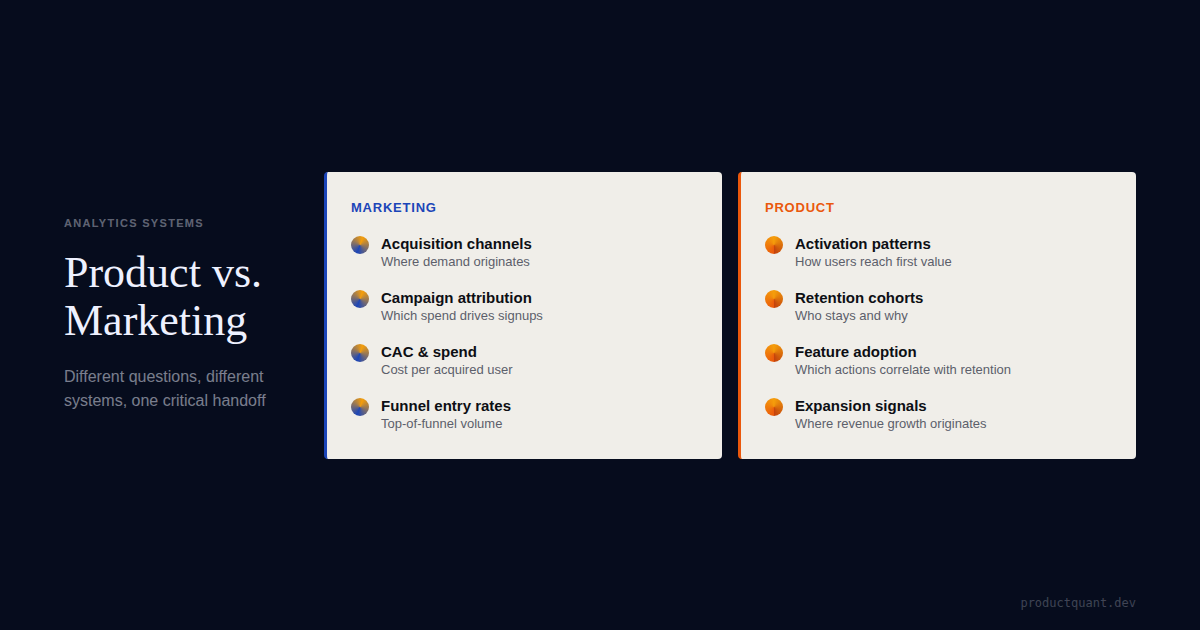
A practical comparison of product analytics and marketing analytics for B2B SaaS, including what each measures, where they overlap, and why teams make...
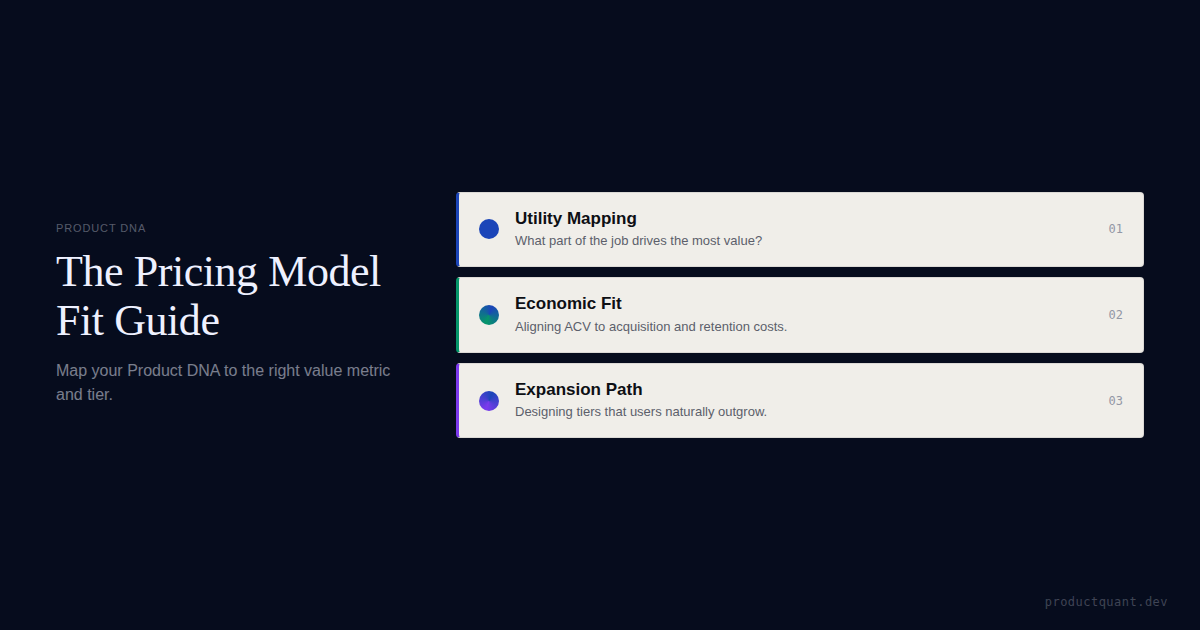
Product DNA analysis classifies how a SaaS product creates value, activates users, and constrains strategy. The framework, outputs, and decisions it improves.
Most PLG metric dashboards track the wrong things. Here is the tiered framework — leading indicators, lagging indicators, and vanity metrics — that separates signal from noise for $1–50M ARR B2B SaaS.
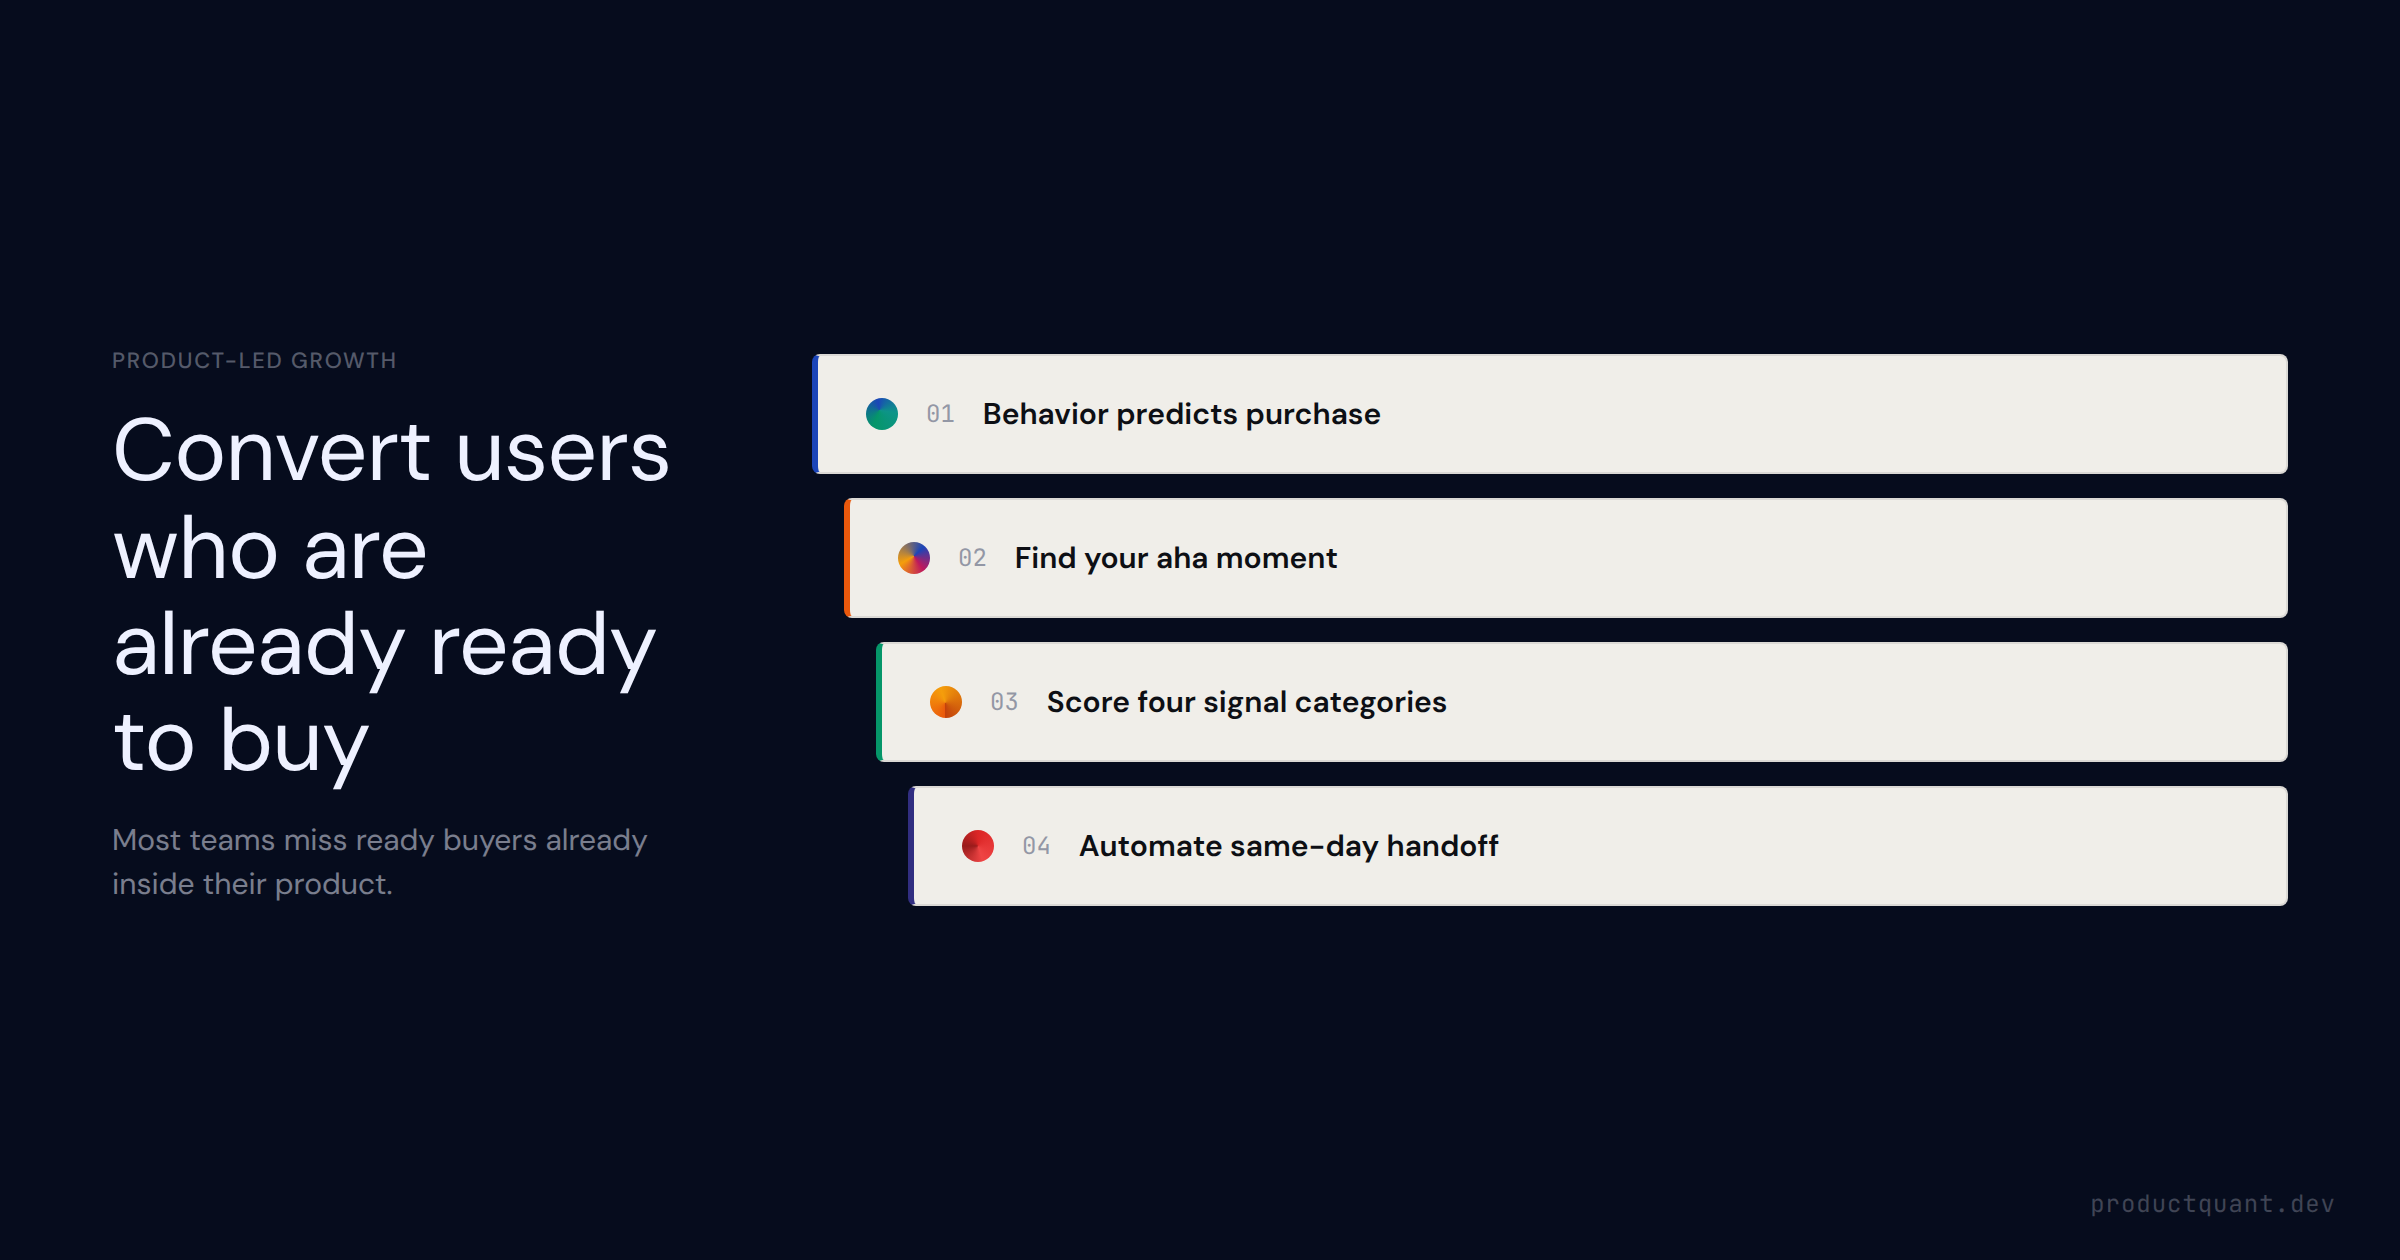
Product Qualified Leads (PQLs) are users whose in-product behavior signals purchase readiness. Learn how to define, score, and operationalize PQL-to-sales handoff from product usage data.
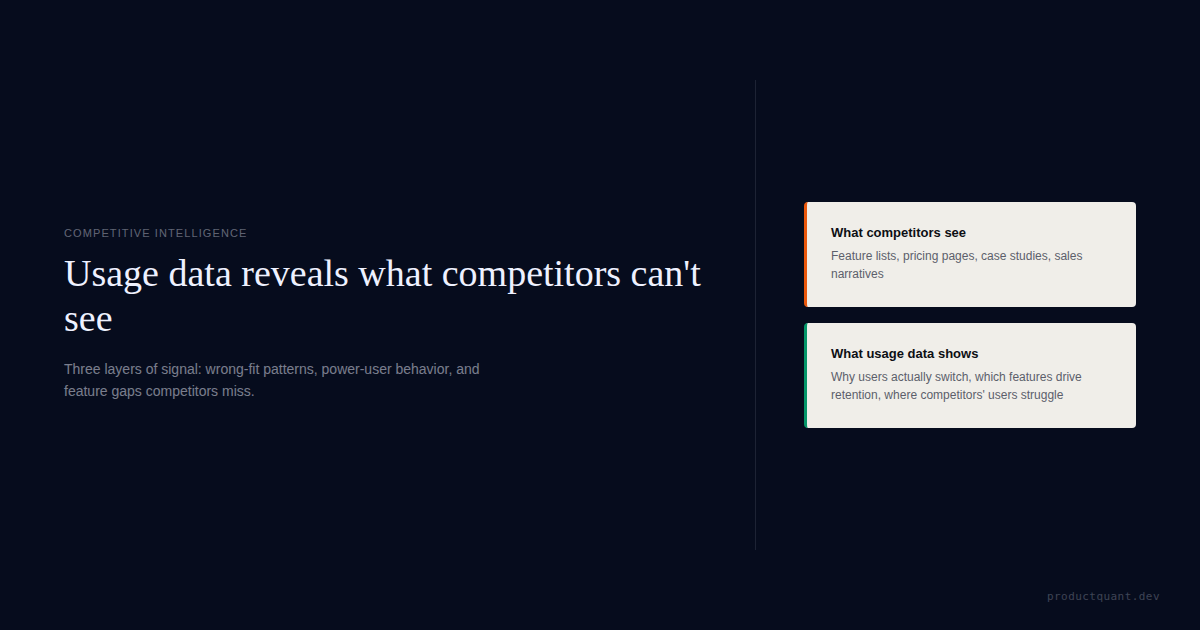
A practical guide to using product usage data for competitive intelligence: find wrong-fit demand, identify sticky jobs, and see which feature patterns...

How to use PostHog to build a churn early warning system with HogQL risk scoring, session replay triggers, behavioral cohorts, and automated interventions.
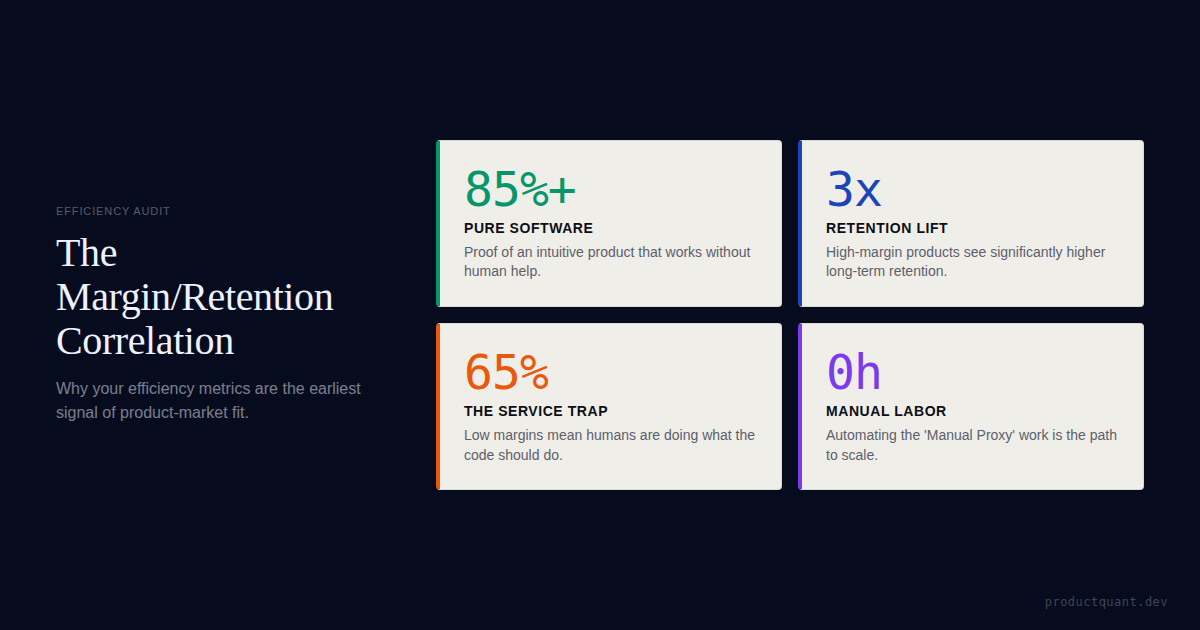
Gross Margin isn
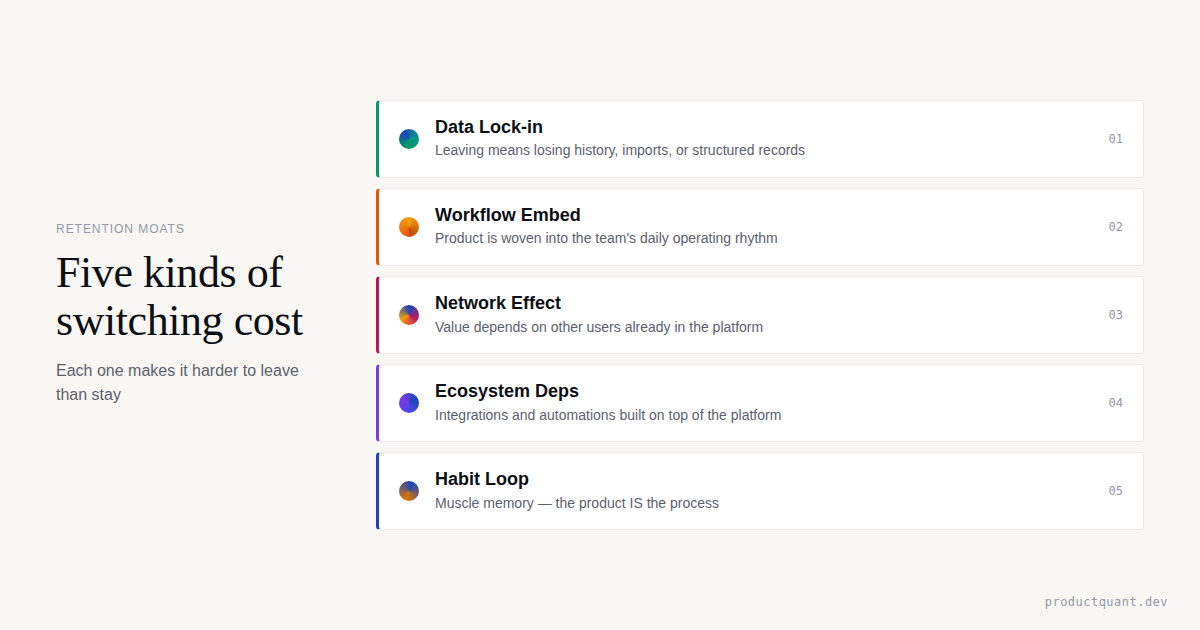
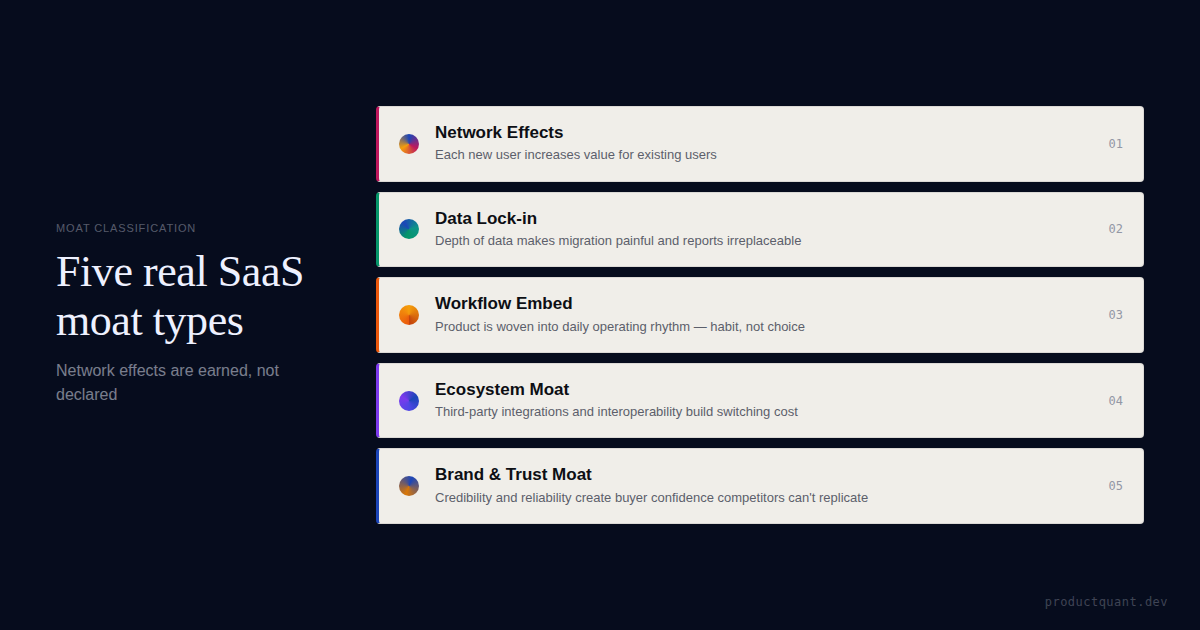
Retention is not just satisfaction. It comes from structural switching costs. Here are the five moat types and how to audit which ones you actually have.

RevOps is not a reporting function. It is the system that connects sales, marketing, and customer success into one revenue cycle. Here is how it actually works — and what it takes to build it.
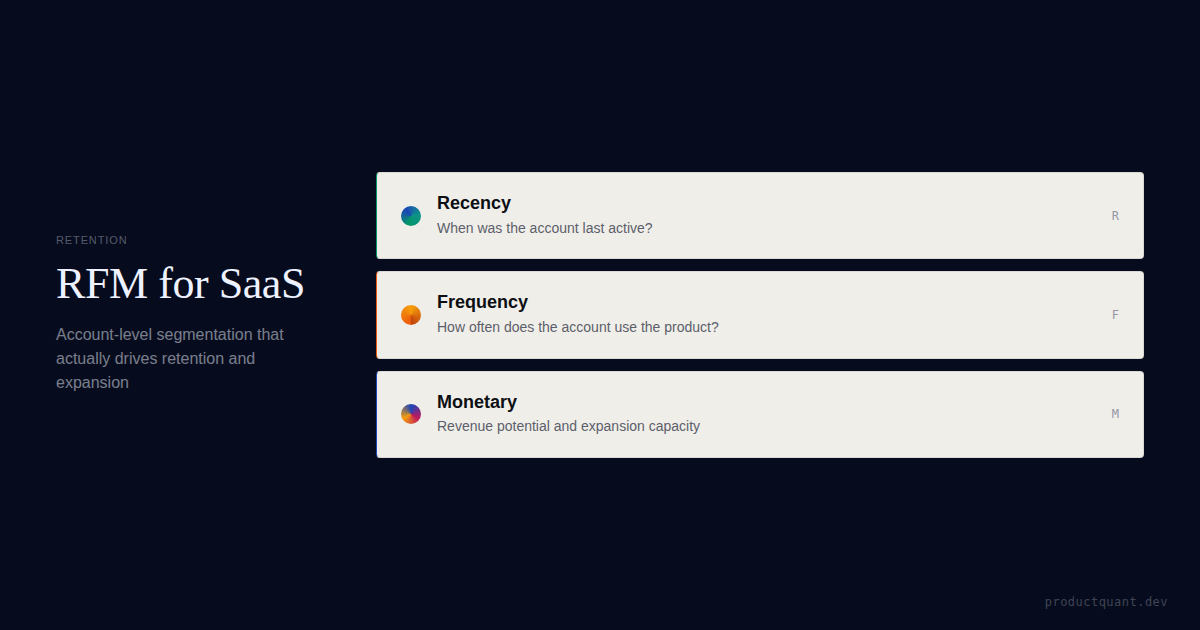
Most SaaS RFM projects fail because they classify noisy user IDs instead of real accounts. Learn account-level RFM segmentation for B2B SaaS that drives retention, upsell, and growth.
A war story about tracking down a 2,000% event spike in PostHog caused by a double-fire bug. See the 5-step investigation framework we used.
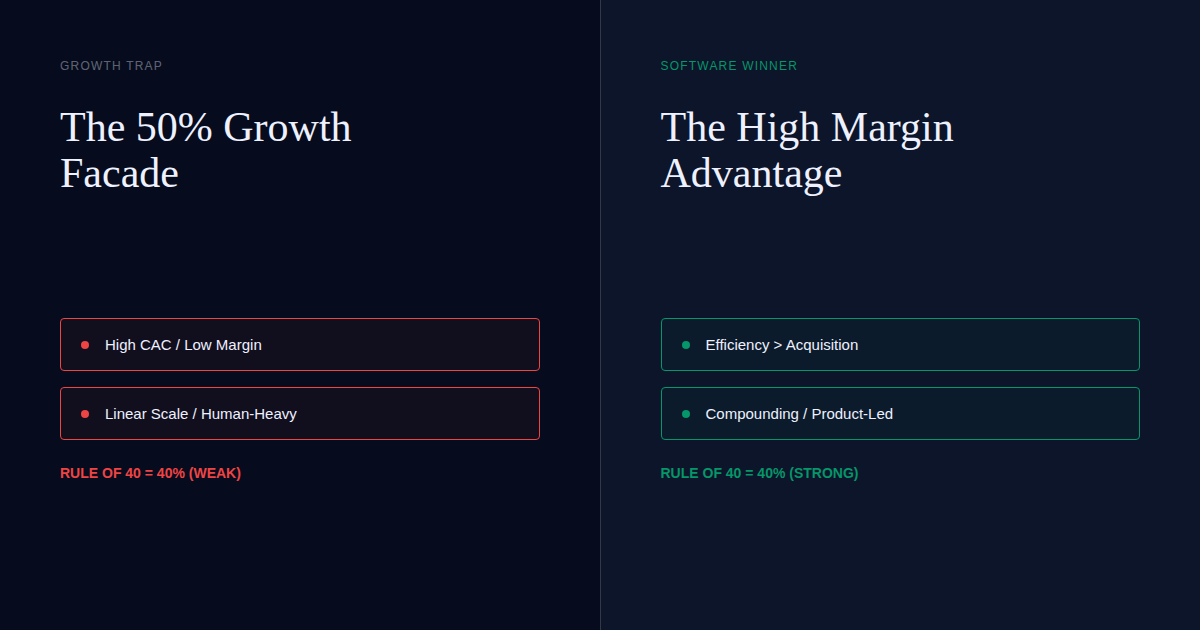
The Rule of 40 is a gold standard for SaaS health, but in 2026, it
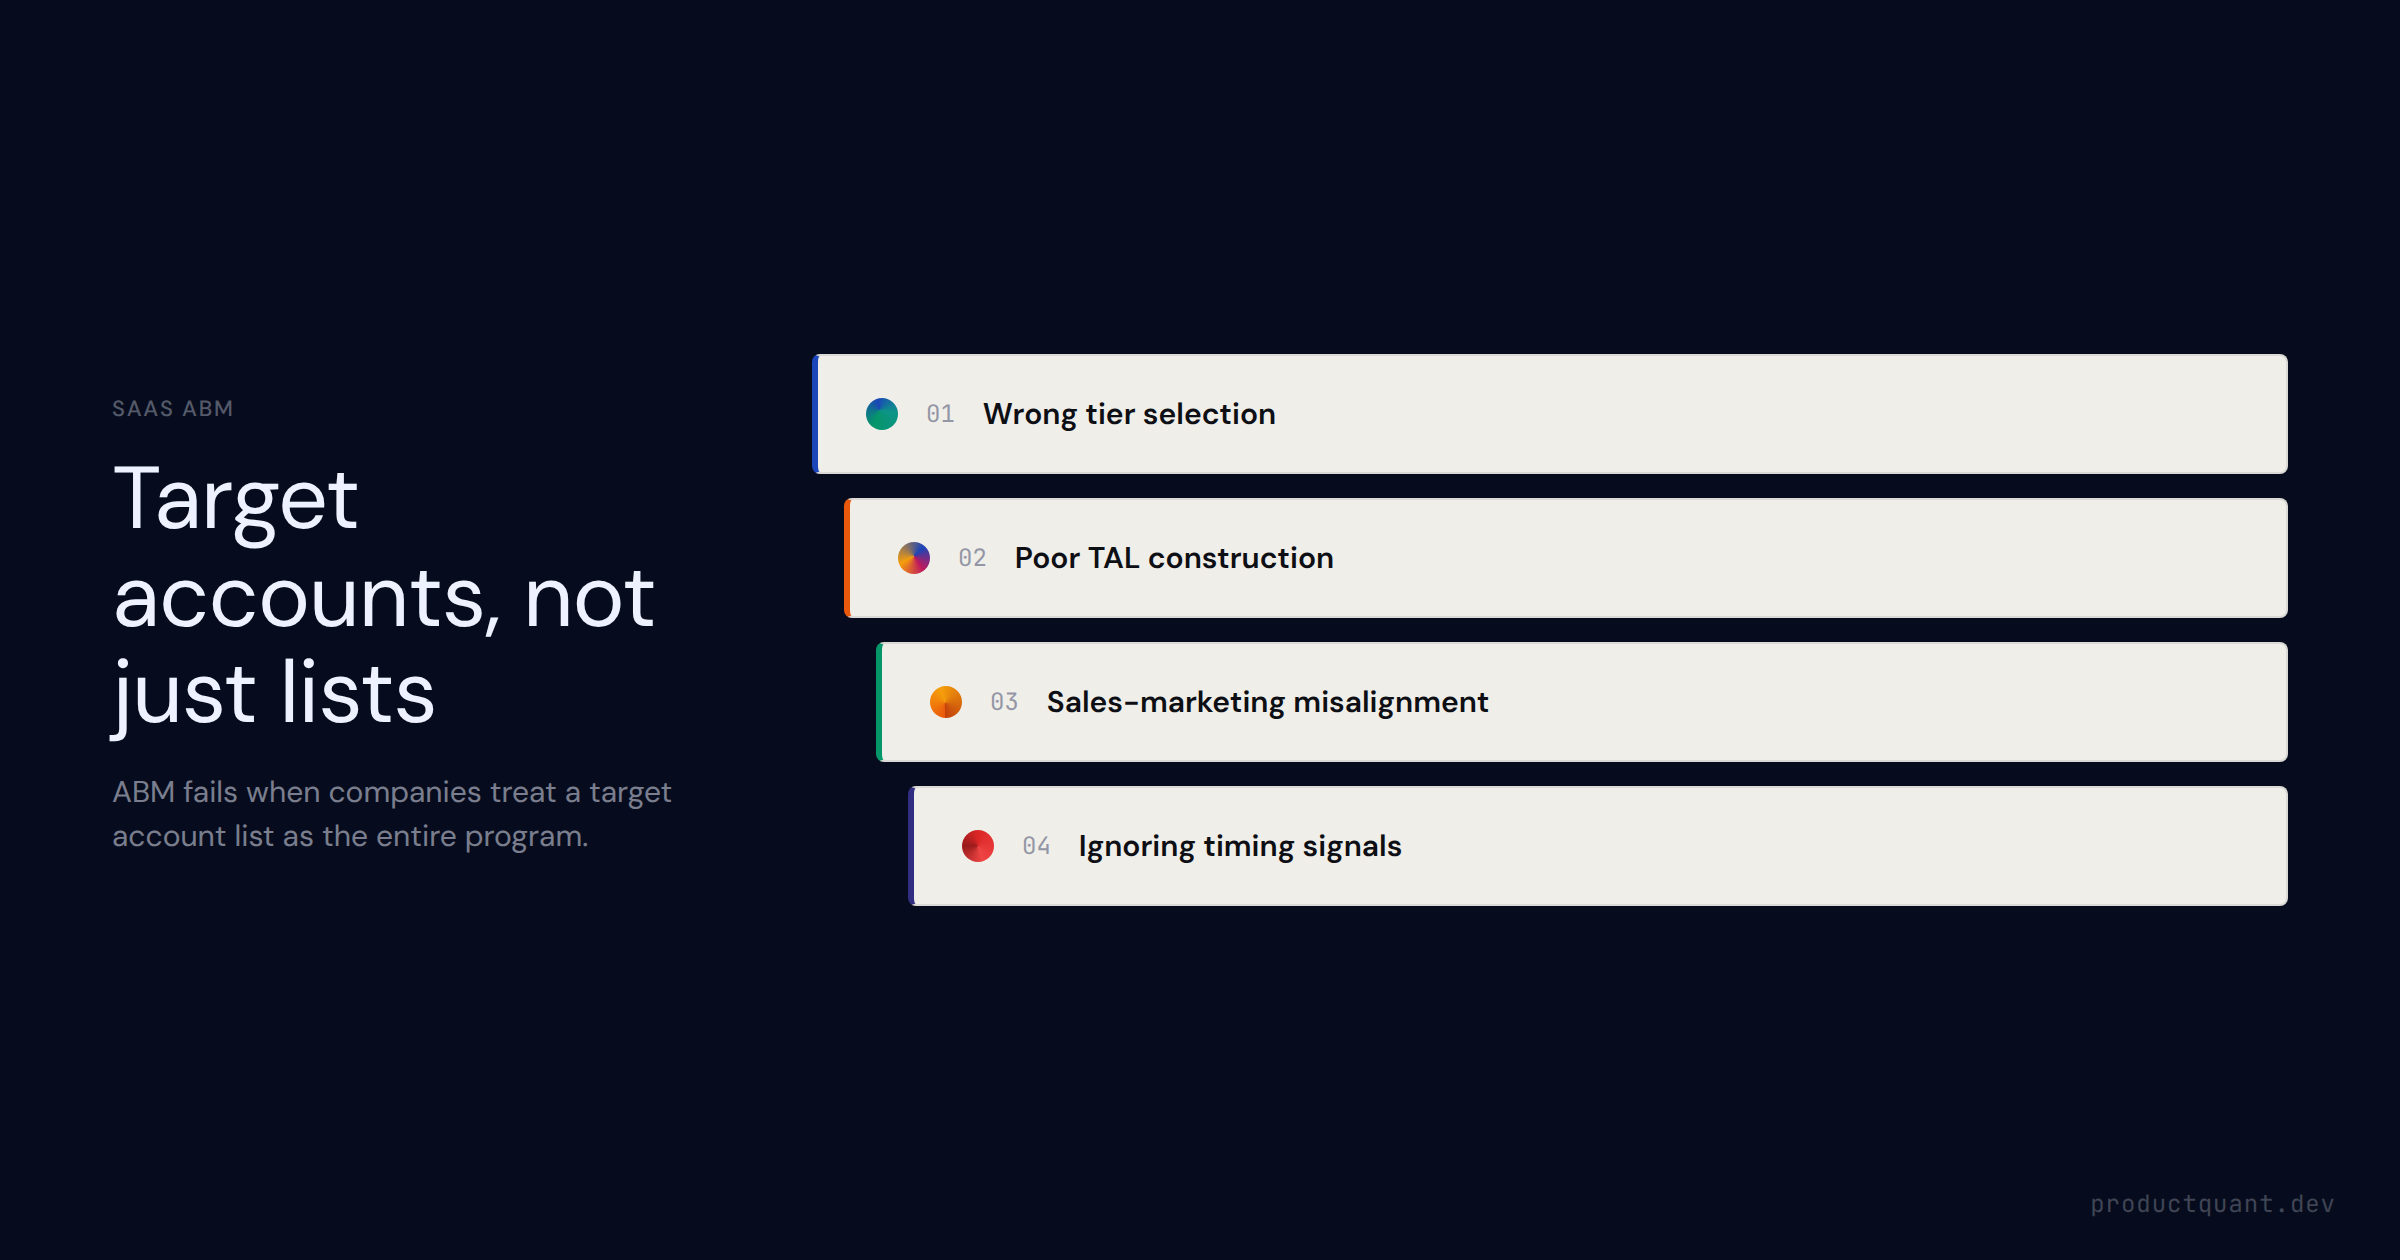
How to build a SaaS ABM program that converts — covering ABM tier selection (1:1, 1:few, 1:many), target account list construction, ICP criteria, sales-marketing alignment, pre-pipeline metrics, and the signal layer that

Industry activation benchmarks vary 10.9x from 5.0% (FinTech) to 54.8% (AI/ML). Find your segment's verified 2026 target and fix your activation leaks.
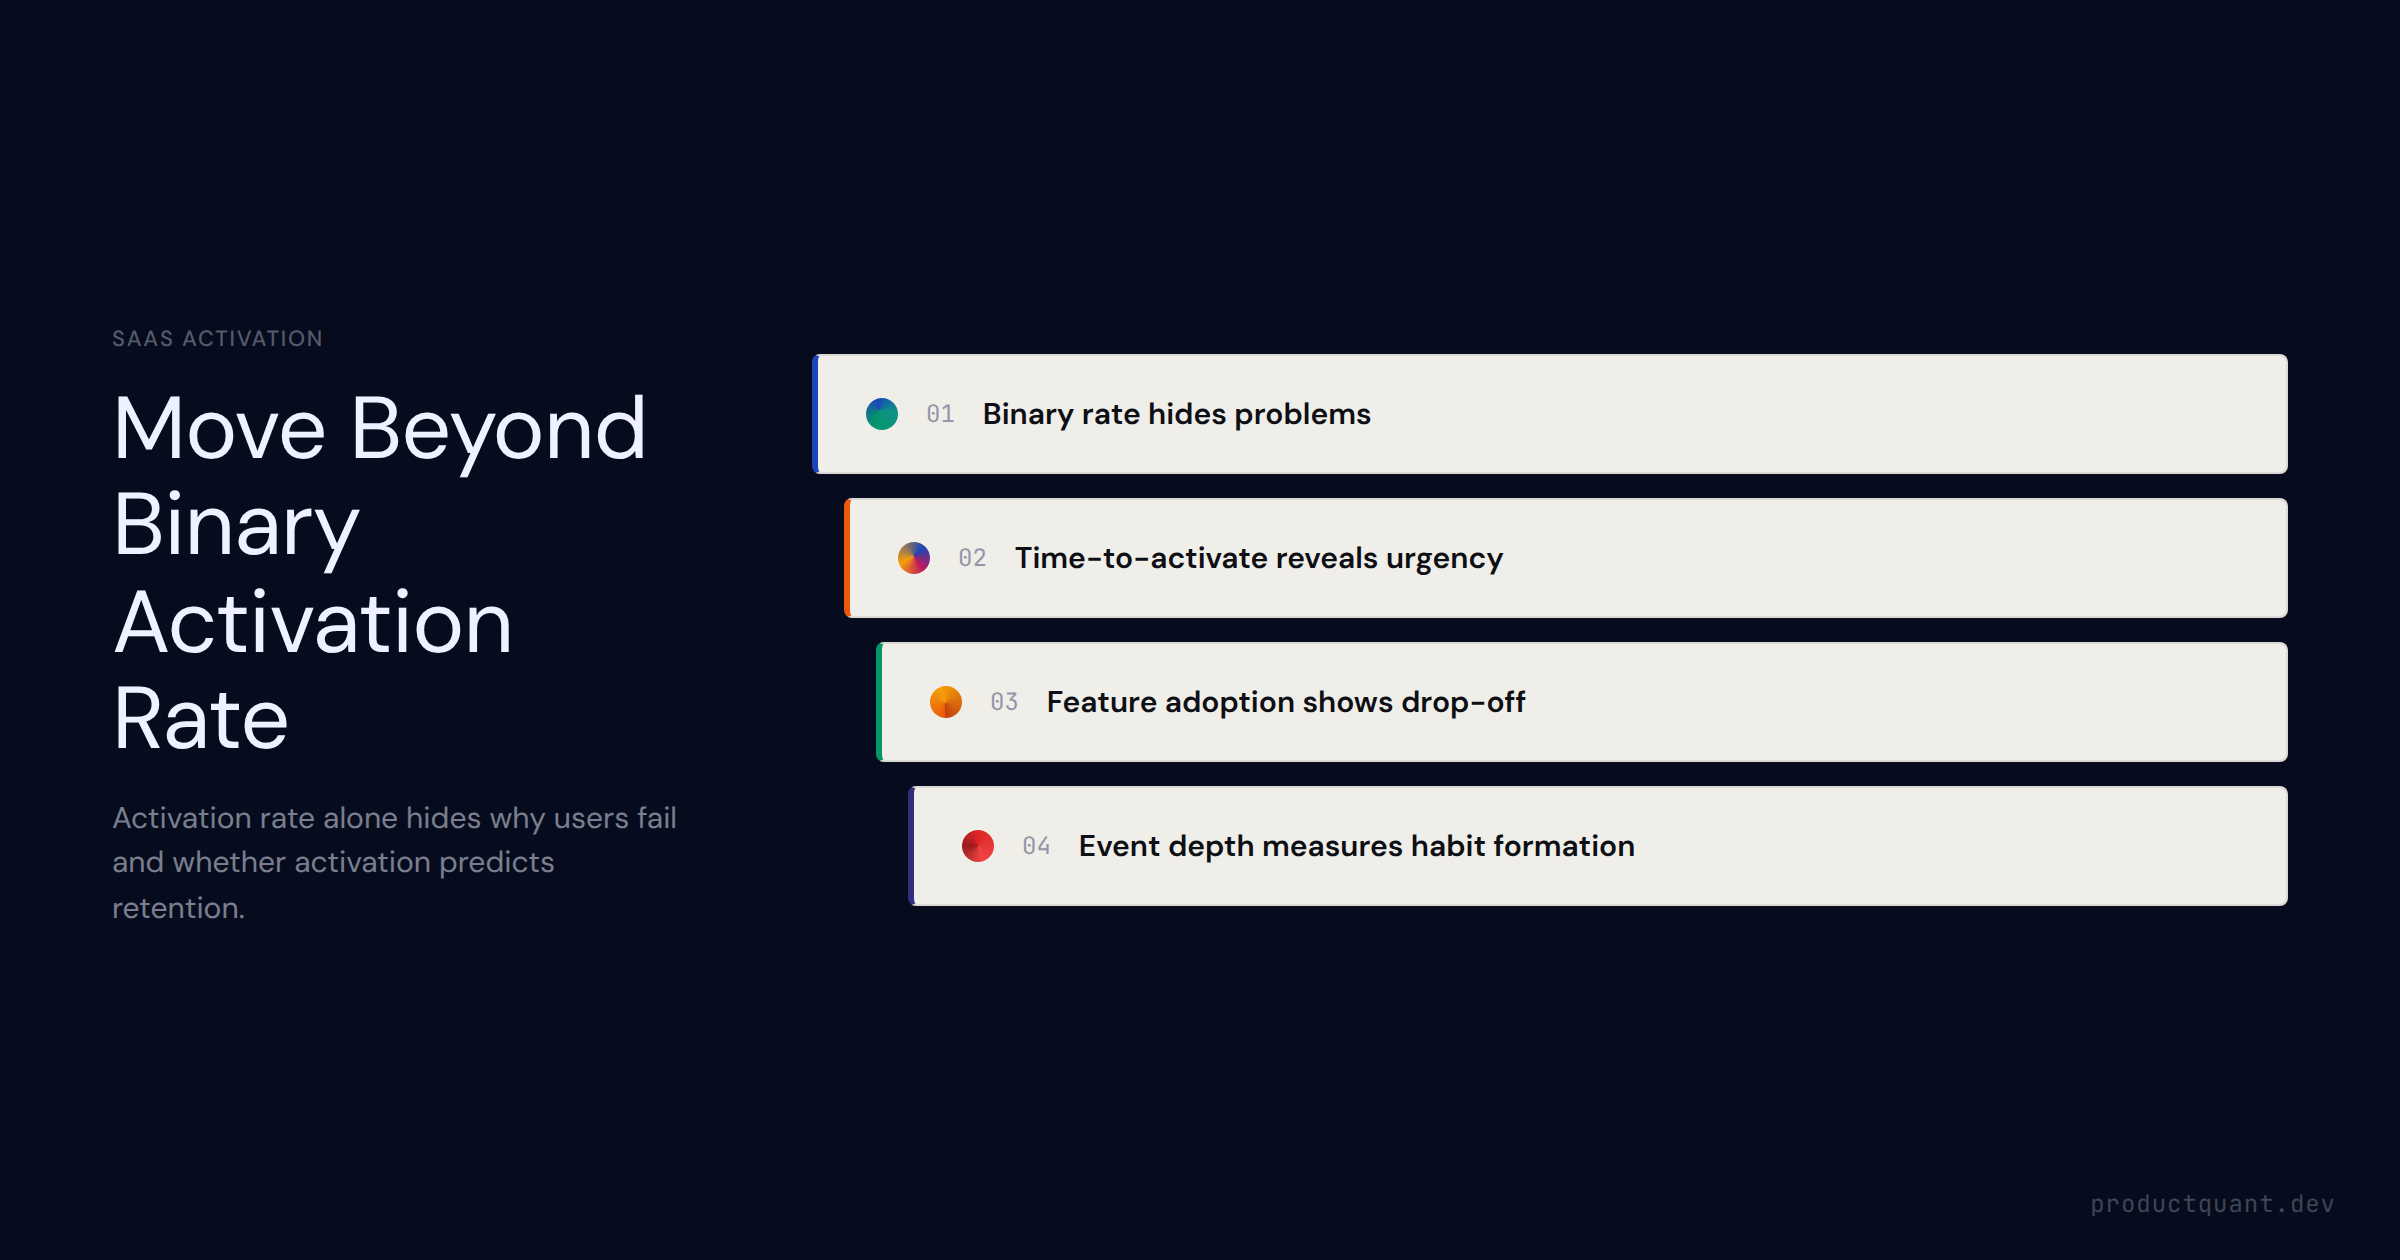
Activation rate alone tells you what happened — not why or what to fix. This guide covers all 5 SaaS activation metrics, how to define your empirical activation event, time-to-activate distributions, and industry benchma
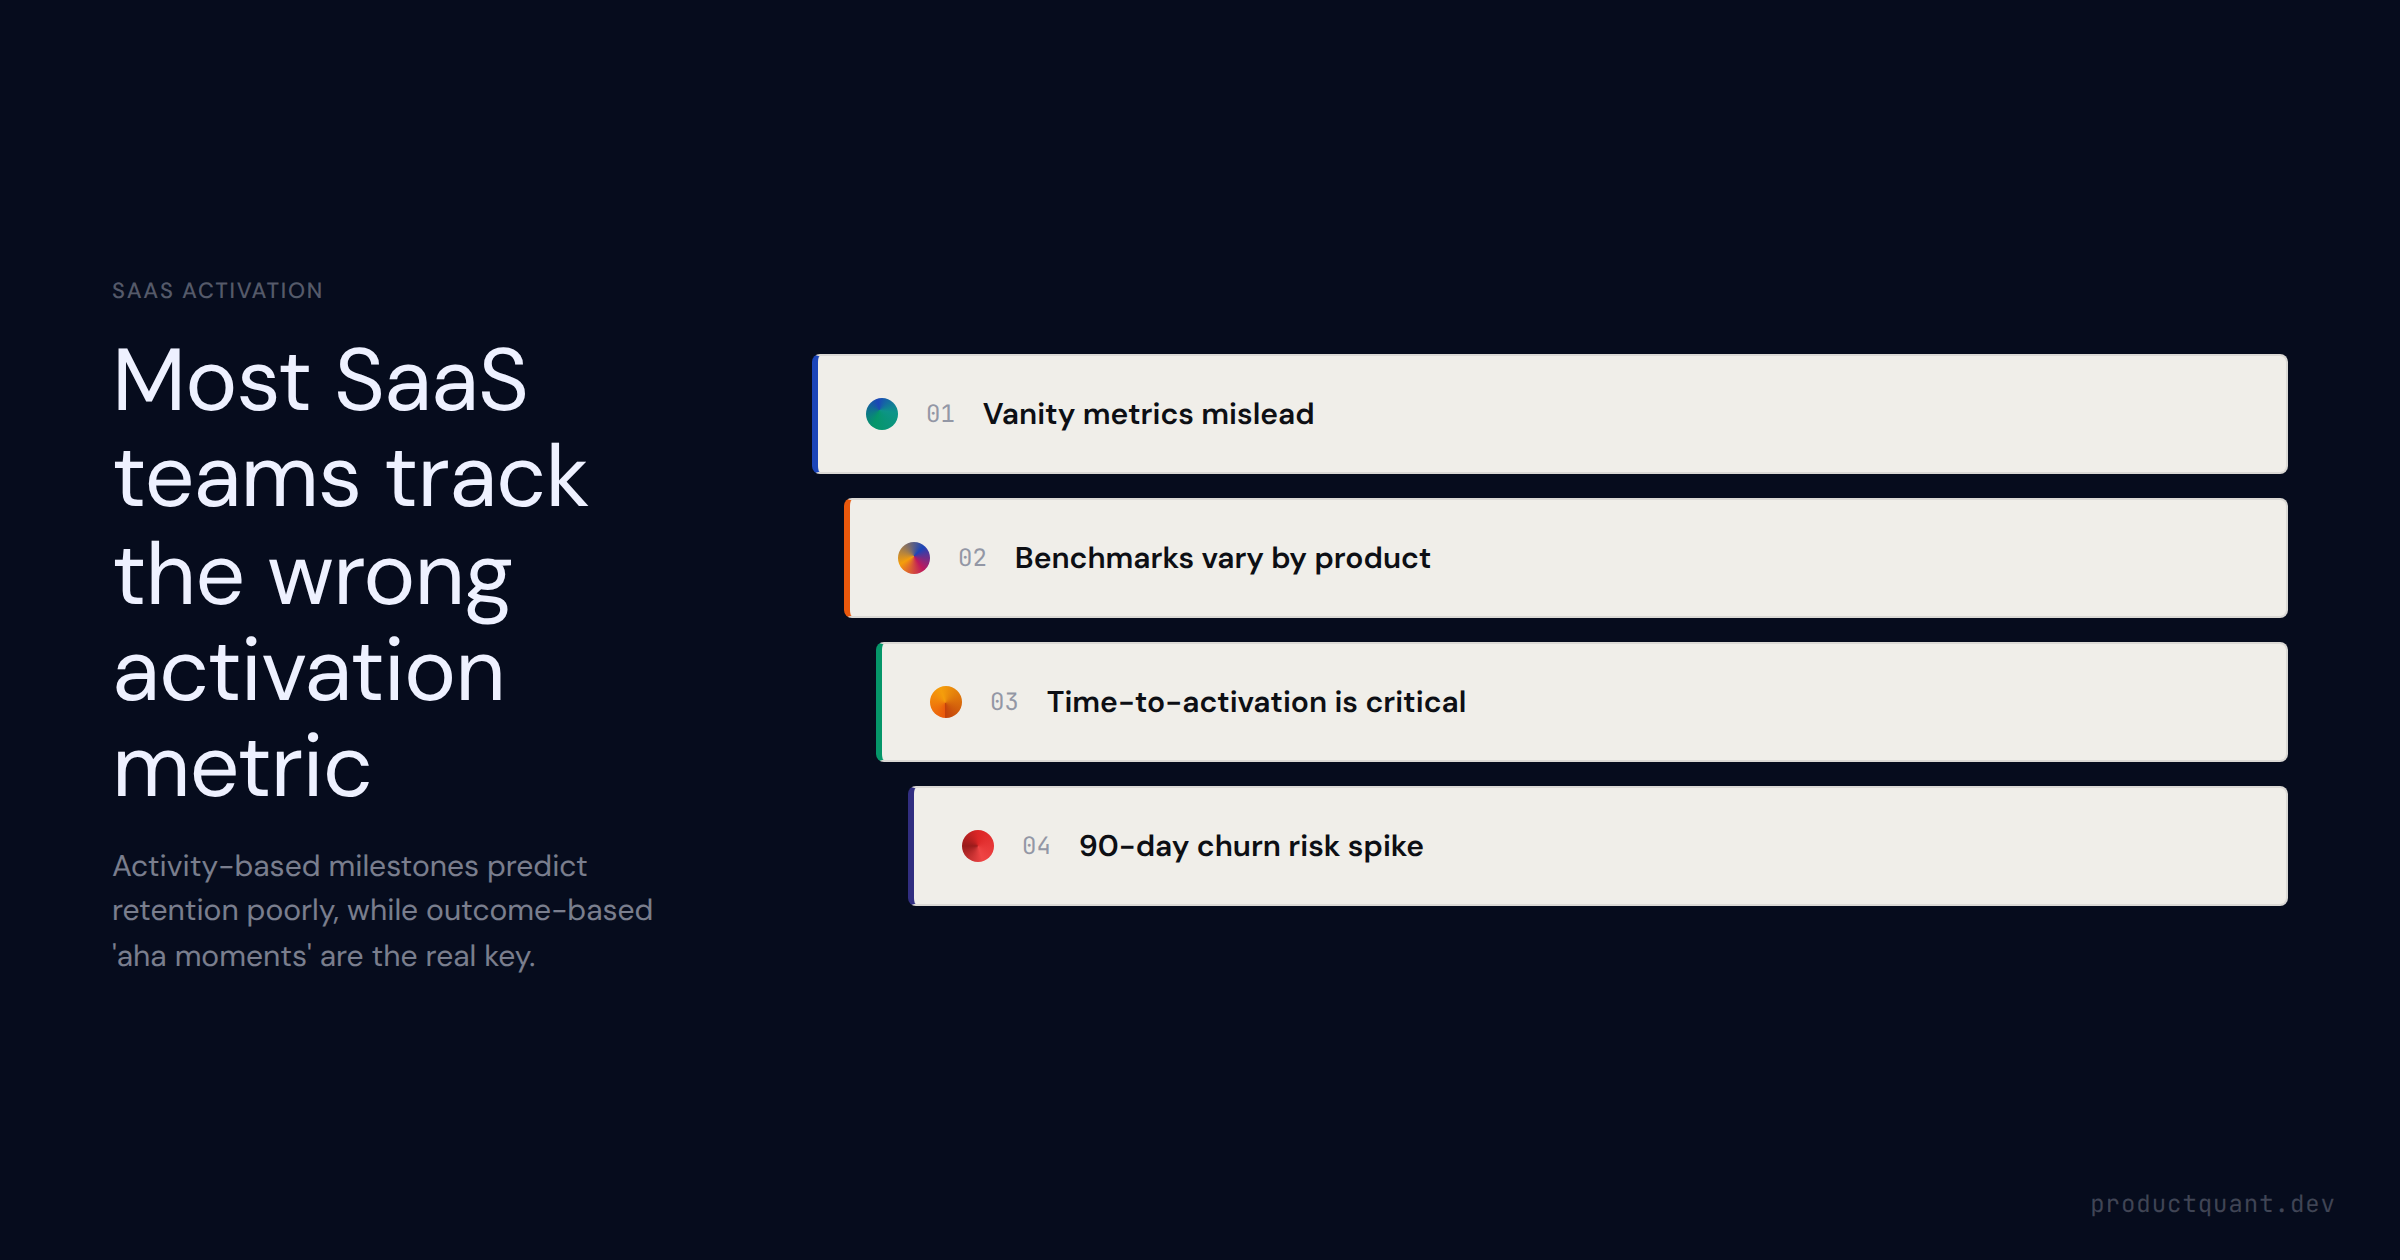
SaaS activation rate benchmarks by product type. Why most teams track the wrong metric, what good activation looks like across PLG, sales-led, and API-first products, and how to improve it.
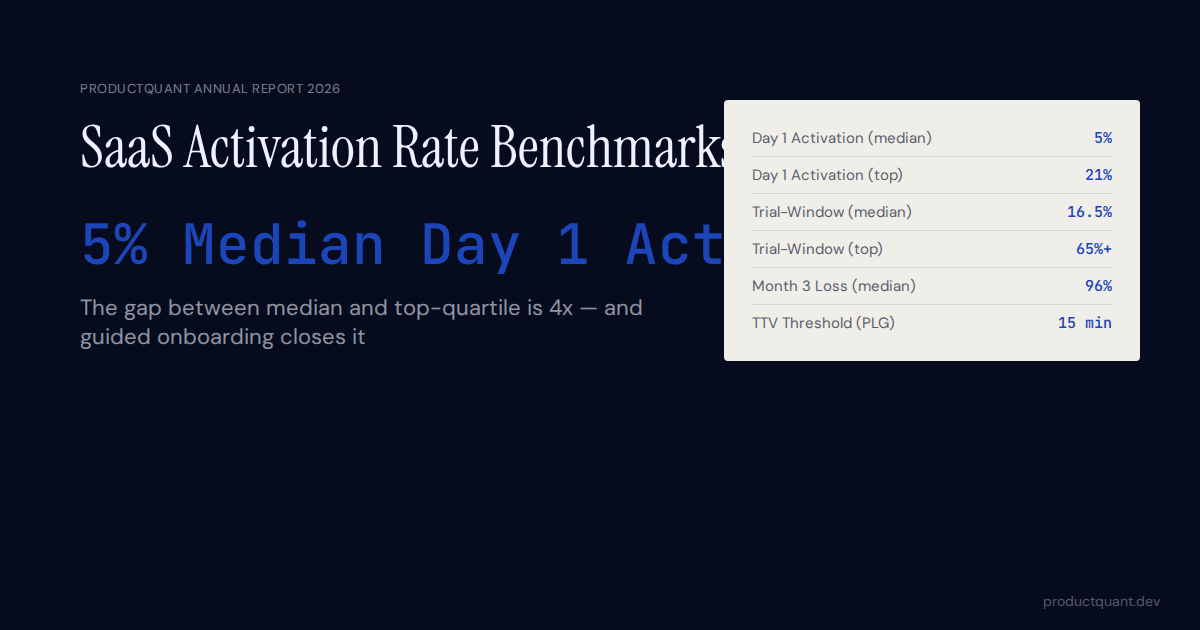
SaaS activation rate benchmarks 2026: Day 1 activation, trial conversion, retention data, and ARR tier breakdowns from Amplitude, OpenView, and Gsquared.
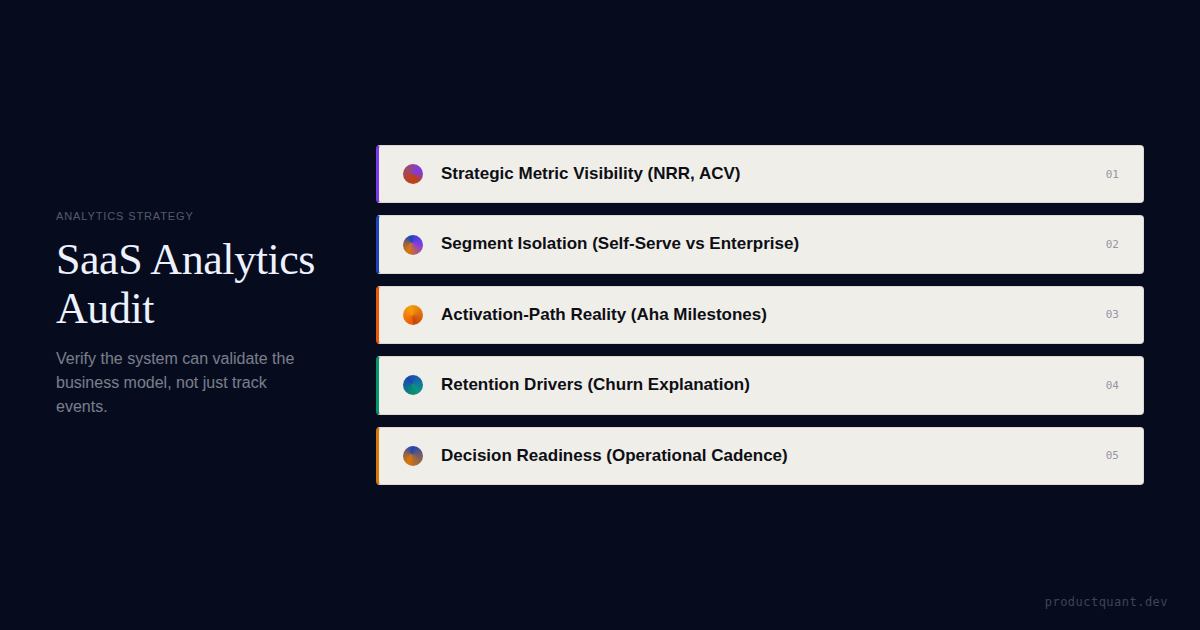
A practical SaaS analytics audit framework: check segment visibility, activation funnels, NRR, churn reasons, and whether dashboards answer the questions...
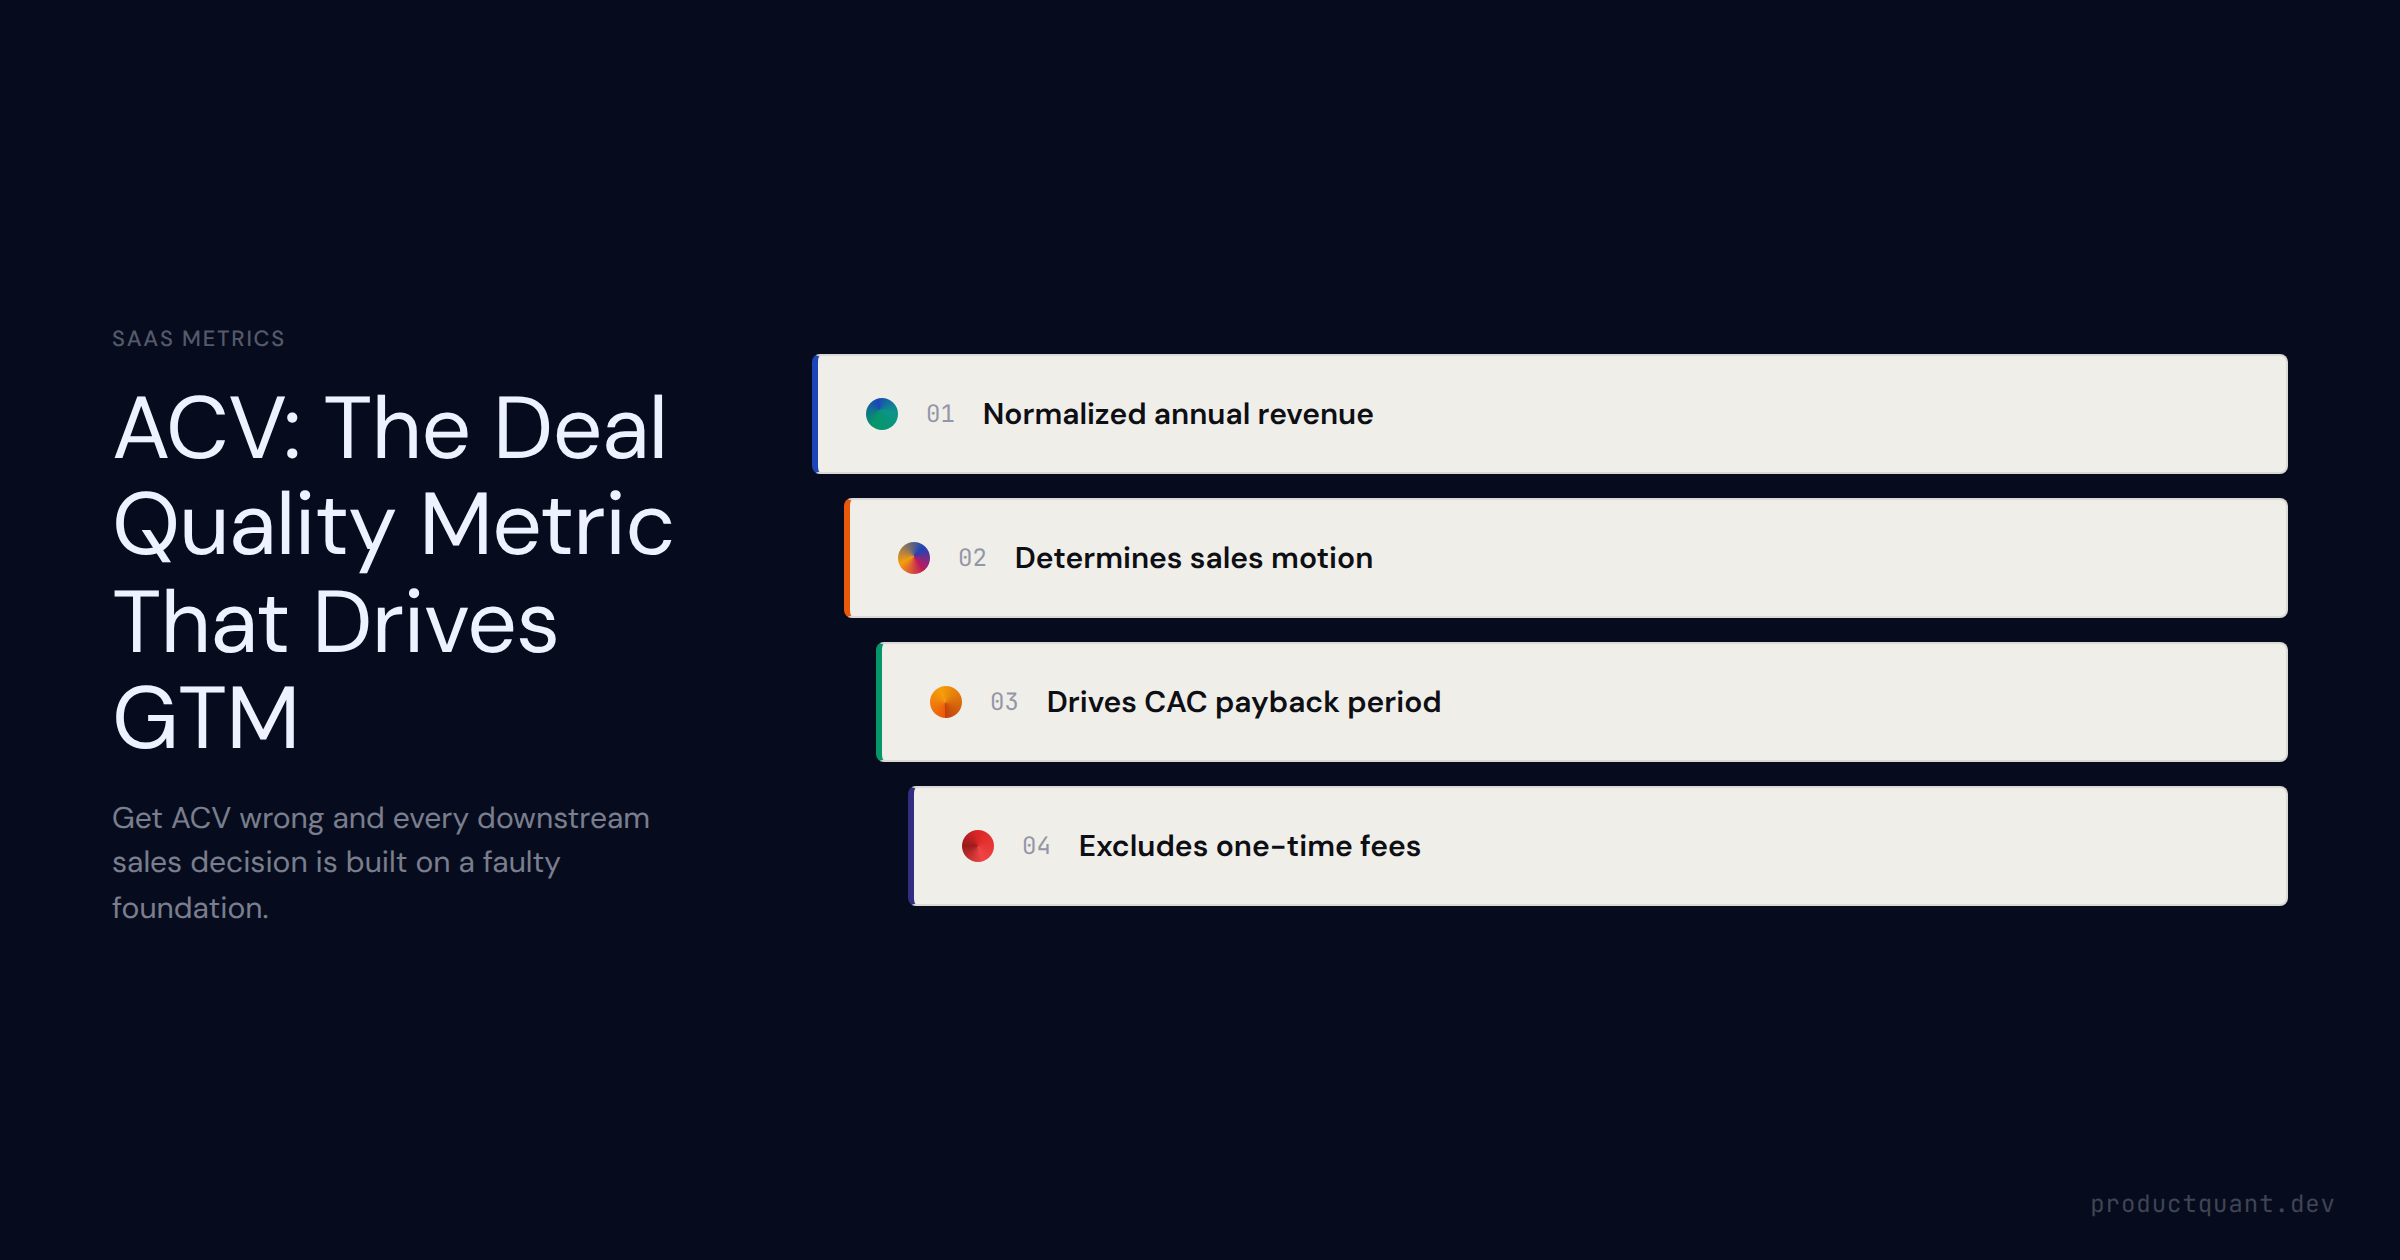
ACV is the deal-quality metric that determines your GTM motion, sales cycle, and CAC payback. Learn how to calculate ACV, compare ACV vs ARR vs TCV, and grow it through packaging — not discounting.
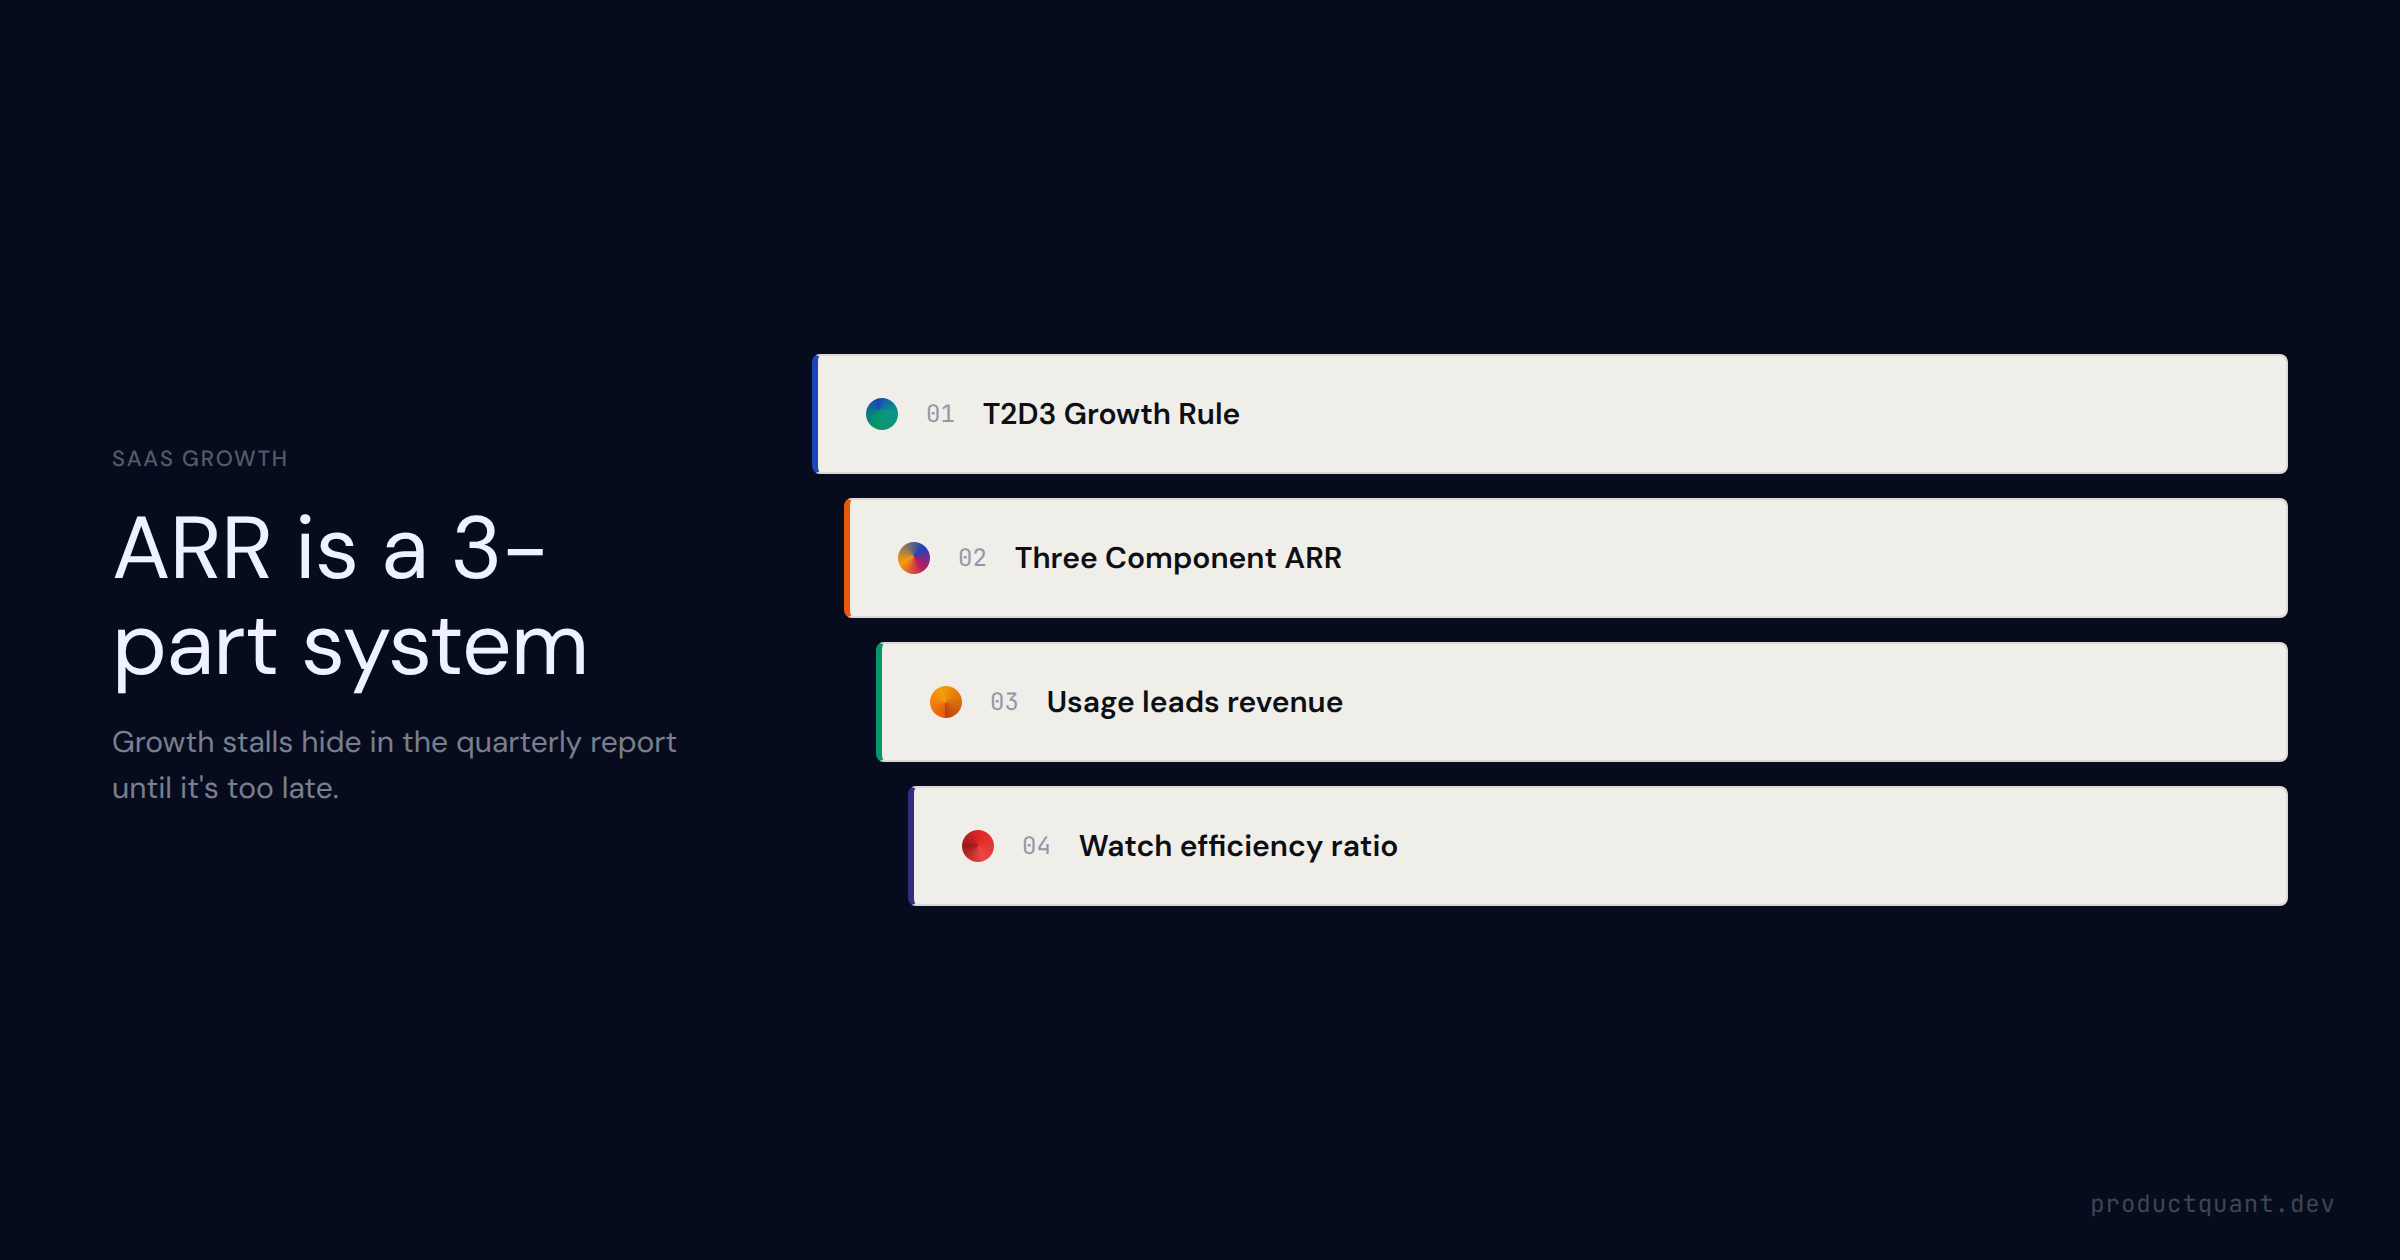
ARR growth benchmarks by stage, the T2D3 rule, the 3-part net new ARR model, the ARR growth efficiency ratio, and how product usage data predicts next-quarter ARR before revenue does.

How to properly analyze churn in SaaS — the difference between logo and revenue churn, cohort vs. snapshot measurement, the churn postmortem framework, and the behavioral signals that precede cancellation by 30–60 days.
Most churn systems flag customers who already decided to leave. The highest-value systems track 4 behavioral leading indicators — engagement velocity, feature breadth, support patterns, billing signals — that surface 30–
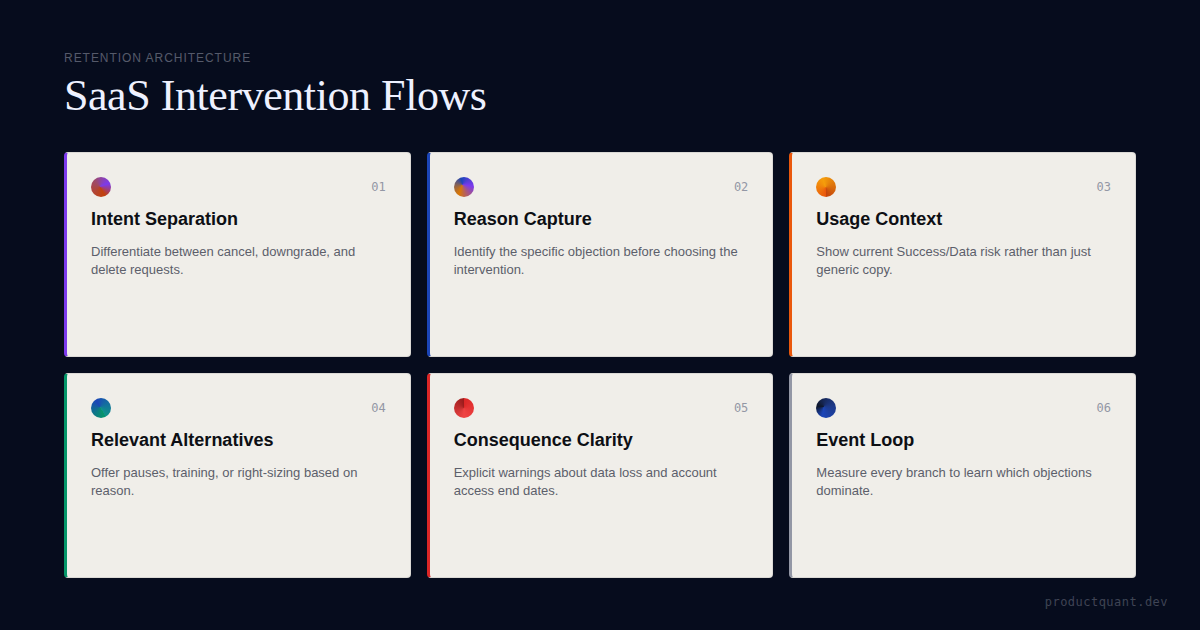
A practical guide to SaaS churn intervention design: cancellation, downgrade, and account deletion flows built around reason capture, respectful friction,...
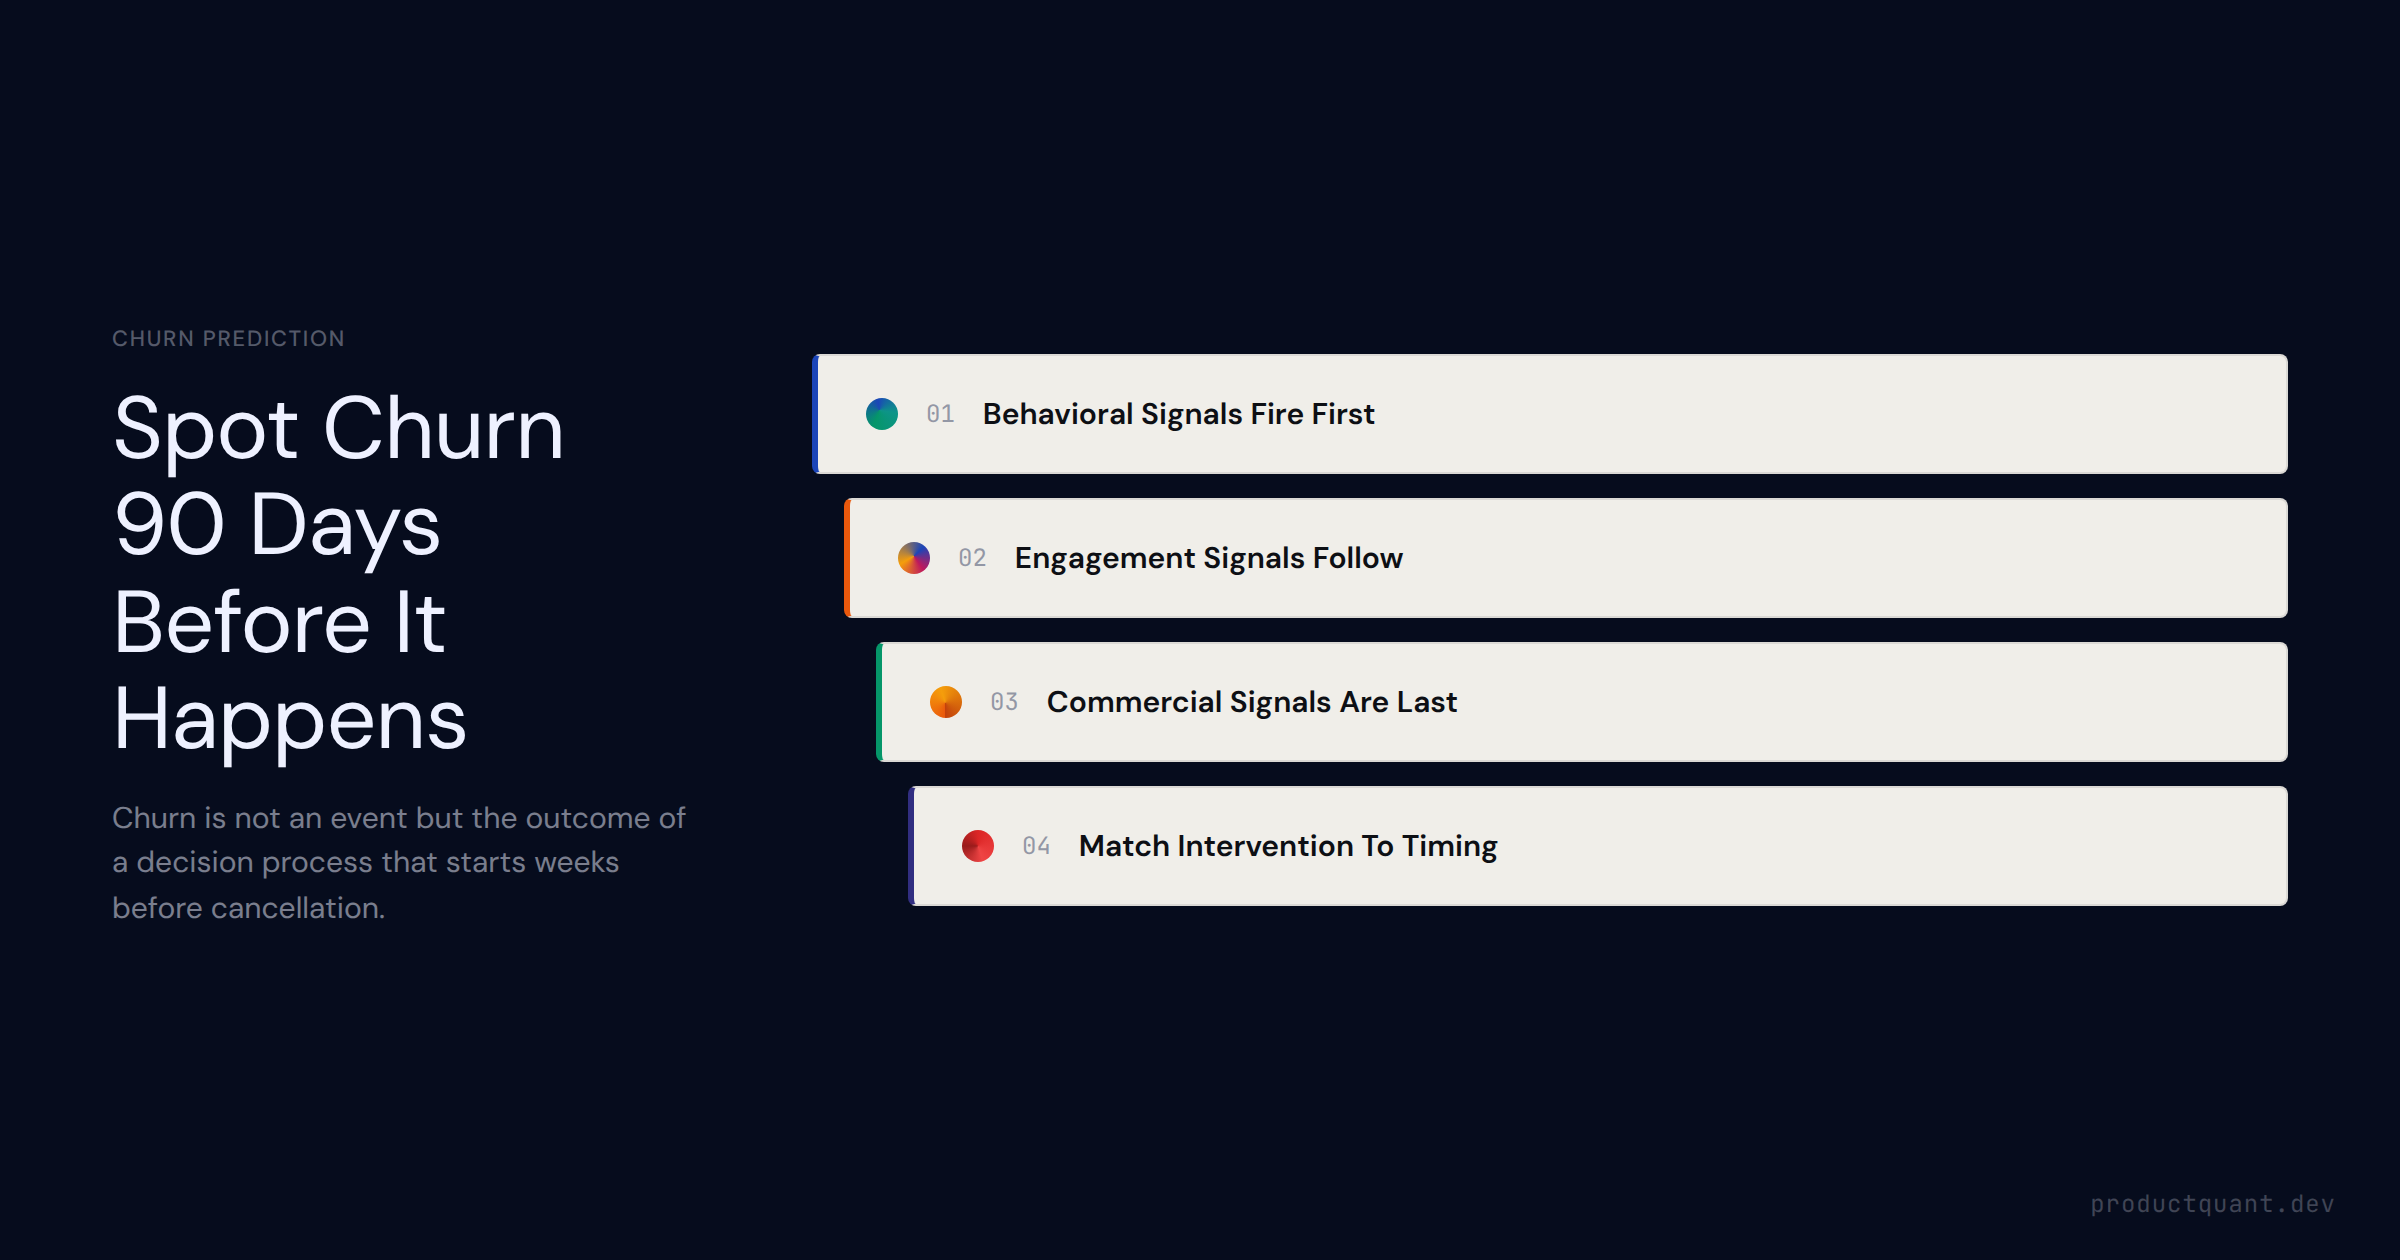
Churn prediction in SaaS requires four signal categories, two system architectures, and a timeline that starts 90 days before the renewal. This guide covers the lag problem, the leading indicator hierarchy, and how to tu

Most SaaS companies lack both a real onboarding flow and a churn prevention system. Here
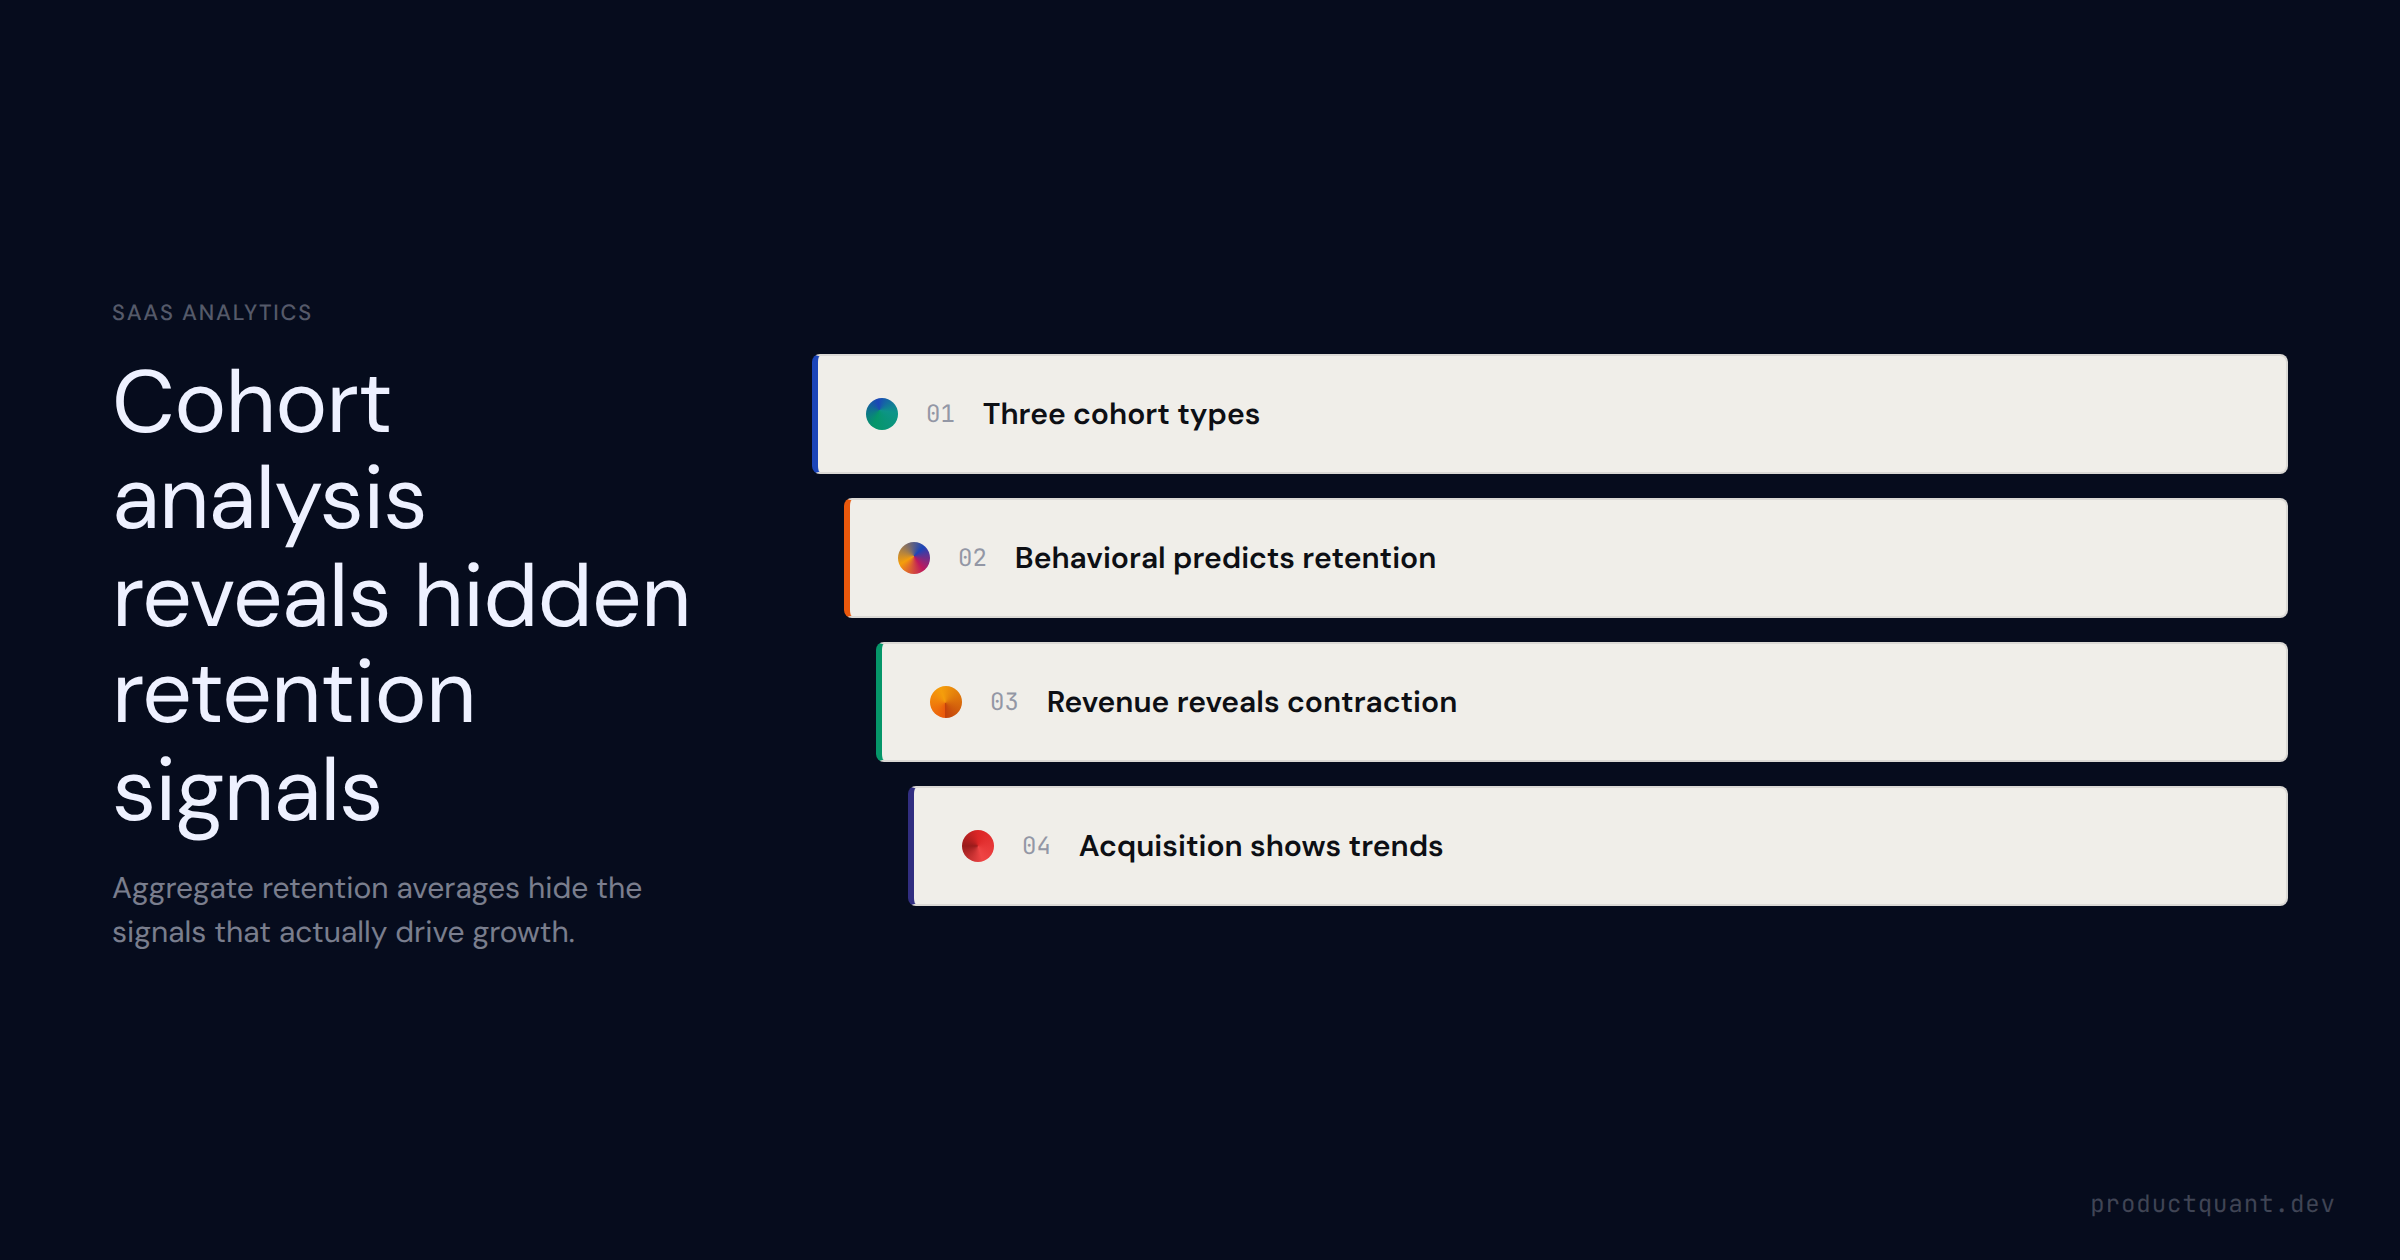
Cohort analysis is the SaaS diagnostic that separates a retention problem from a monetization problem. Learn how to build a retention cohort table, read the three curve shapes, and identify which acquisition sources prod

SaaS cohort analysis reveals which users stay, which leave, and why — but only if you use the right cohort type. This guide covers acquisition, behavioral, and segment cohorts, how to read retention curves, D30/D60/D90 b
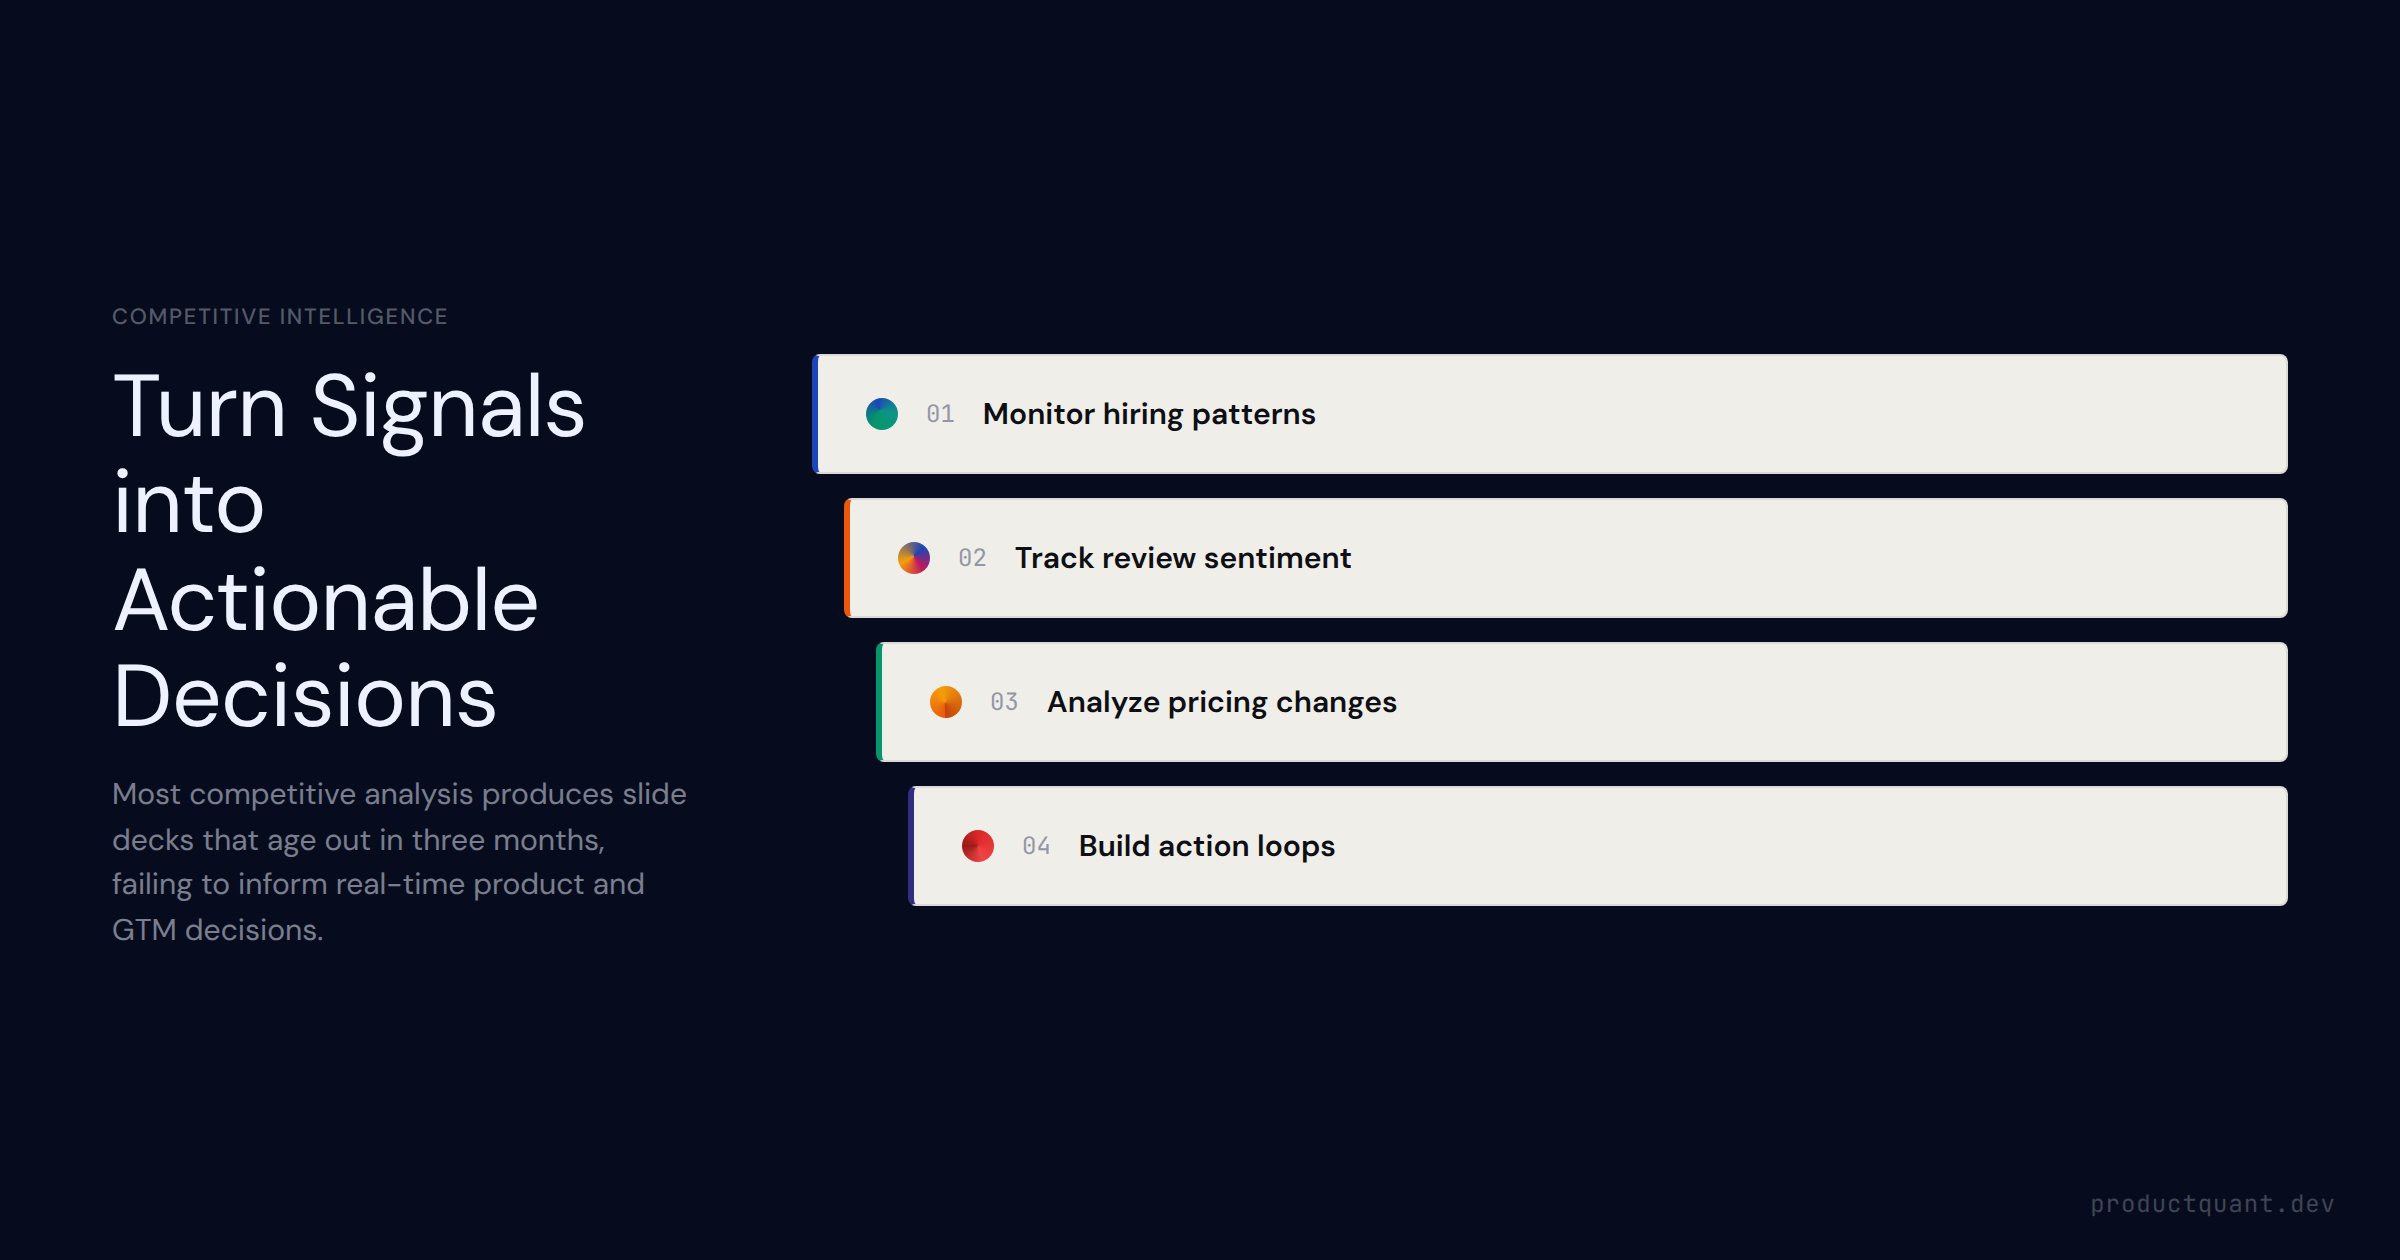
Most SaaS competitive analysis produces feature comparison tables that go stale the moment they are finished. This guide covers four intelligence sources — win-loss data, pricing pages, review sites, and job postings — a

CAC is a health metric, not just a cost line. Learn blended vs. channel-specific CAC, CAC payback period, LTV:CAC ratio, what actually drives CAC higher and lower, and why PLG structurally outperforms sales-led at scale.
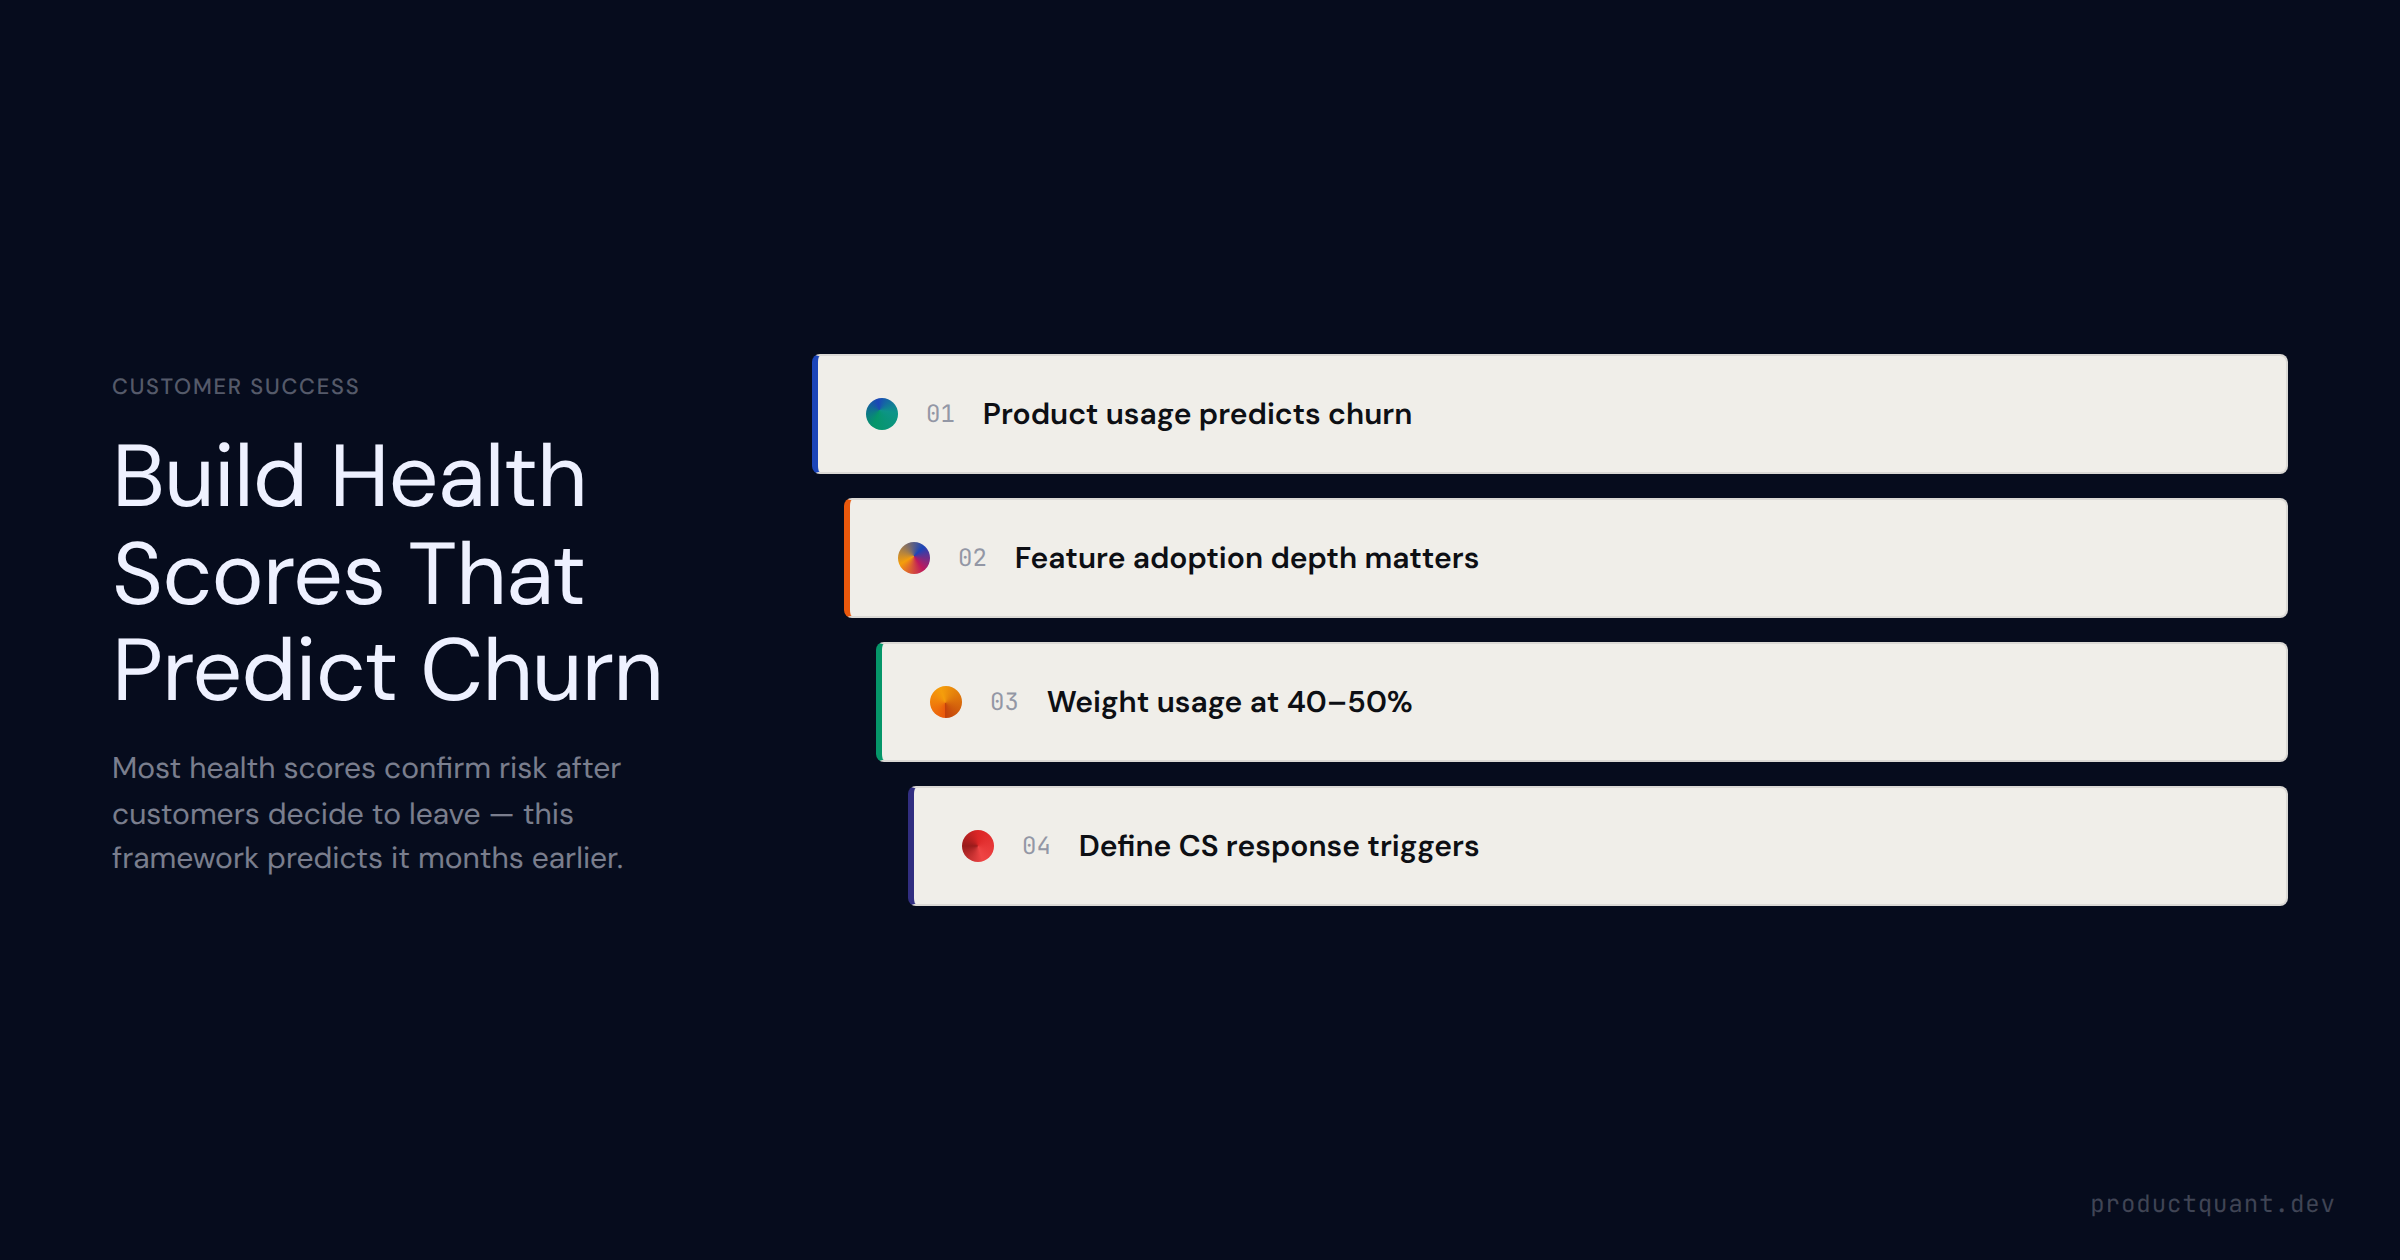
A customer health score aggregates feature adoption, engagement frequency, NPS, support tickets, and billing behavior into a churn predictor. This guide covers the weighting problem, why product usage dominates, and how
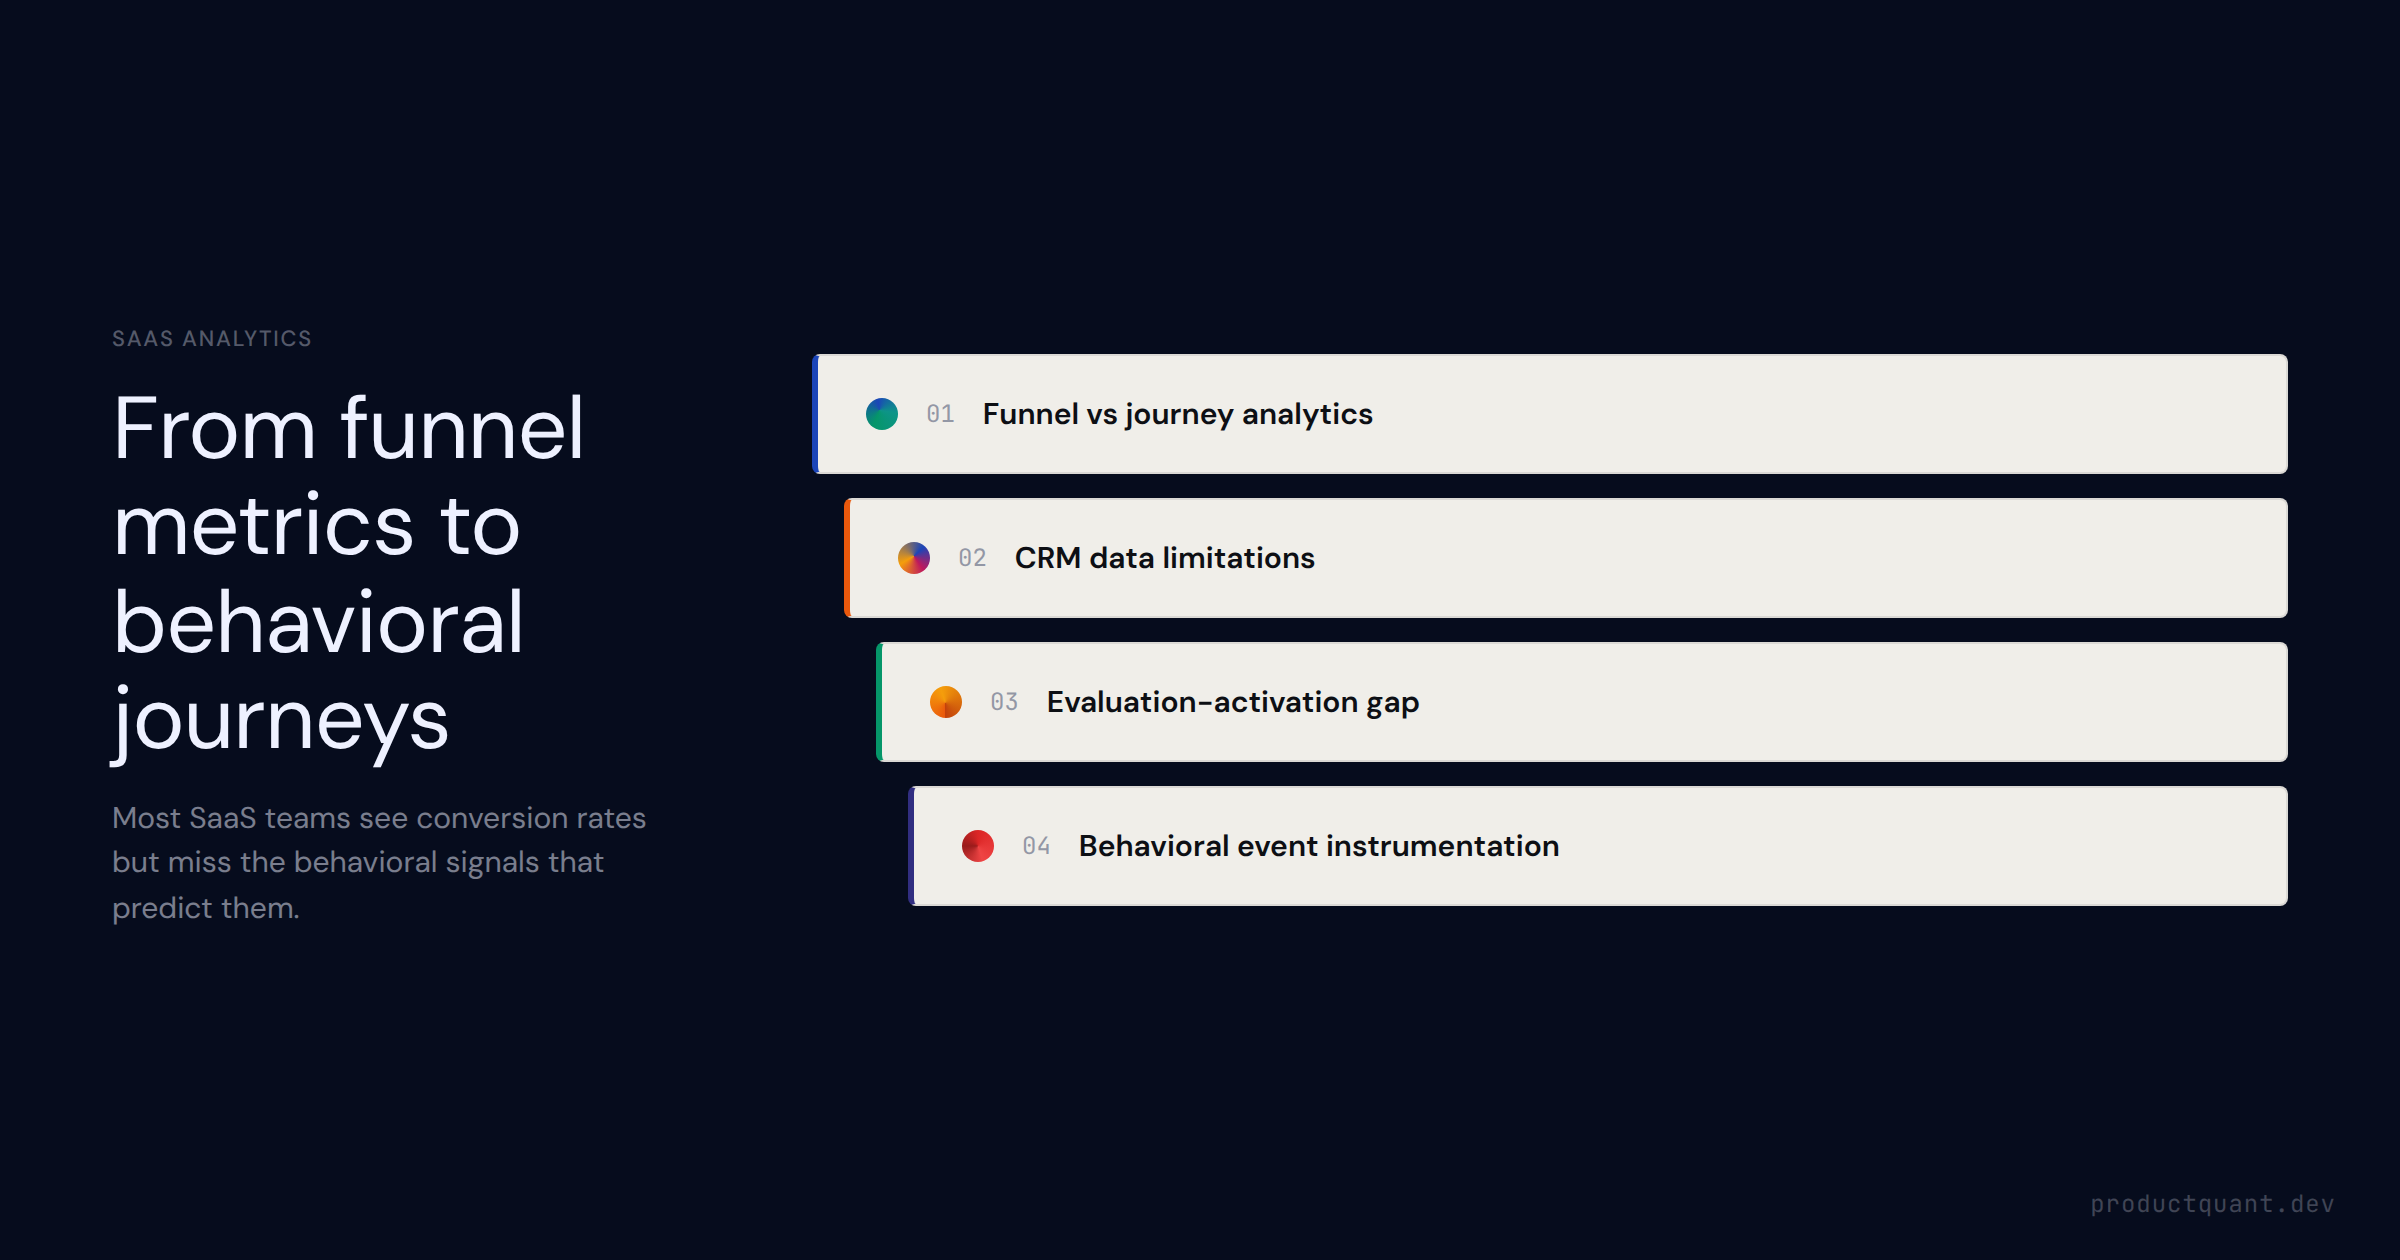
How to instrument each stage of the SaaS customer journey — awareness through expansion — with the behavioral events, leading indicators, and drop-off signals that make journey analytics operational rather than theoretic
LTV in SaaS is calculated from three inputs: ACV, gross margin, and churn rate. Learn the formula, the 3:1 LTV:CAC benchmark, why LTV misleads early-stage teams, and how product usage predicts LTV before 12 months of his
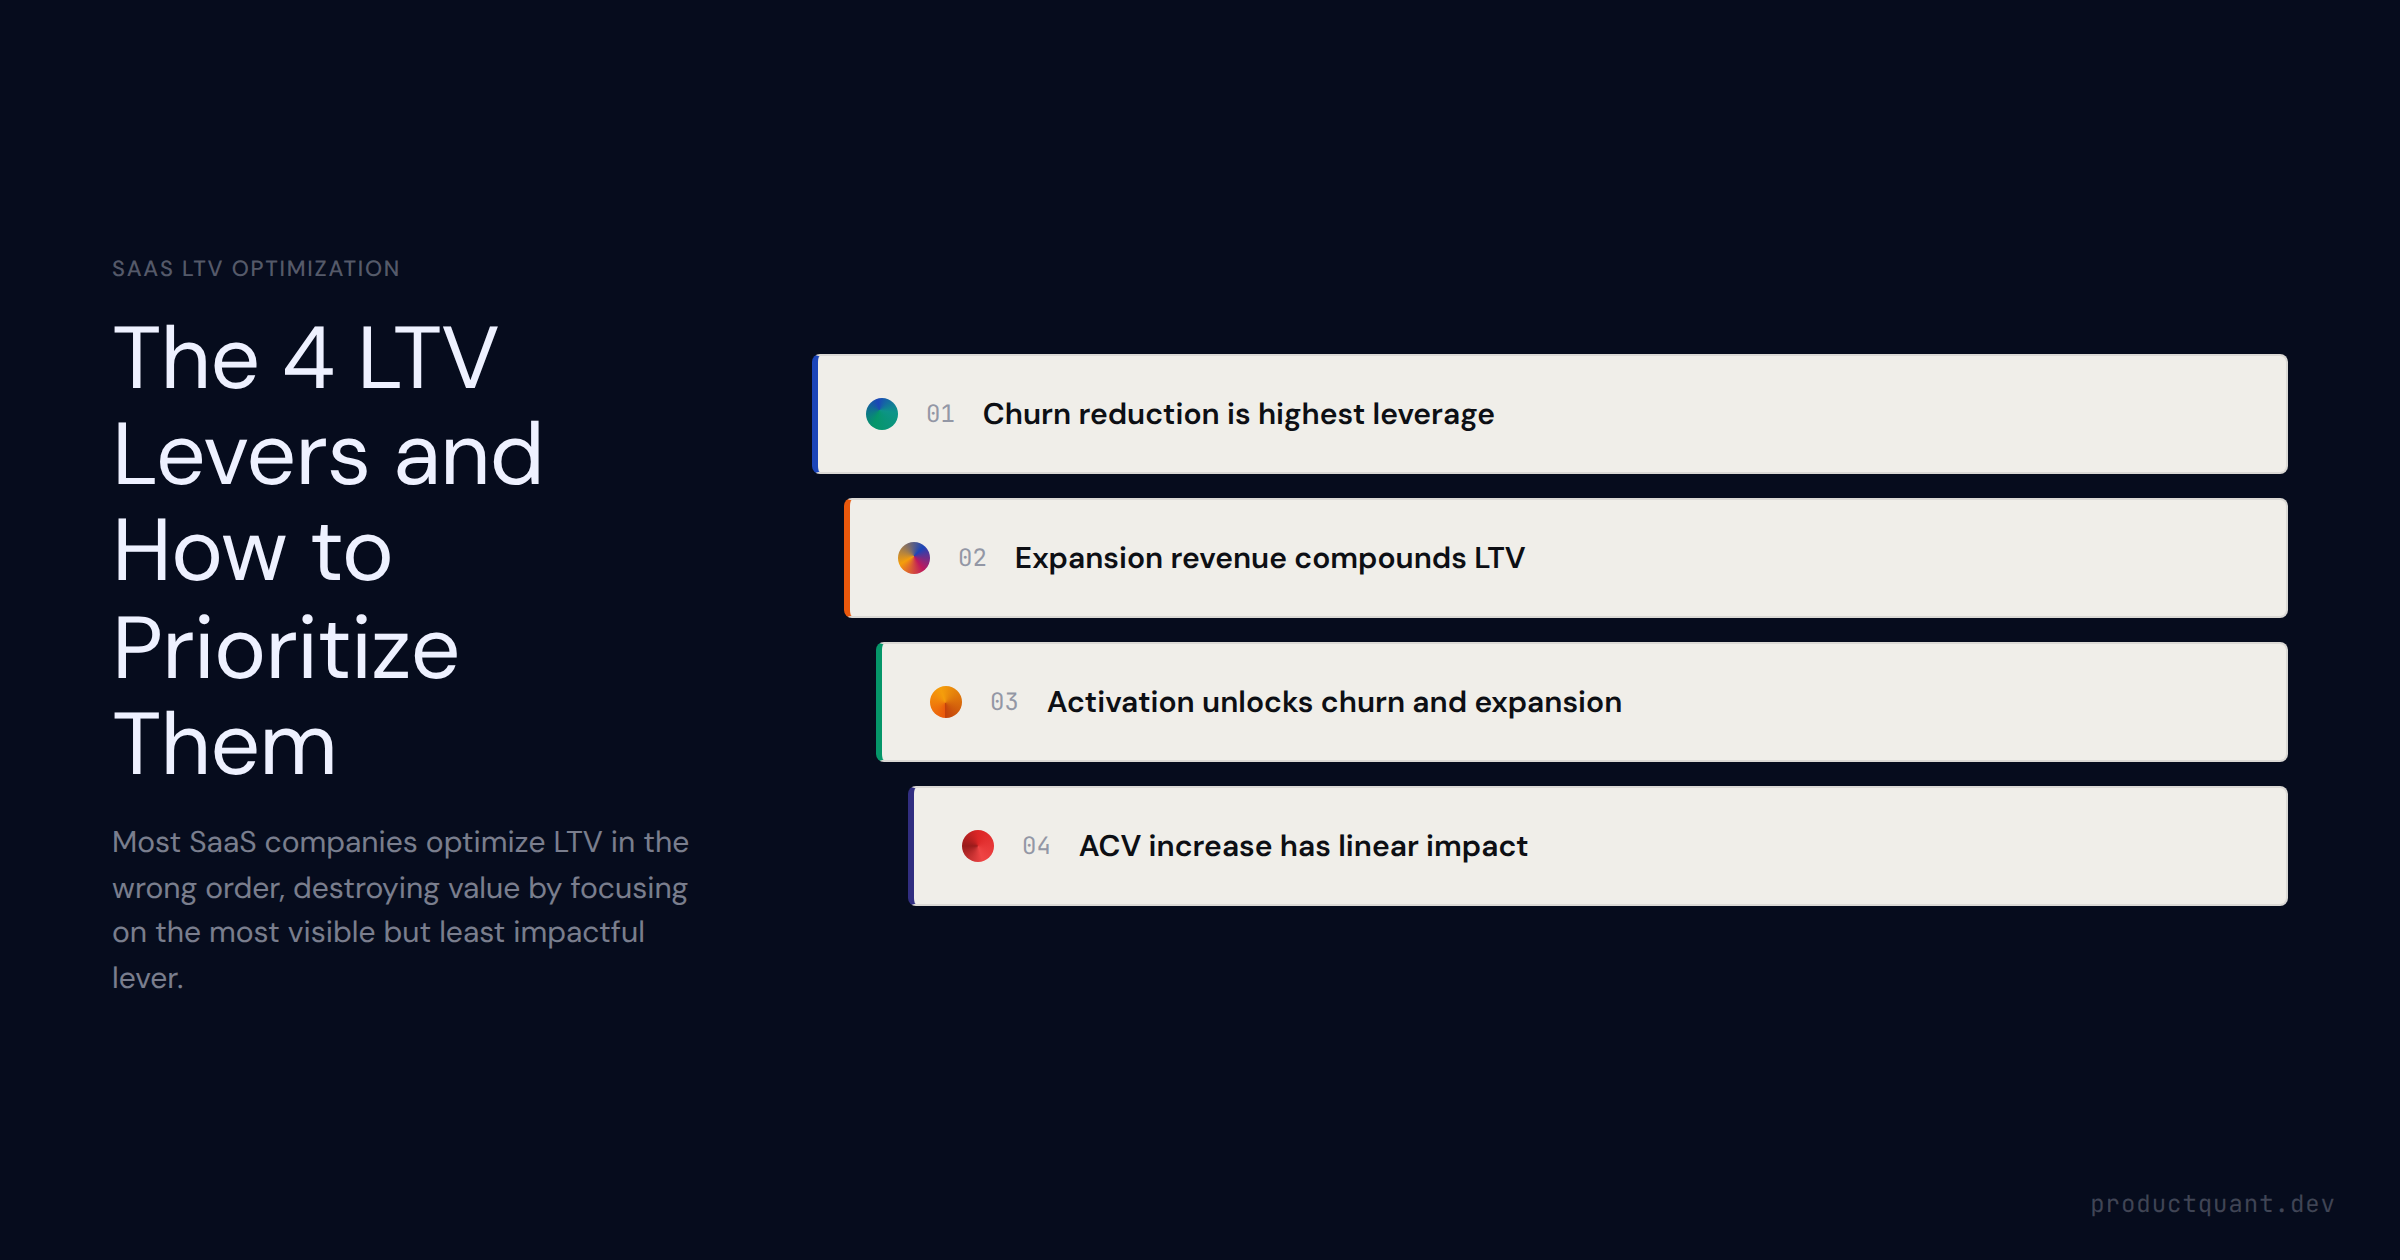
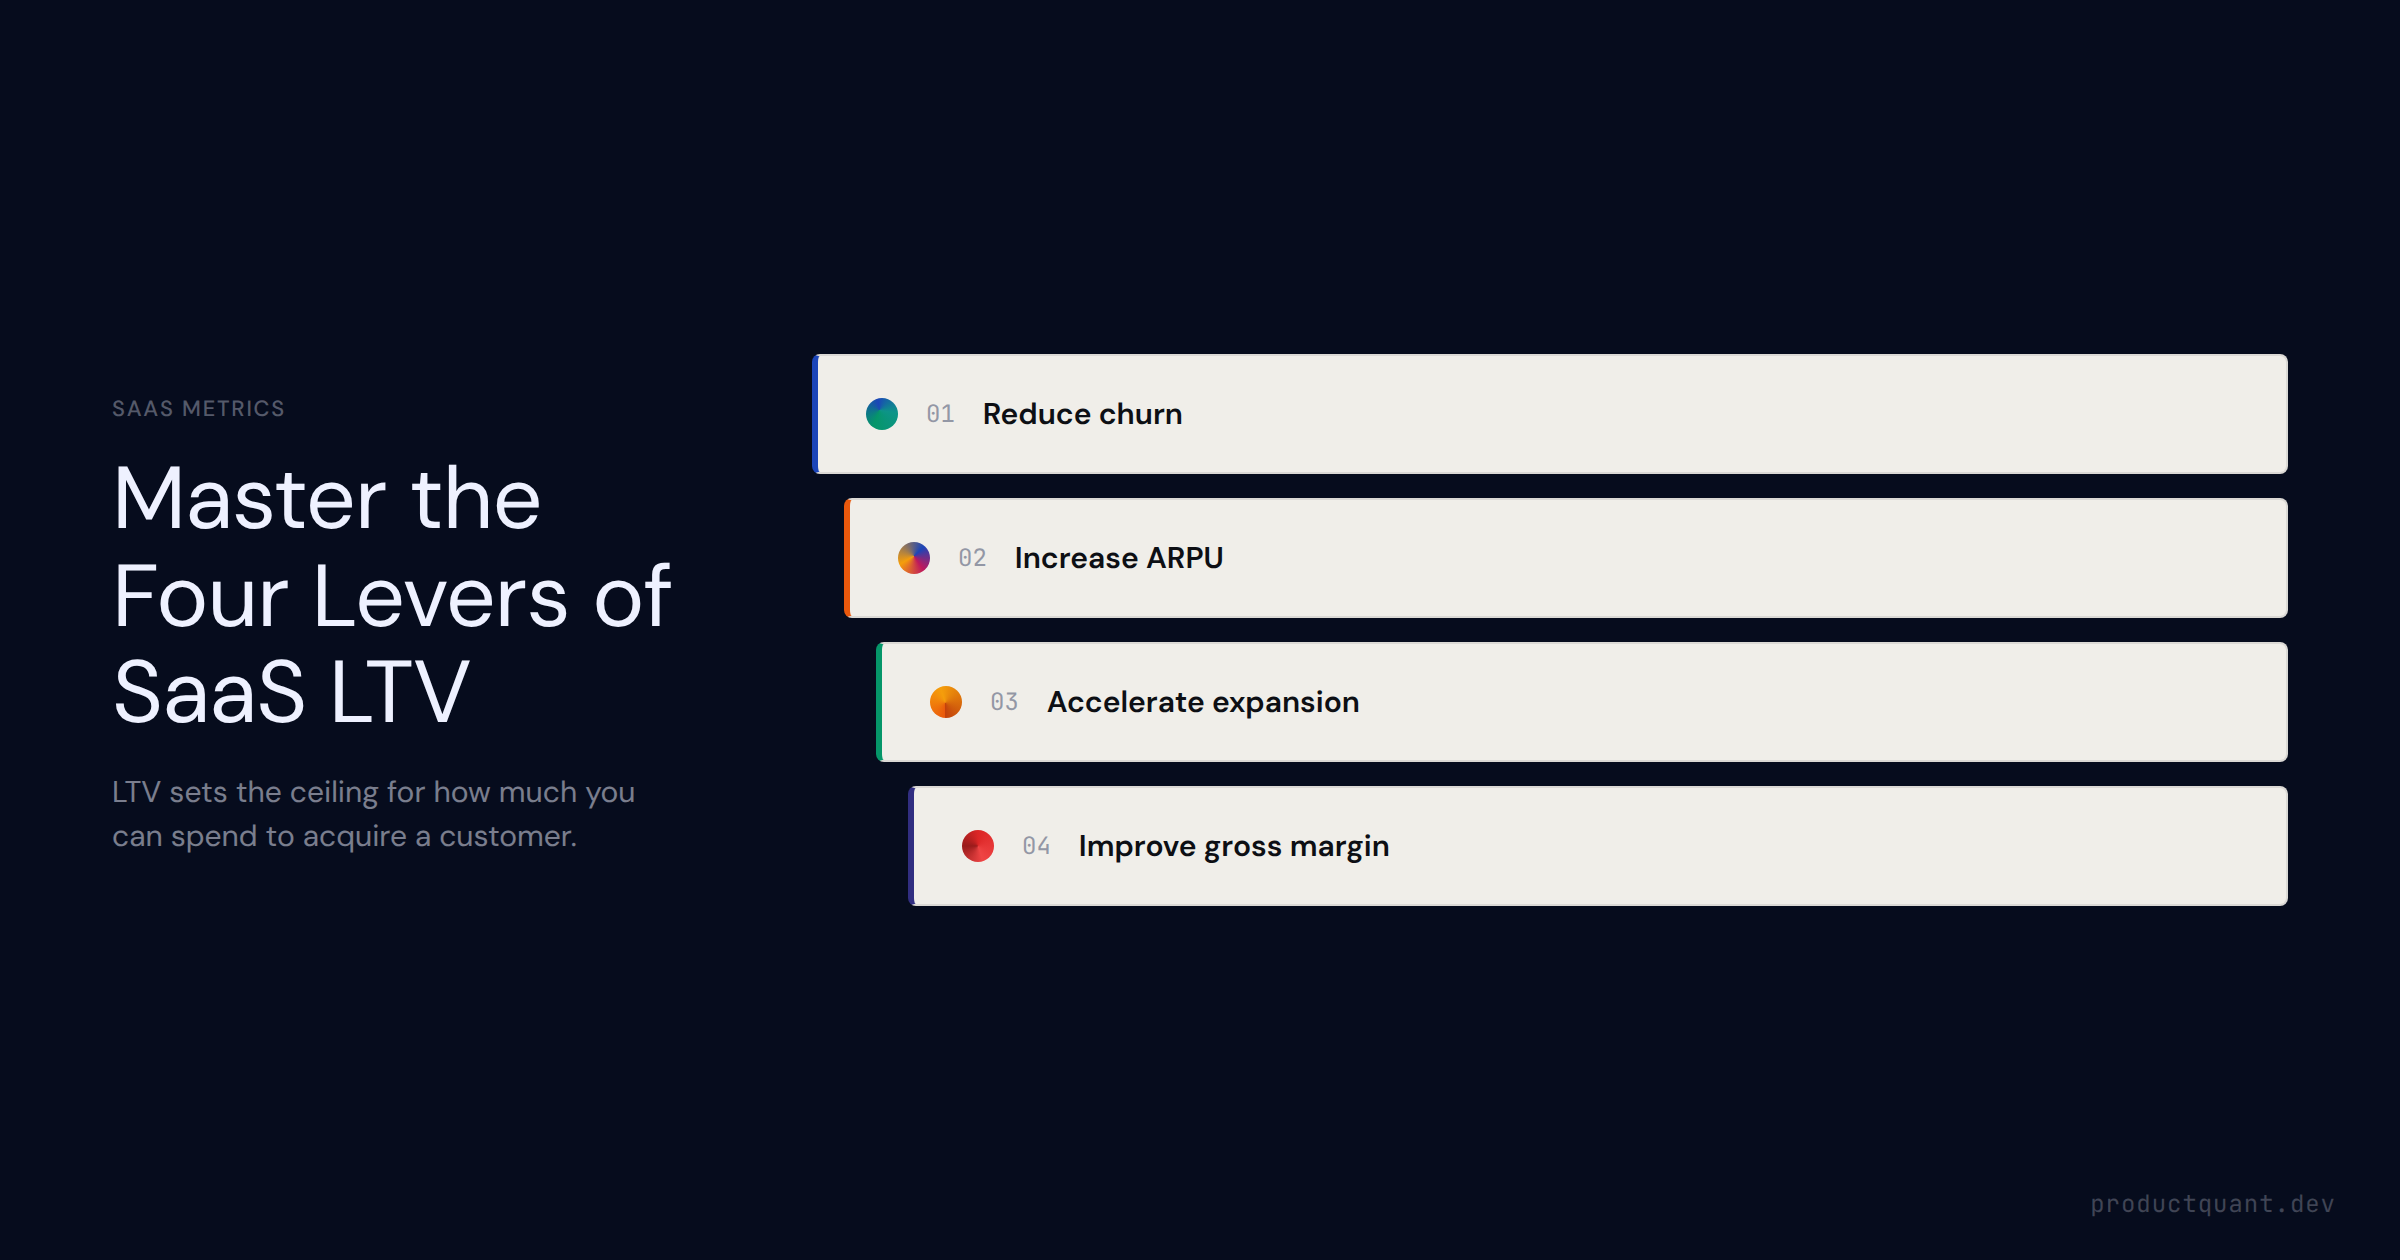
Churn reduction has 2–4x the LTV impact of equivalent expansion growth — yet most SaaS teams prioritize ACV at acquisition. Learn the 4 LTV levers, the impact hierarchy, and how product usage instrumentation tells you wh
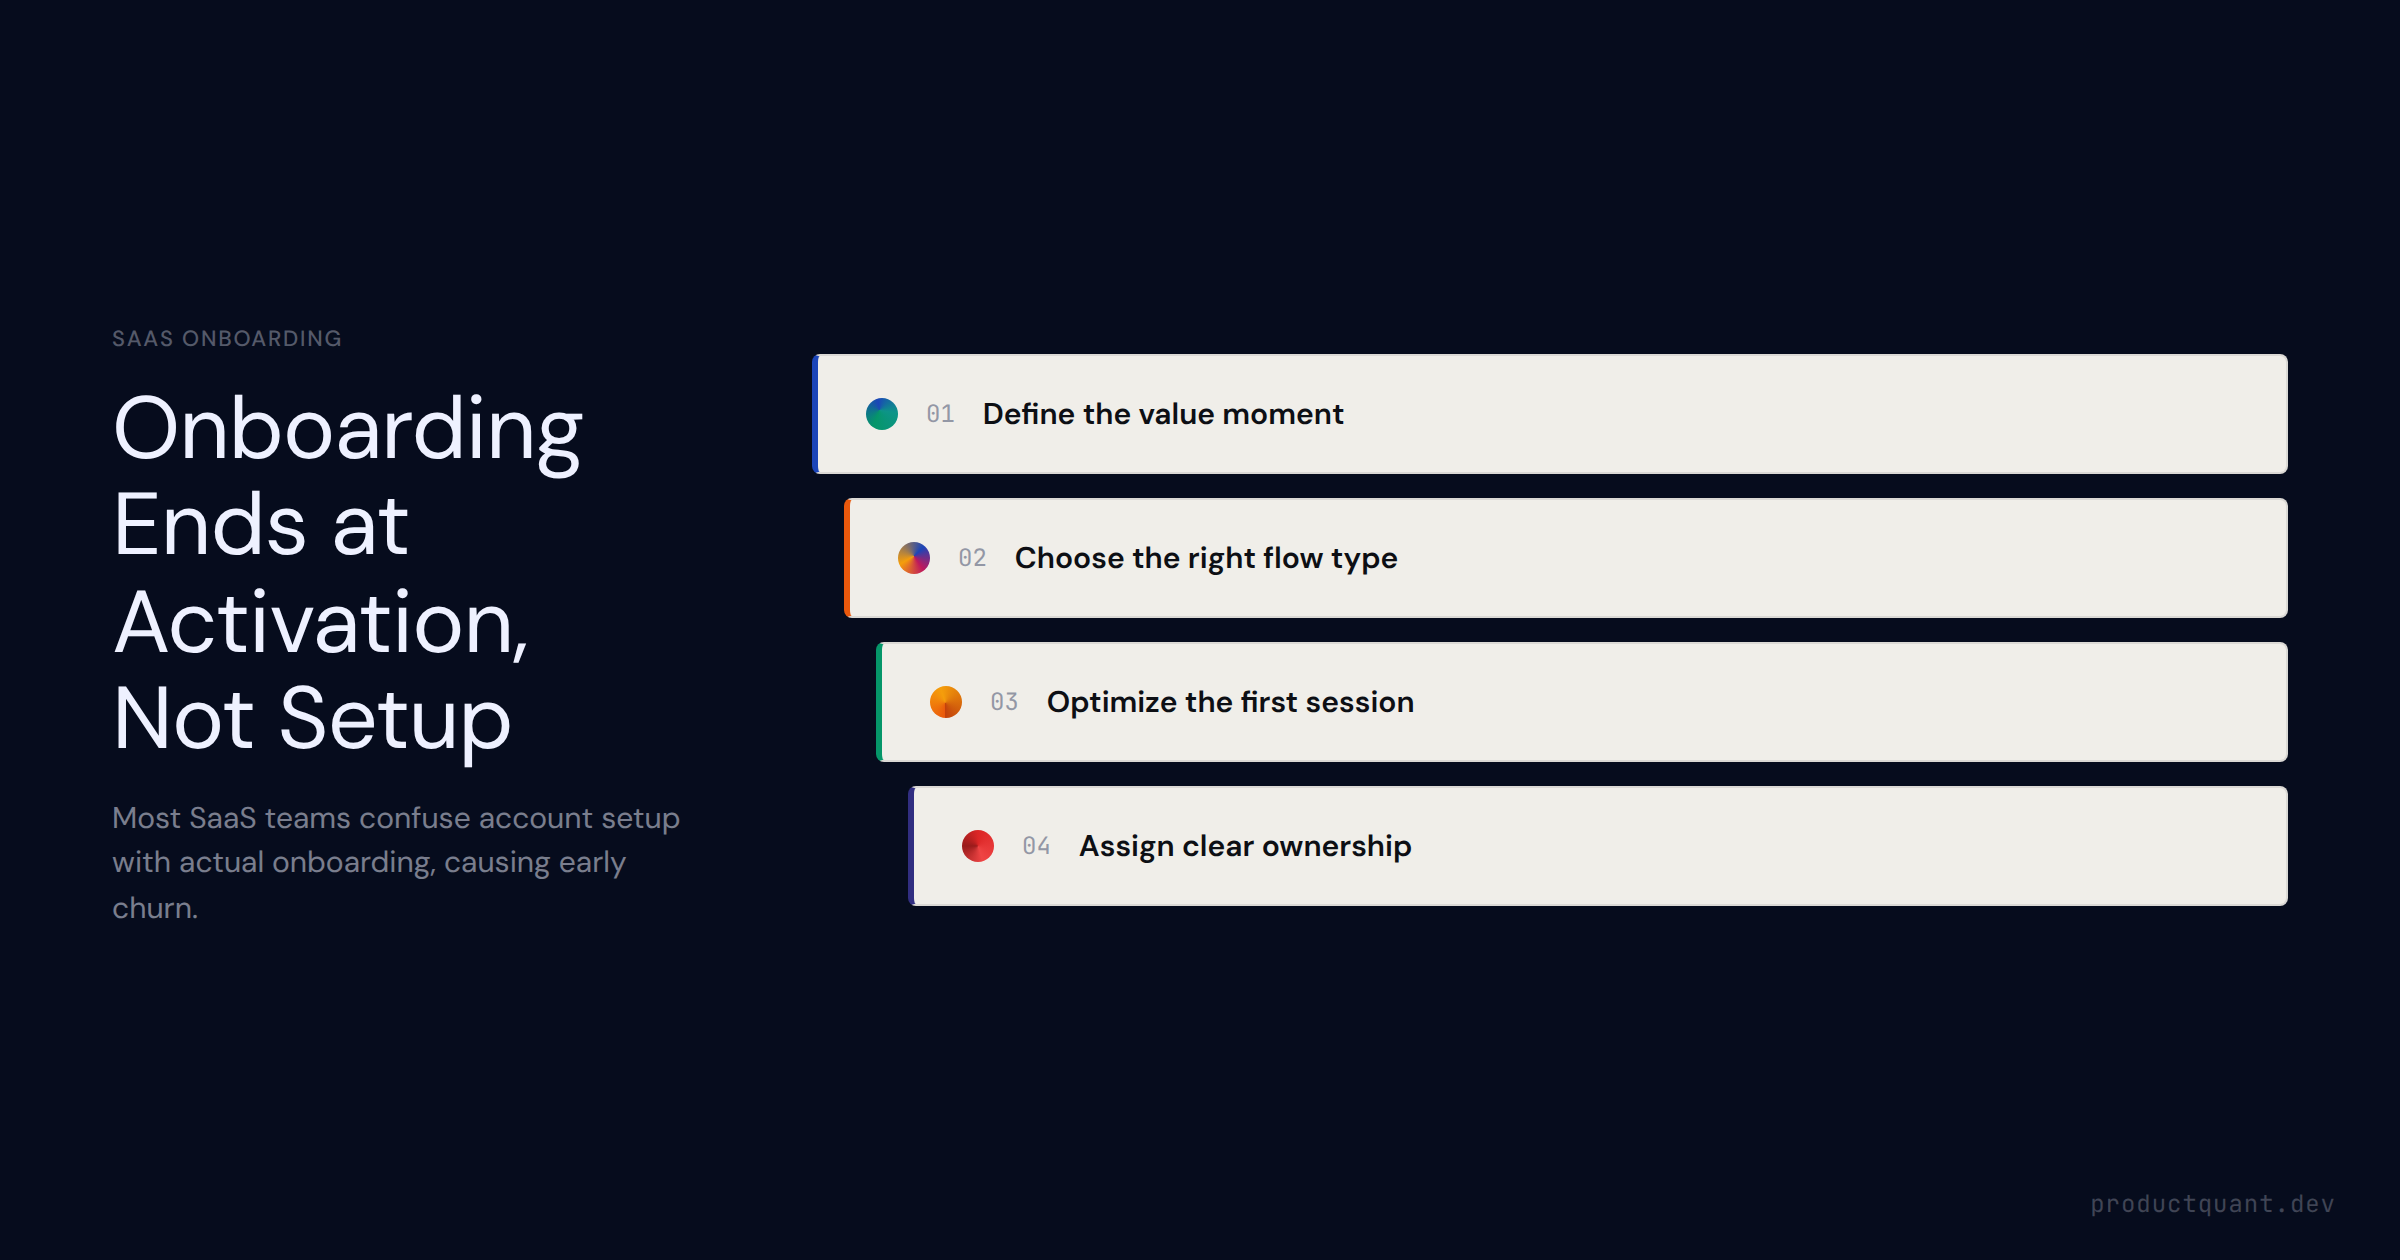
How to design a SaaS onboarding flow that drives activation — covering value moment identification, four onboarding flow types, first-session experience design, the 14-day activation window, and who should own onboarding
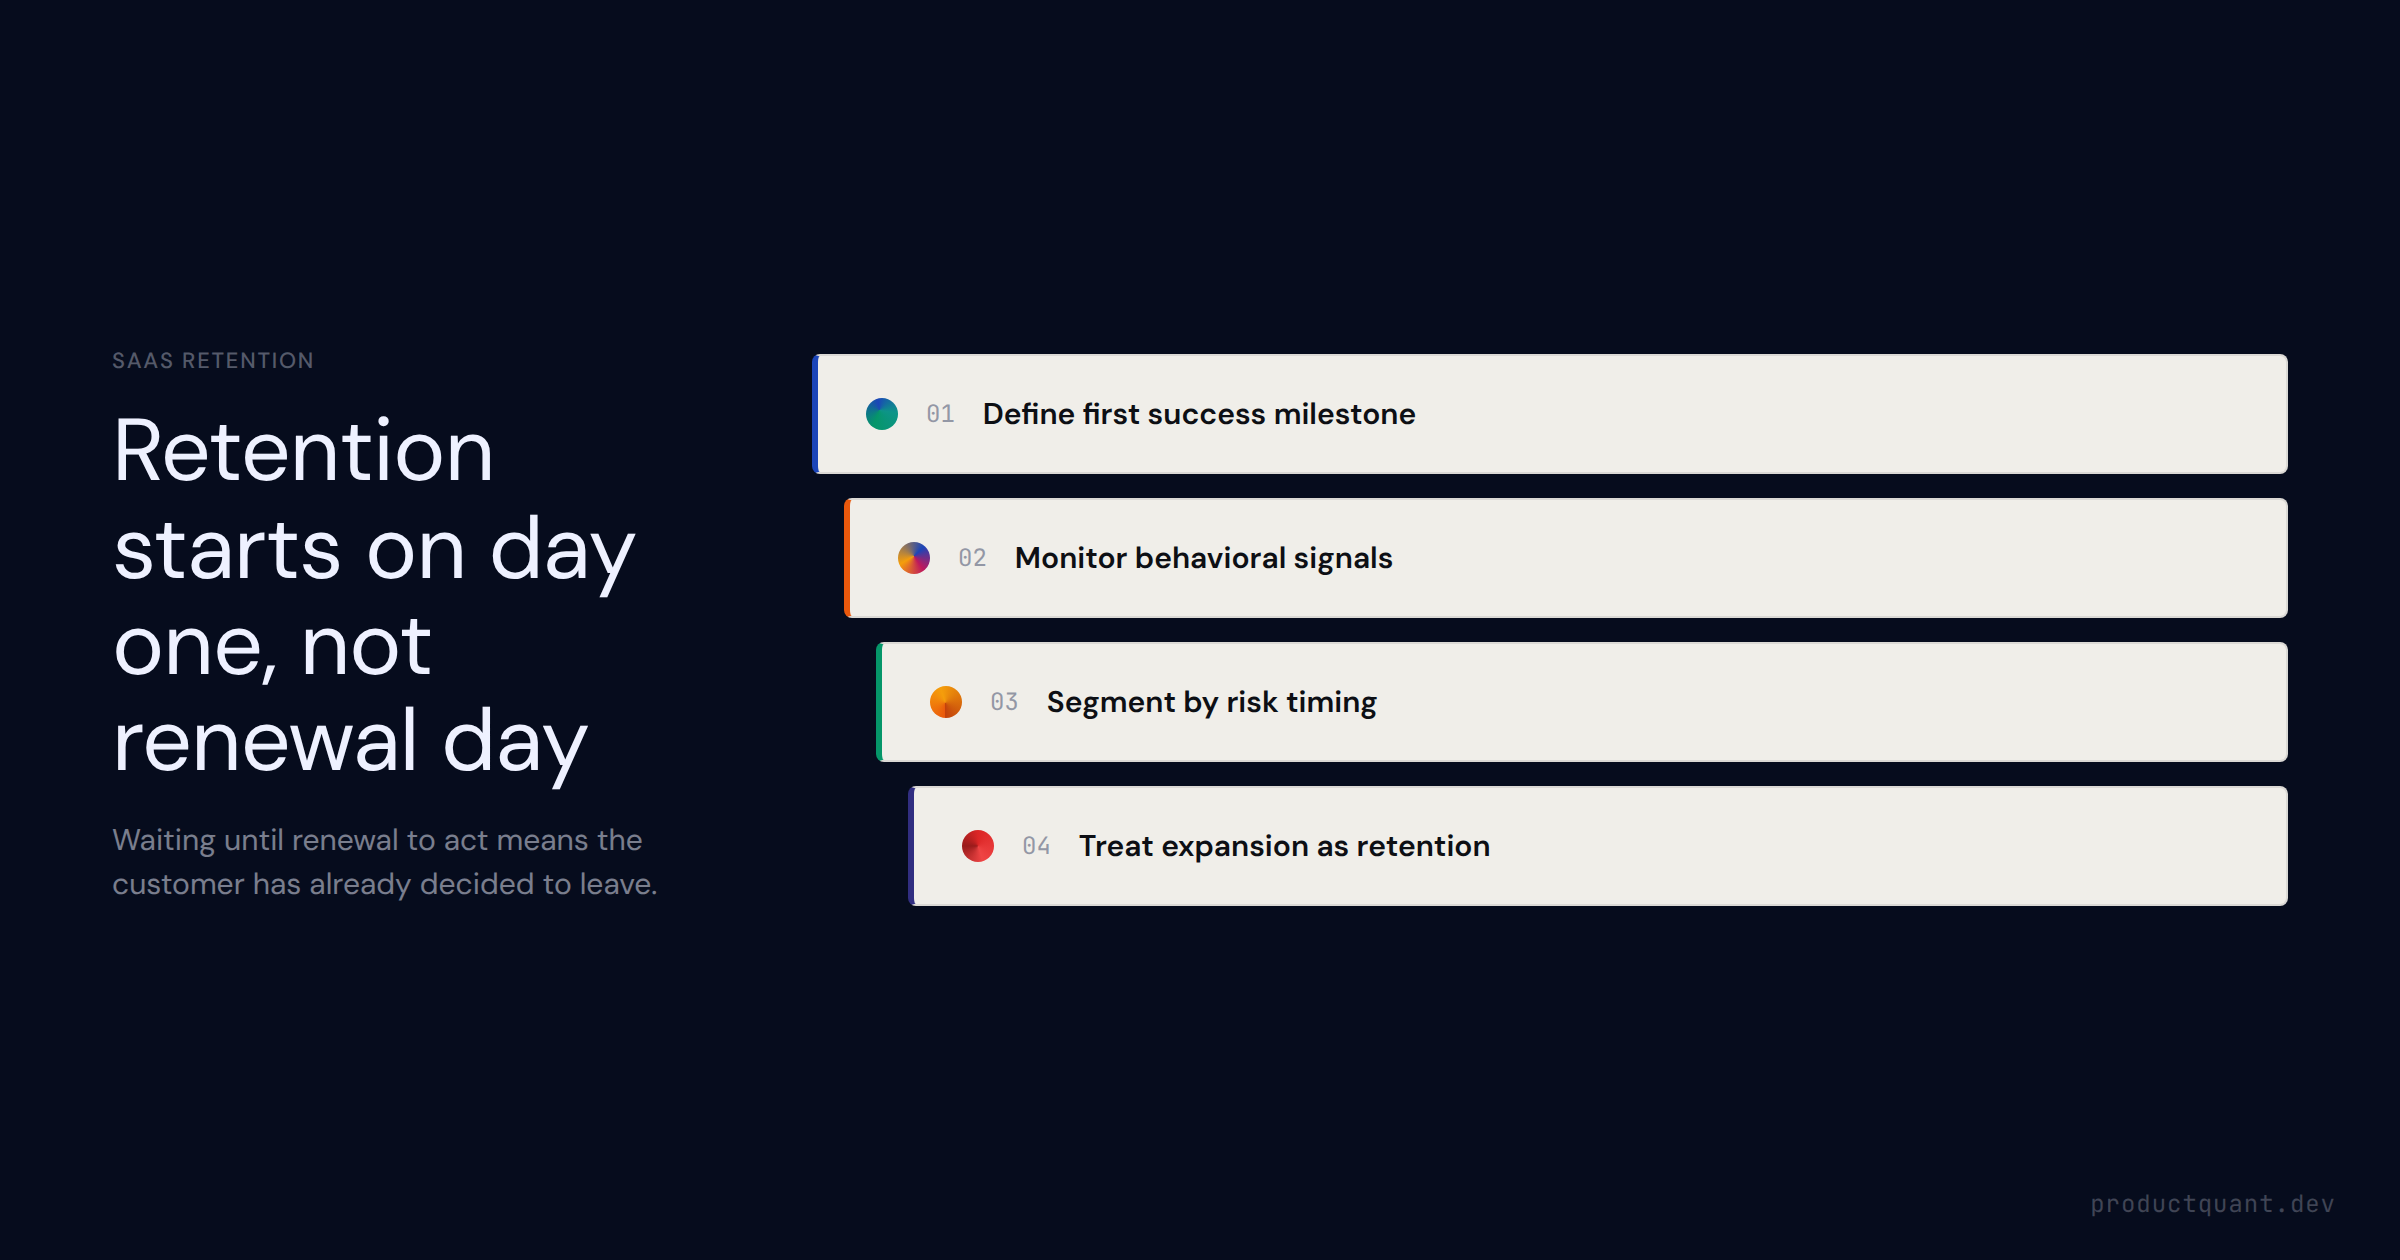
The concrete strategies SaaS companies use to retain customers — from onboarding completion through renewal. Covers early-warning systems, success milestones, QBR design, and the expansion-retention link.
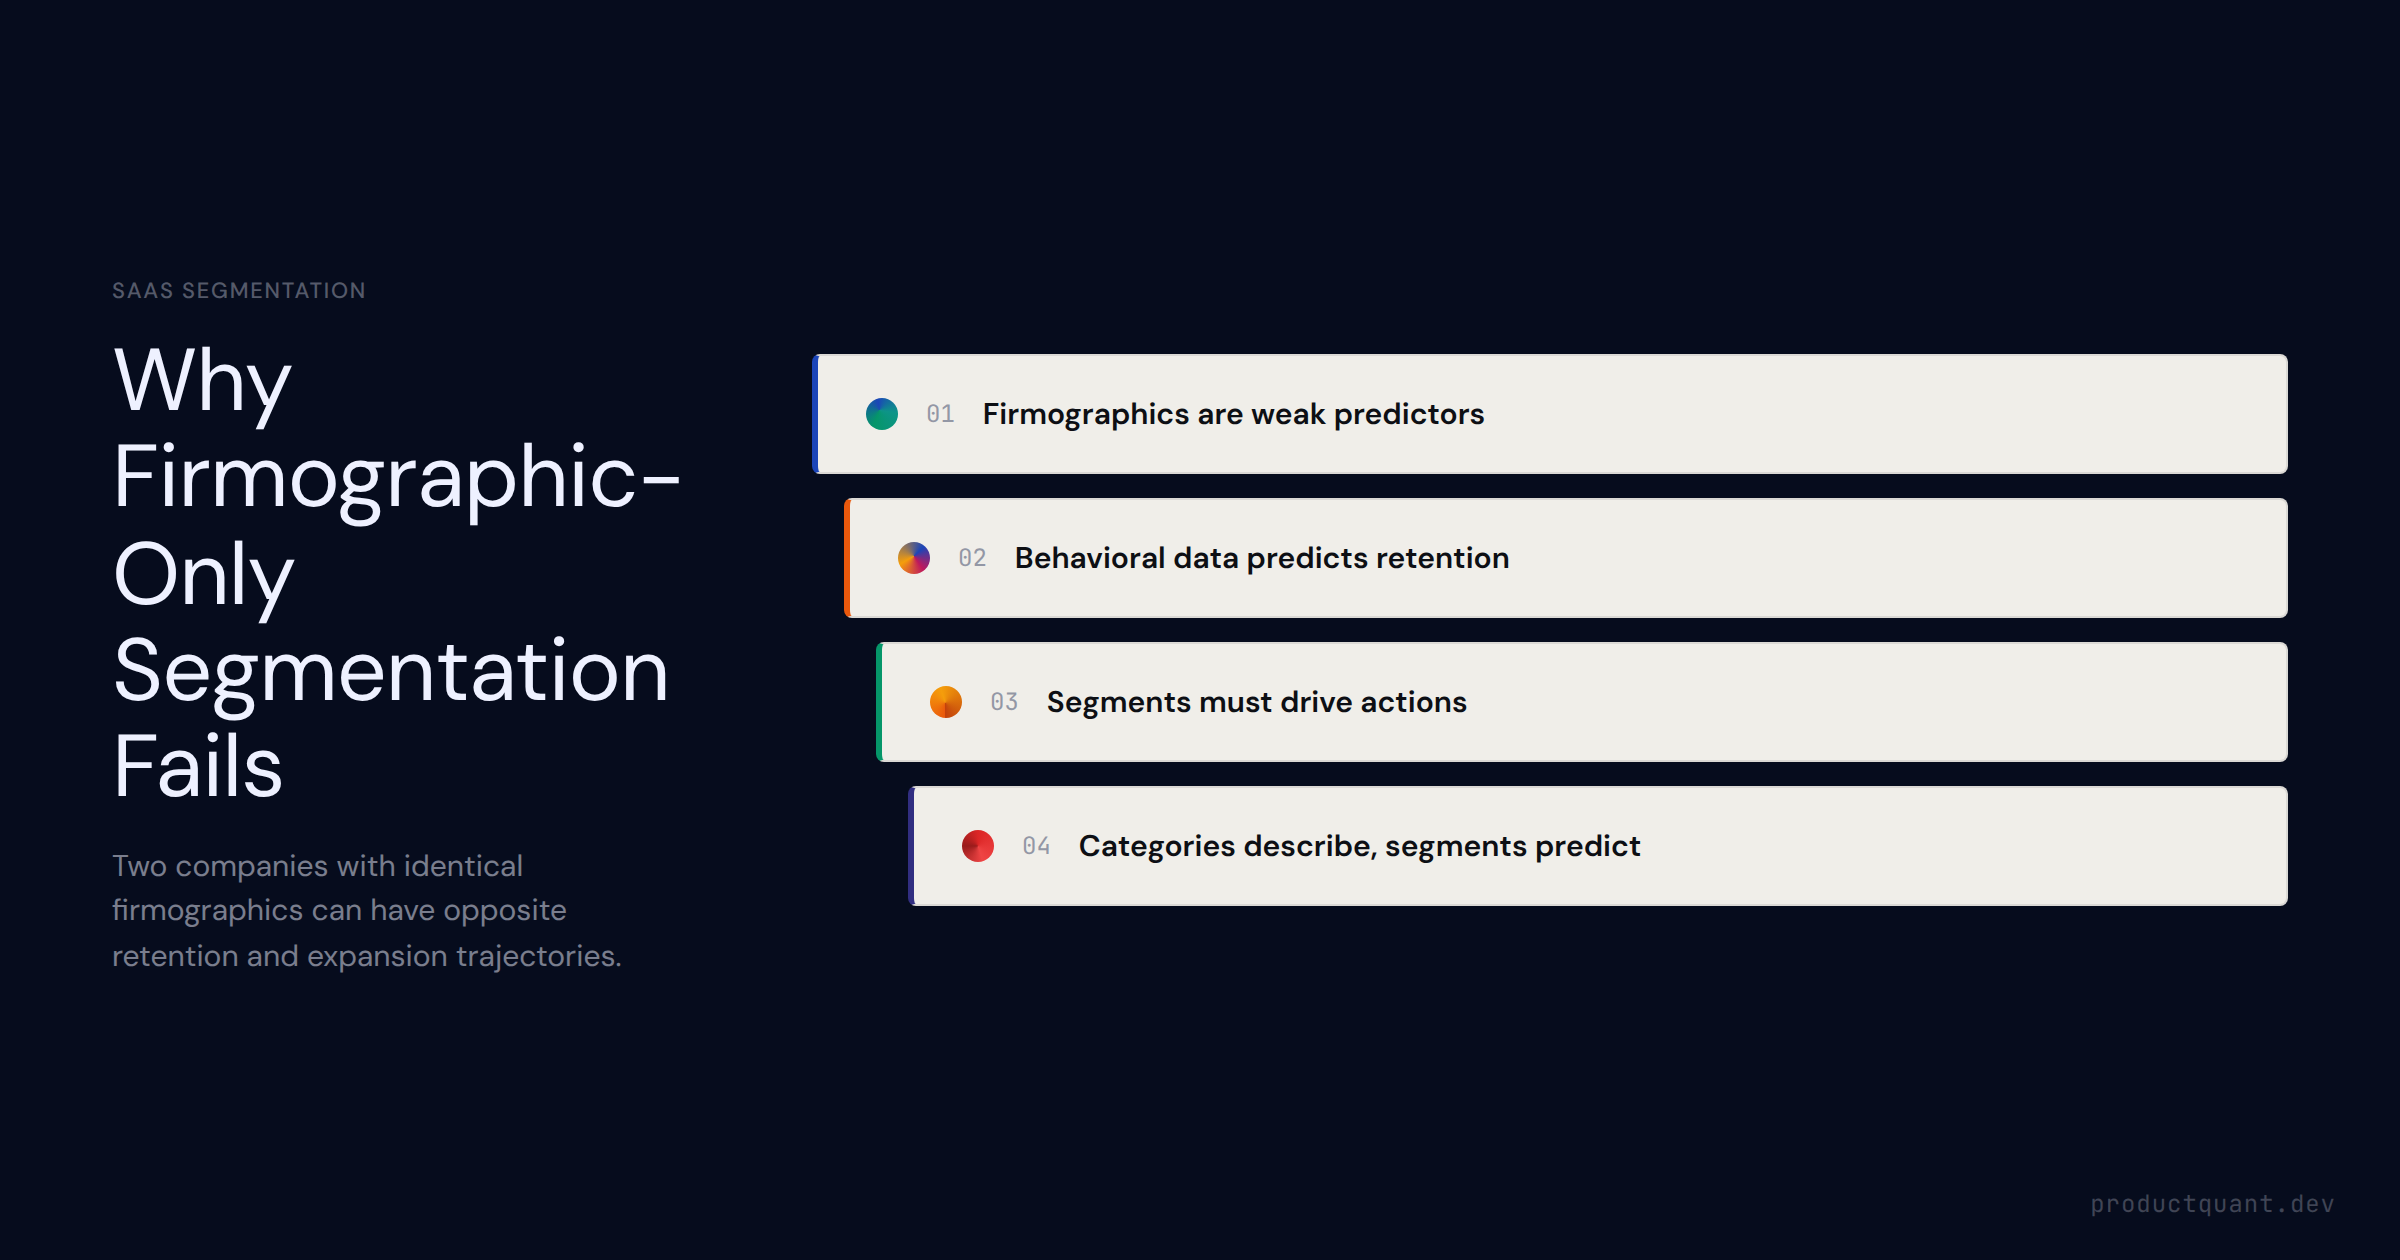
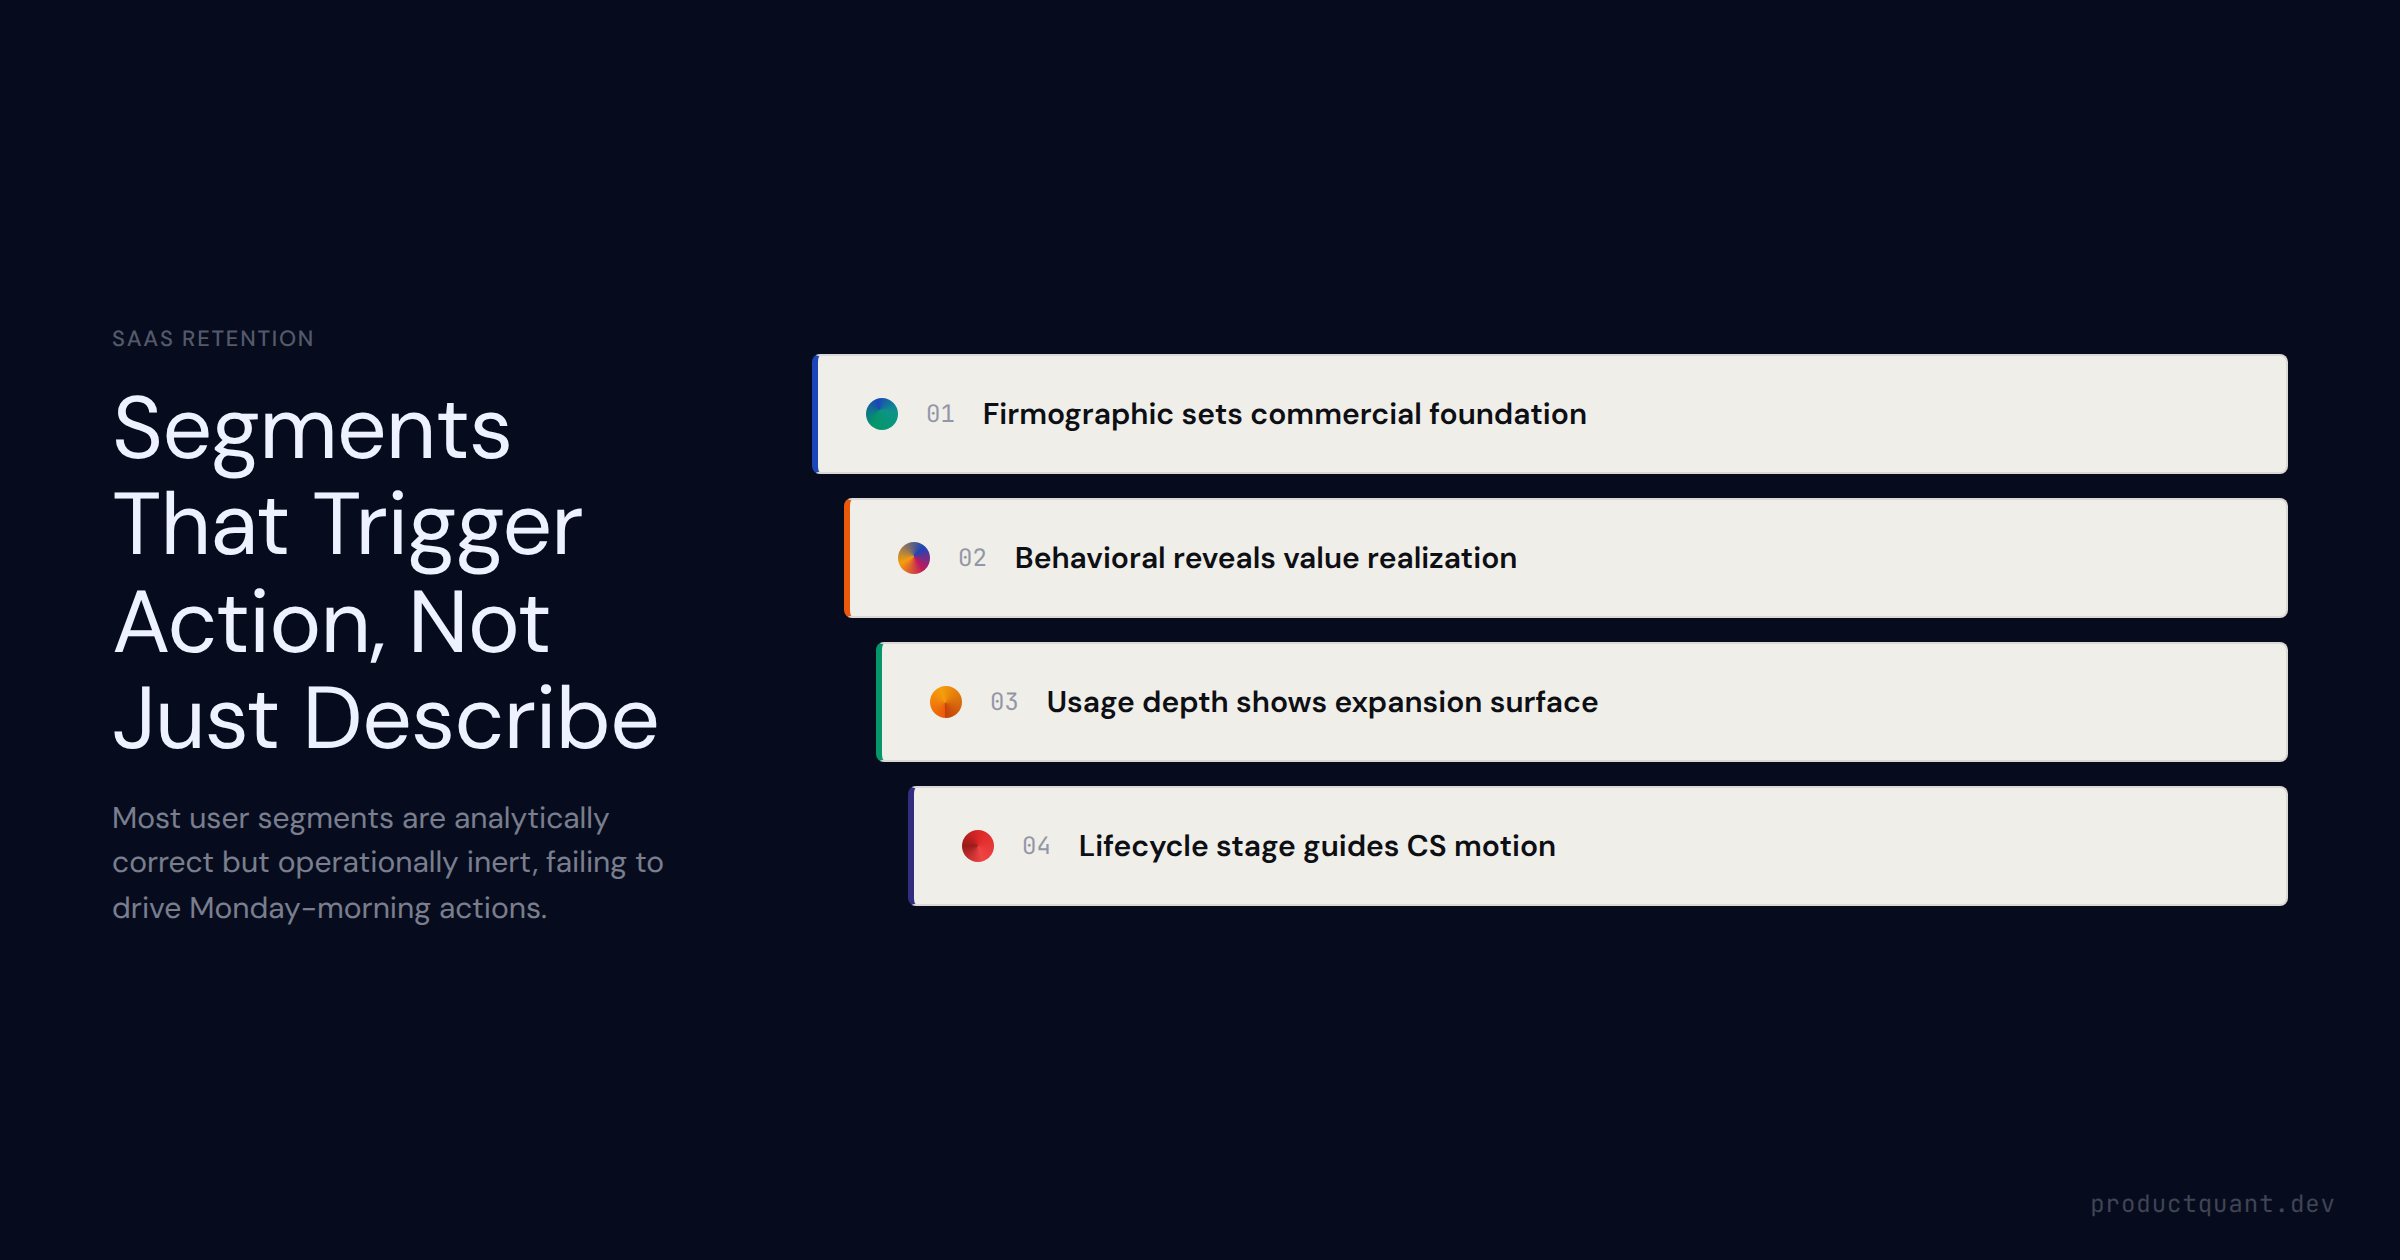
Most B2B SaaS segmentation stops at firmographics. Two companies with identical headcount and industry can have opposite retention profiles. Here is how to build the behavioral layer that makes segmentation actionable.
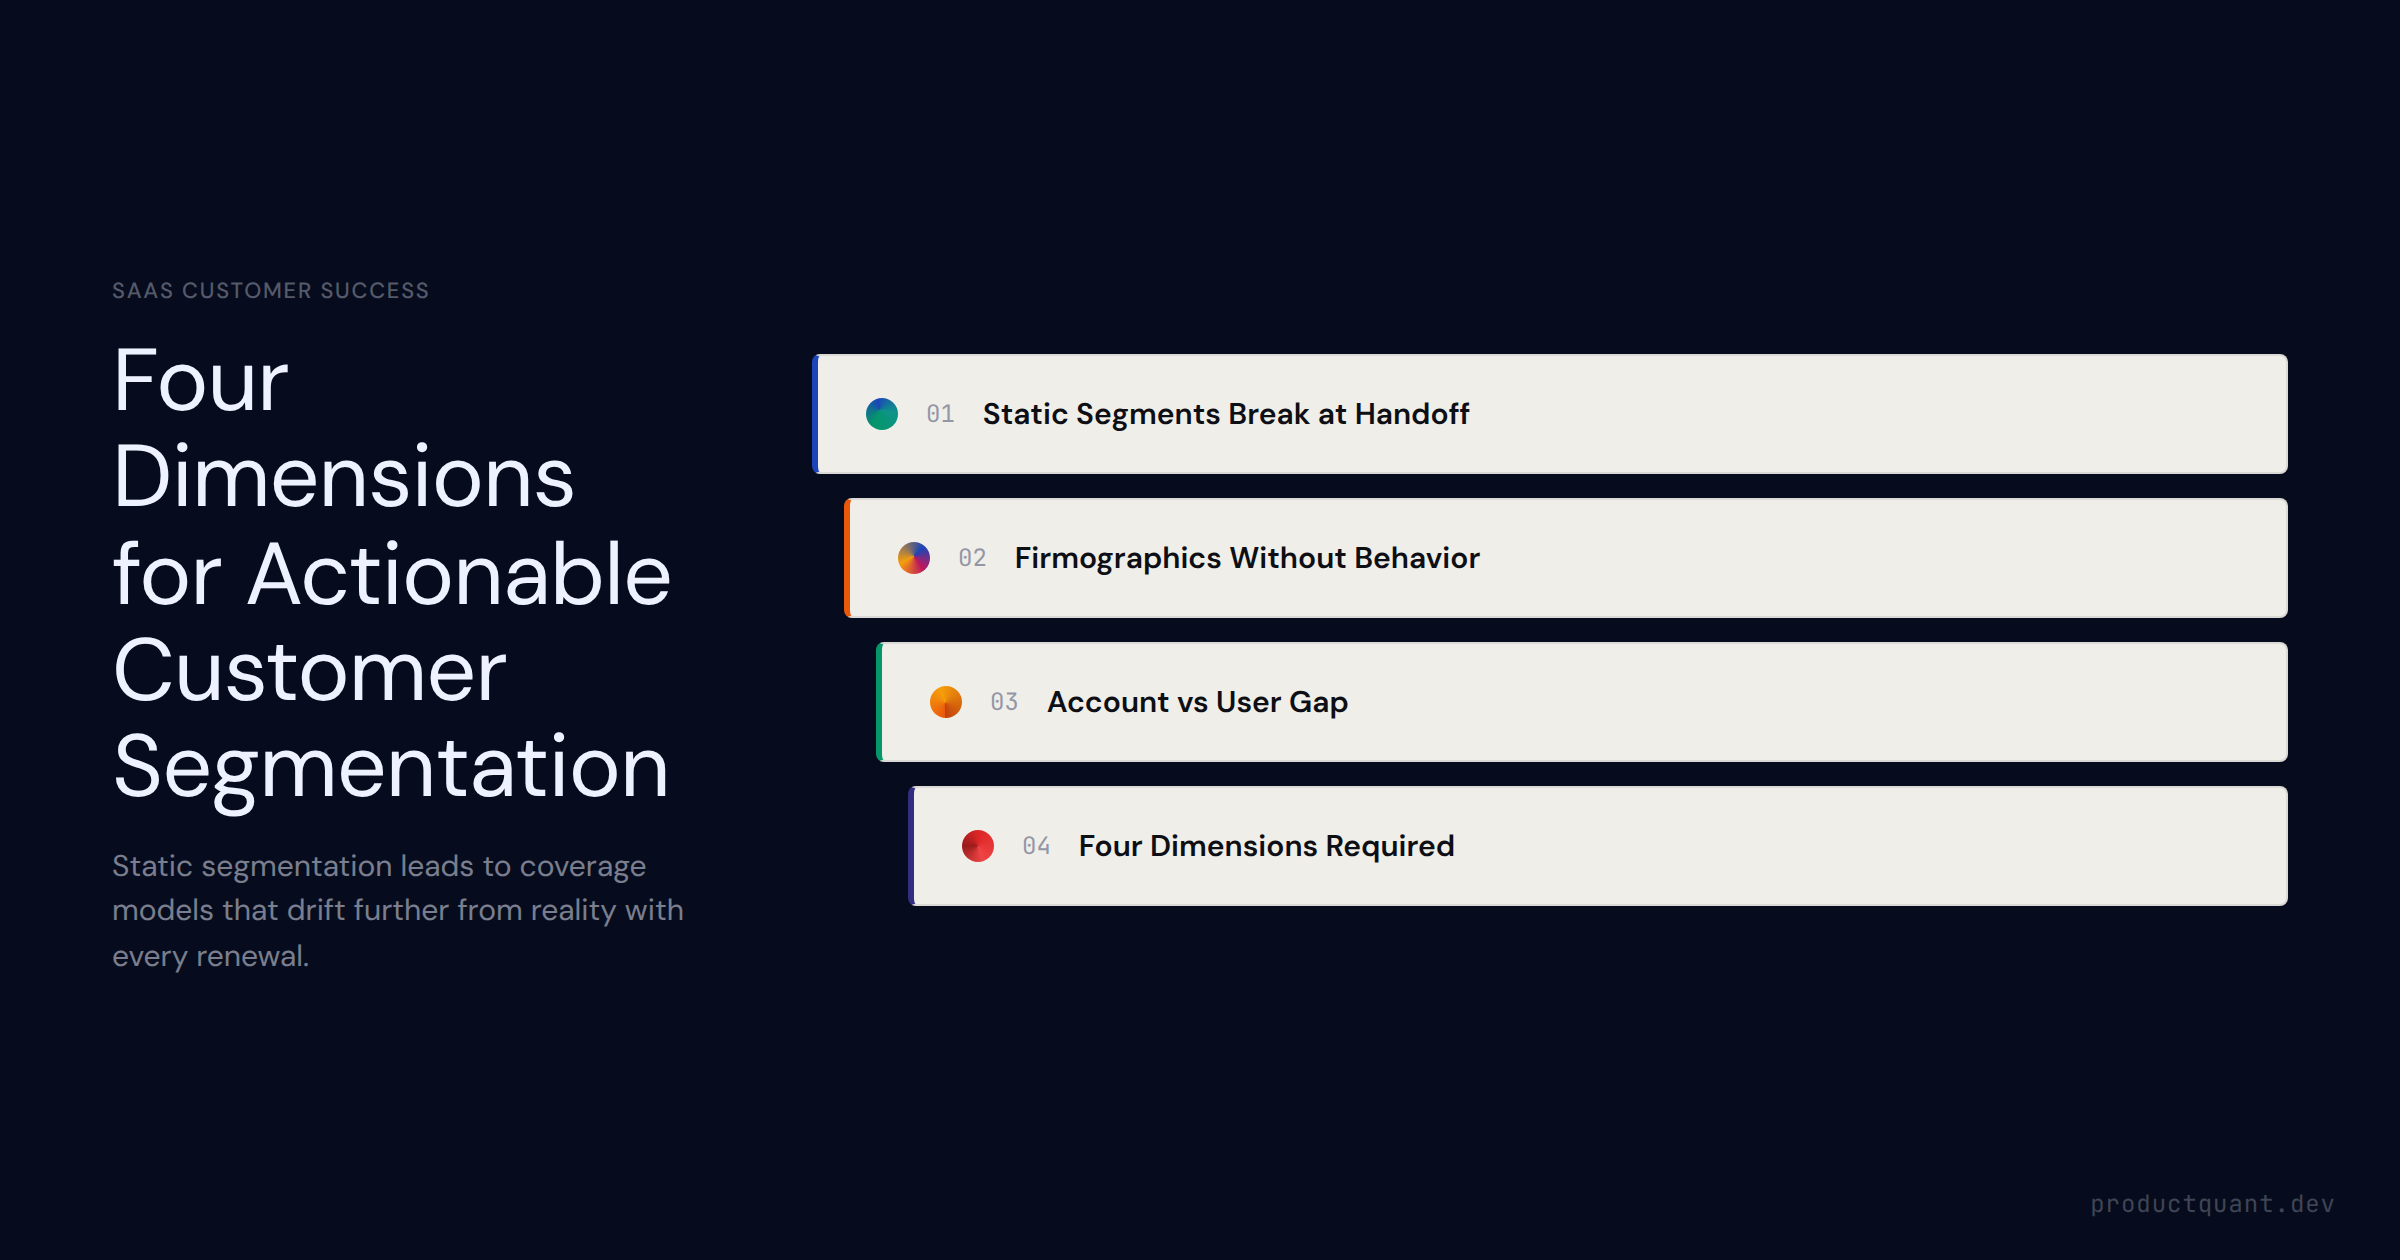
Most B2B SaaS teams segment once and never update. This guide covers the four segmentation dimensions — firmographic, behavioral, lifecycle, and health-score — and how to combine them into a dynamic model that drives CS
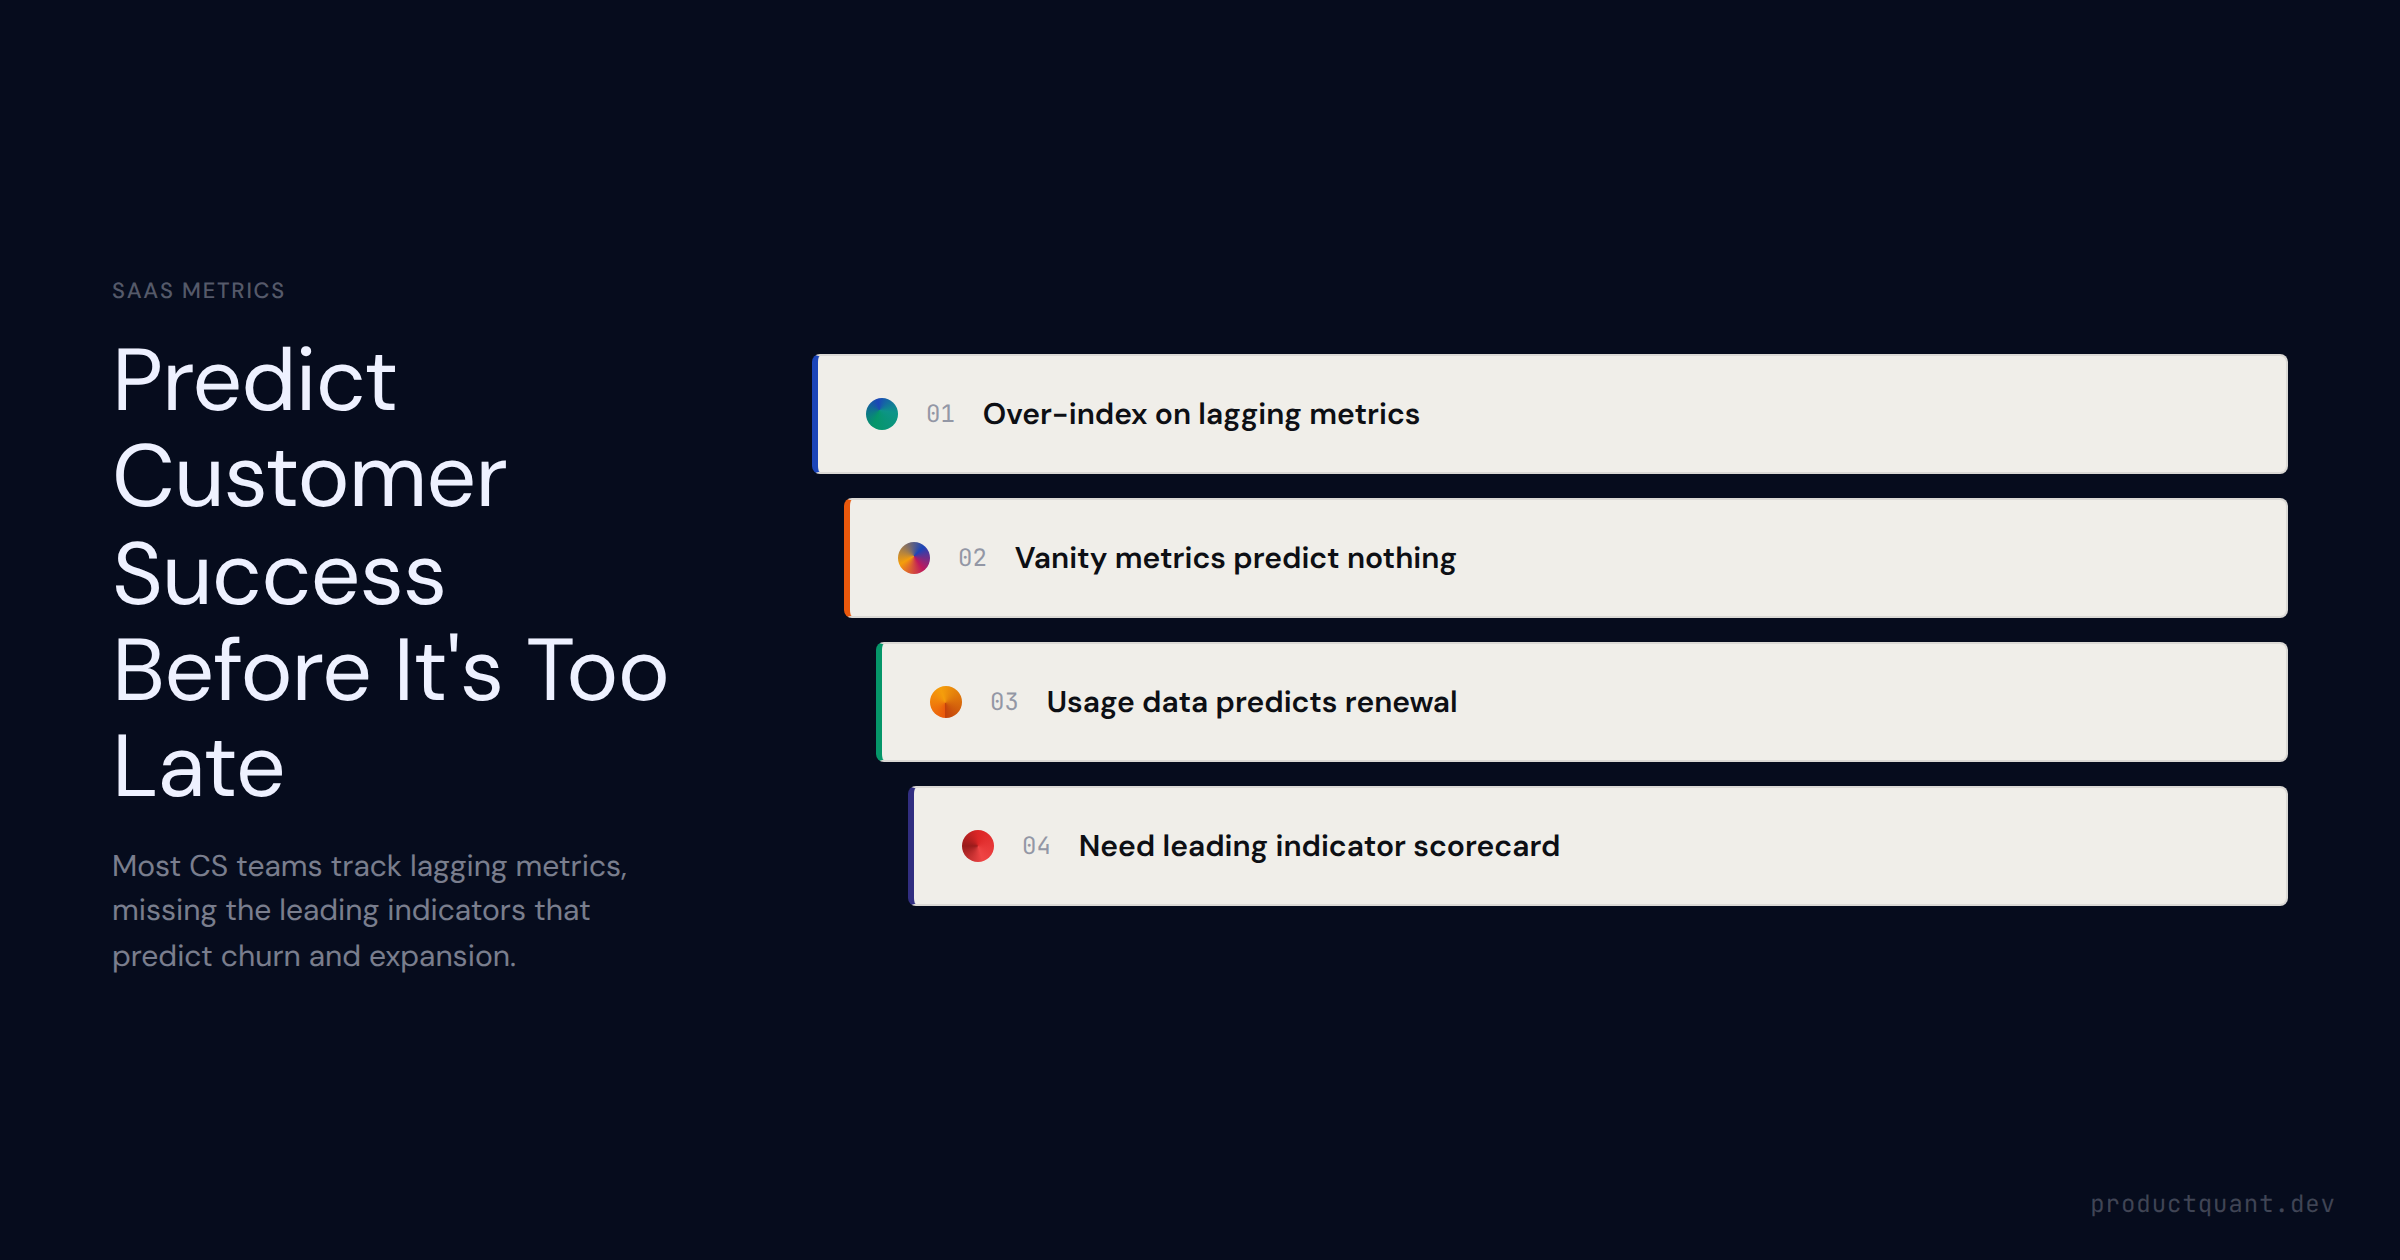
The 6 CS metrics that separate outcome measurement from vanity tracking — GRR, NRR, CSAT, CES, time-to-value, and CS-qualified pipeline. How to build a CS scorecard with leading and lagging indicators, and why CS product
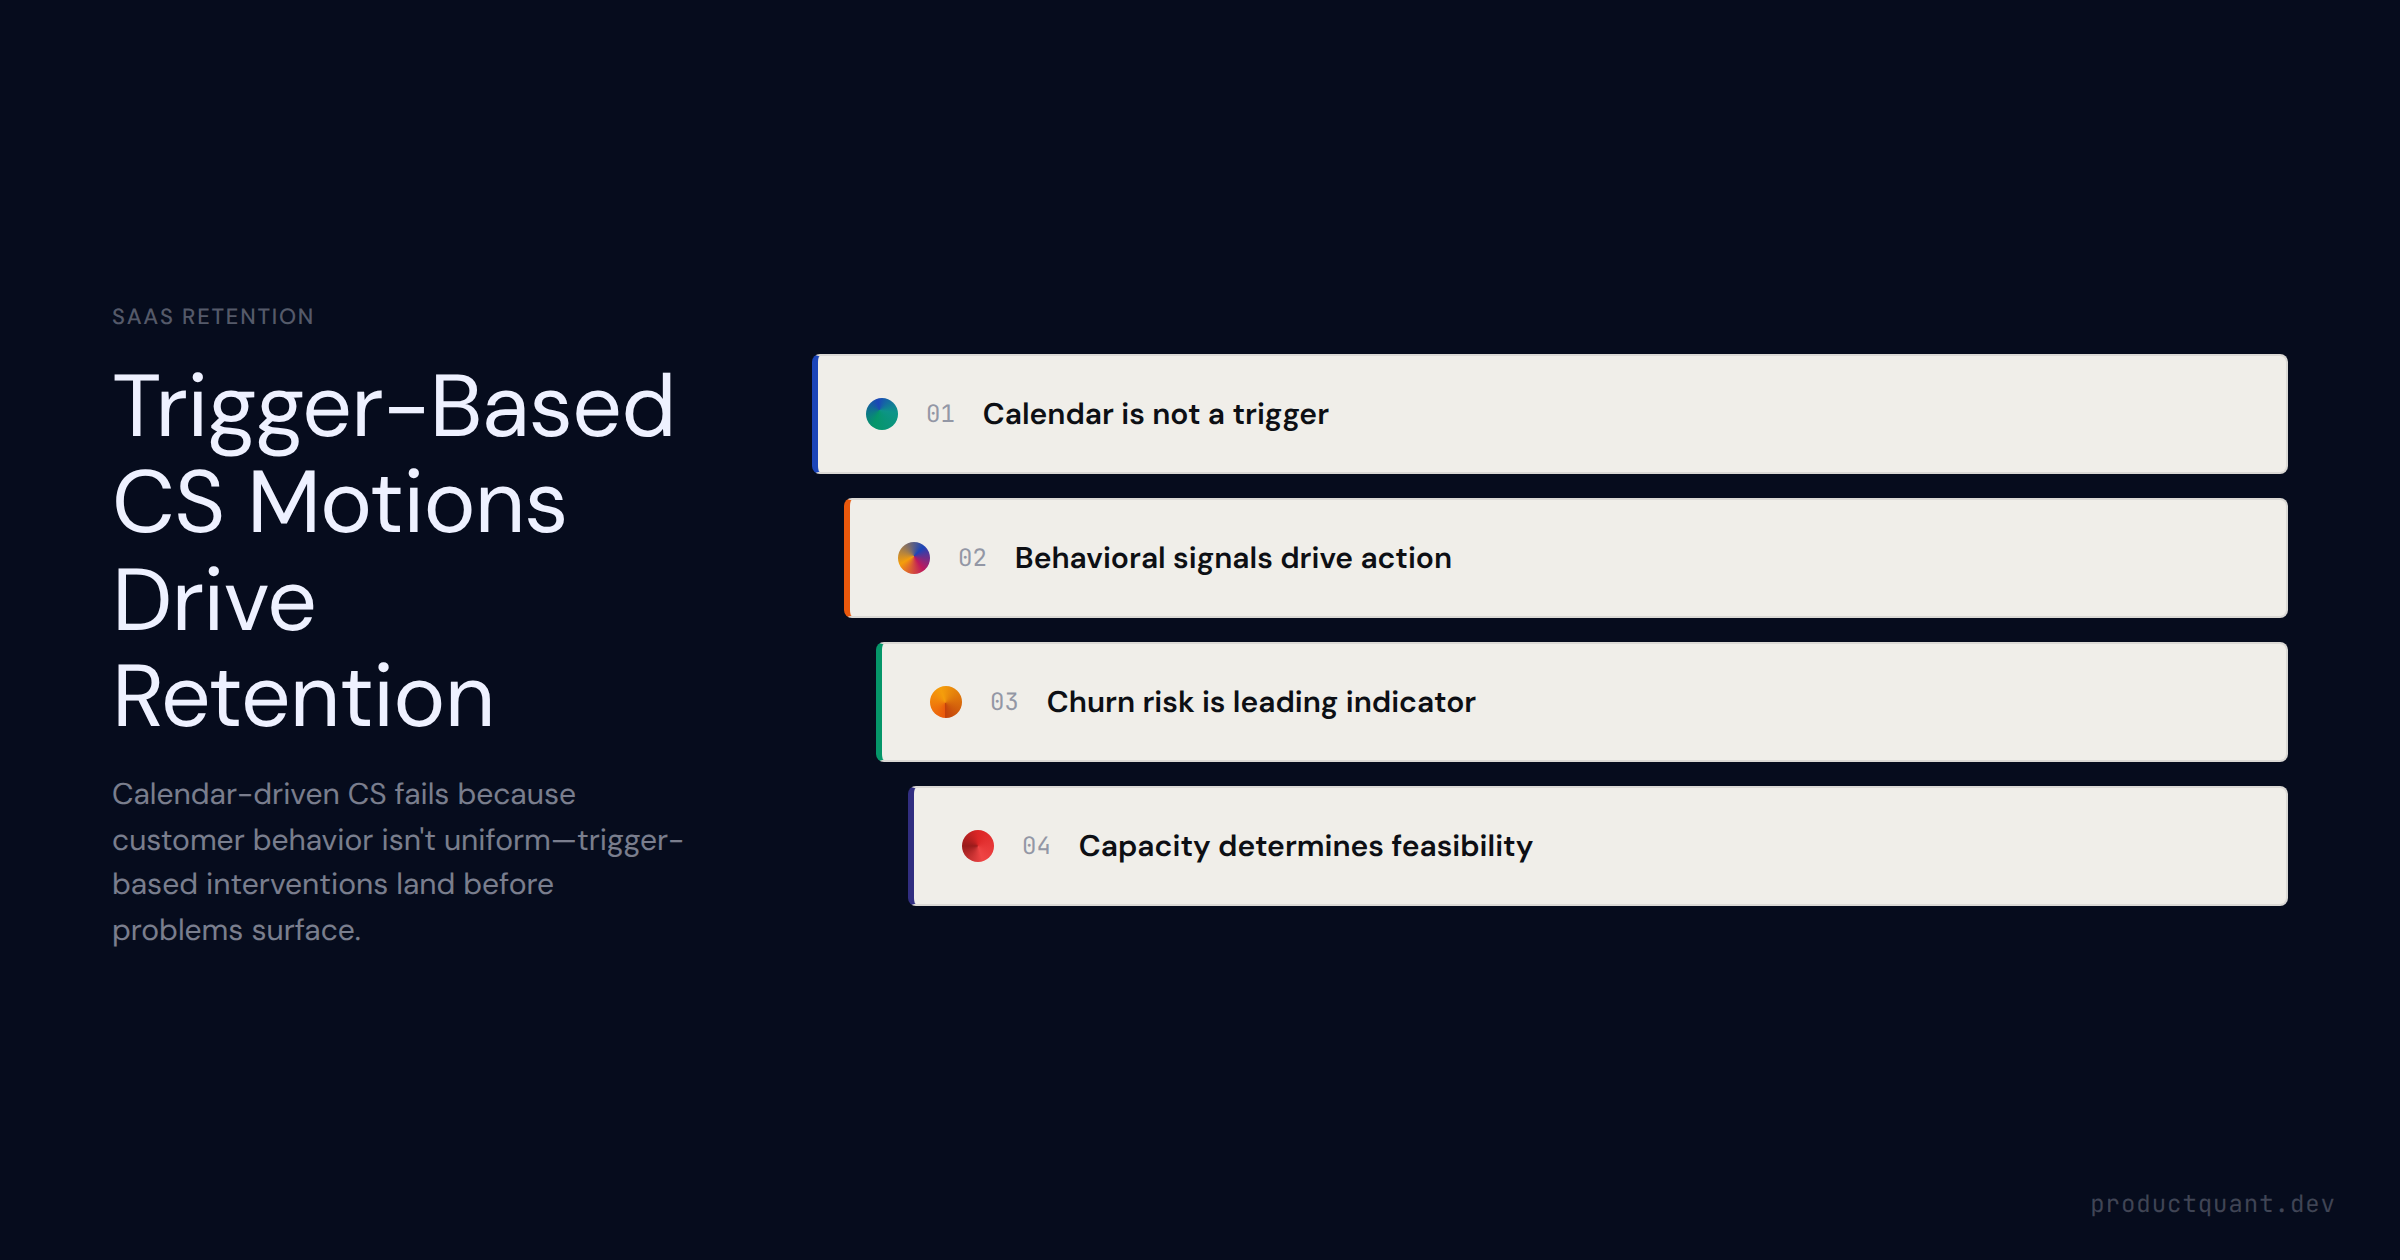
Most CS playbooks are calendar-driven. This guide covers the trigger-based CS motion — onboarding, adoption, expansion, renewal, churn risk — plus CSM capacity models and the signal layer that makes interventions timely.
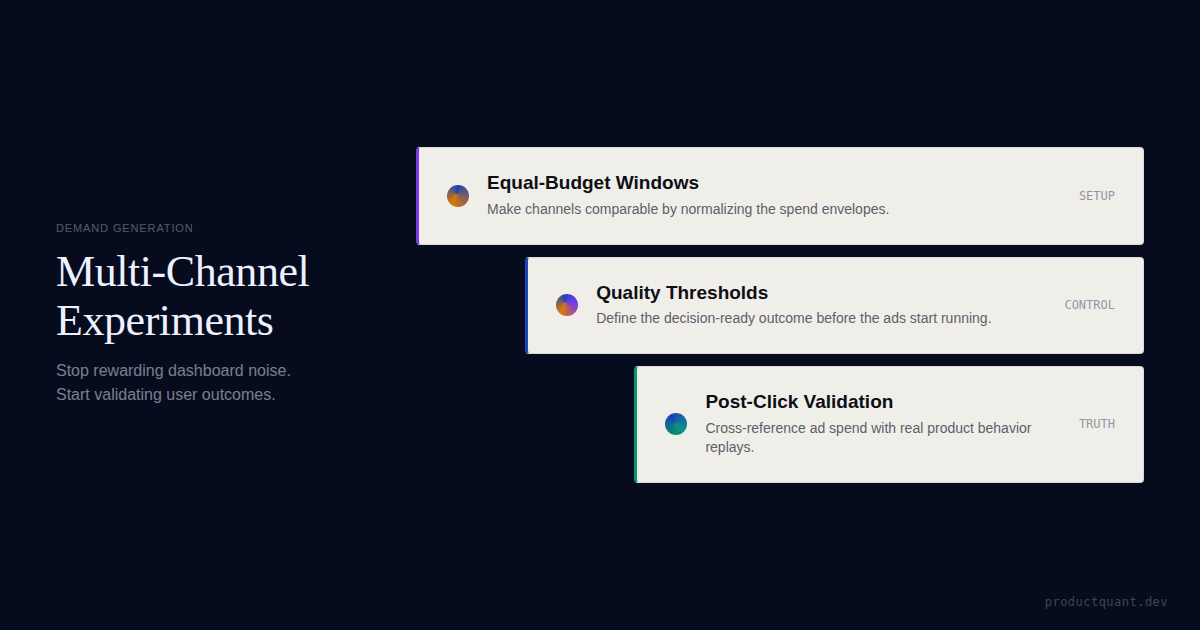
A practical framework for SaaS paid-channel experiments across Quora, Reddit, Meta, and X: set equal-budget tests, use quality-adjusted thresholds, and...
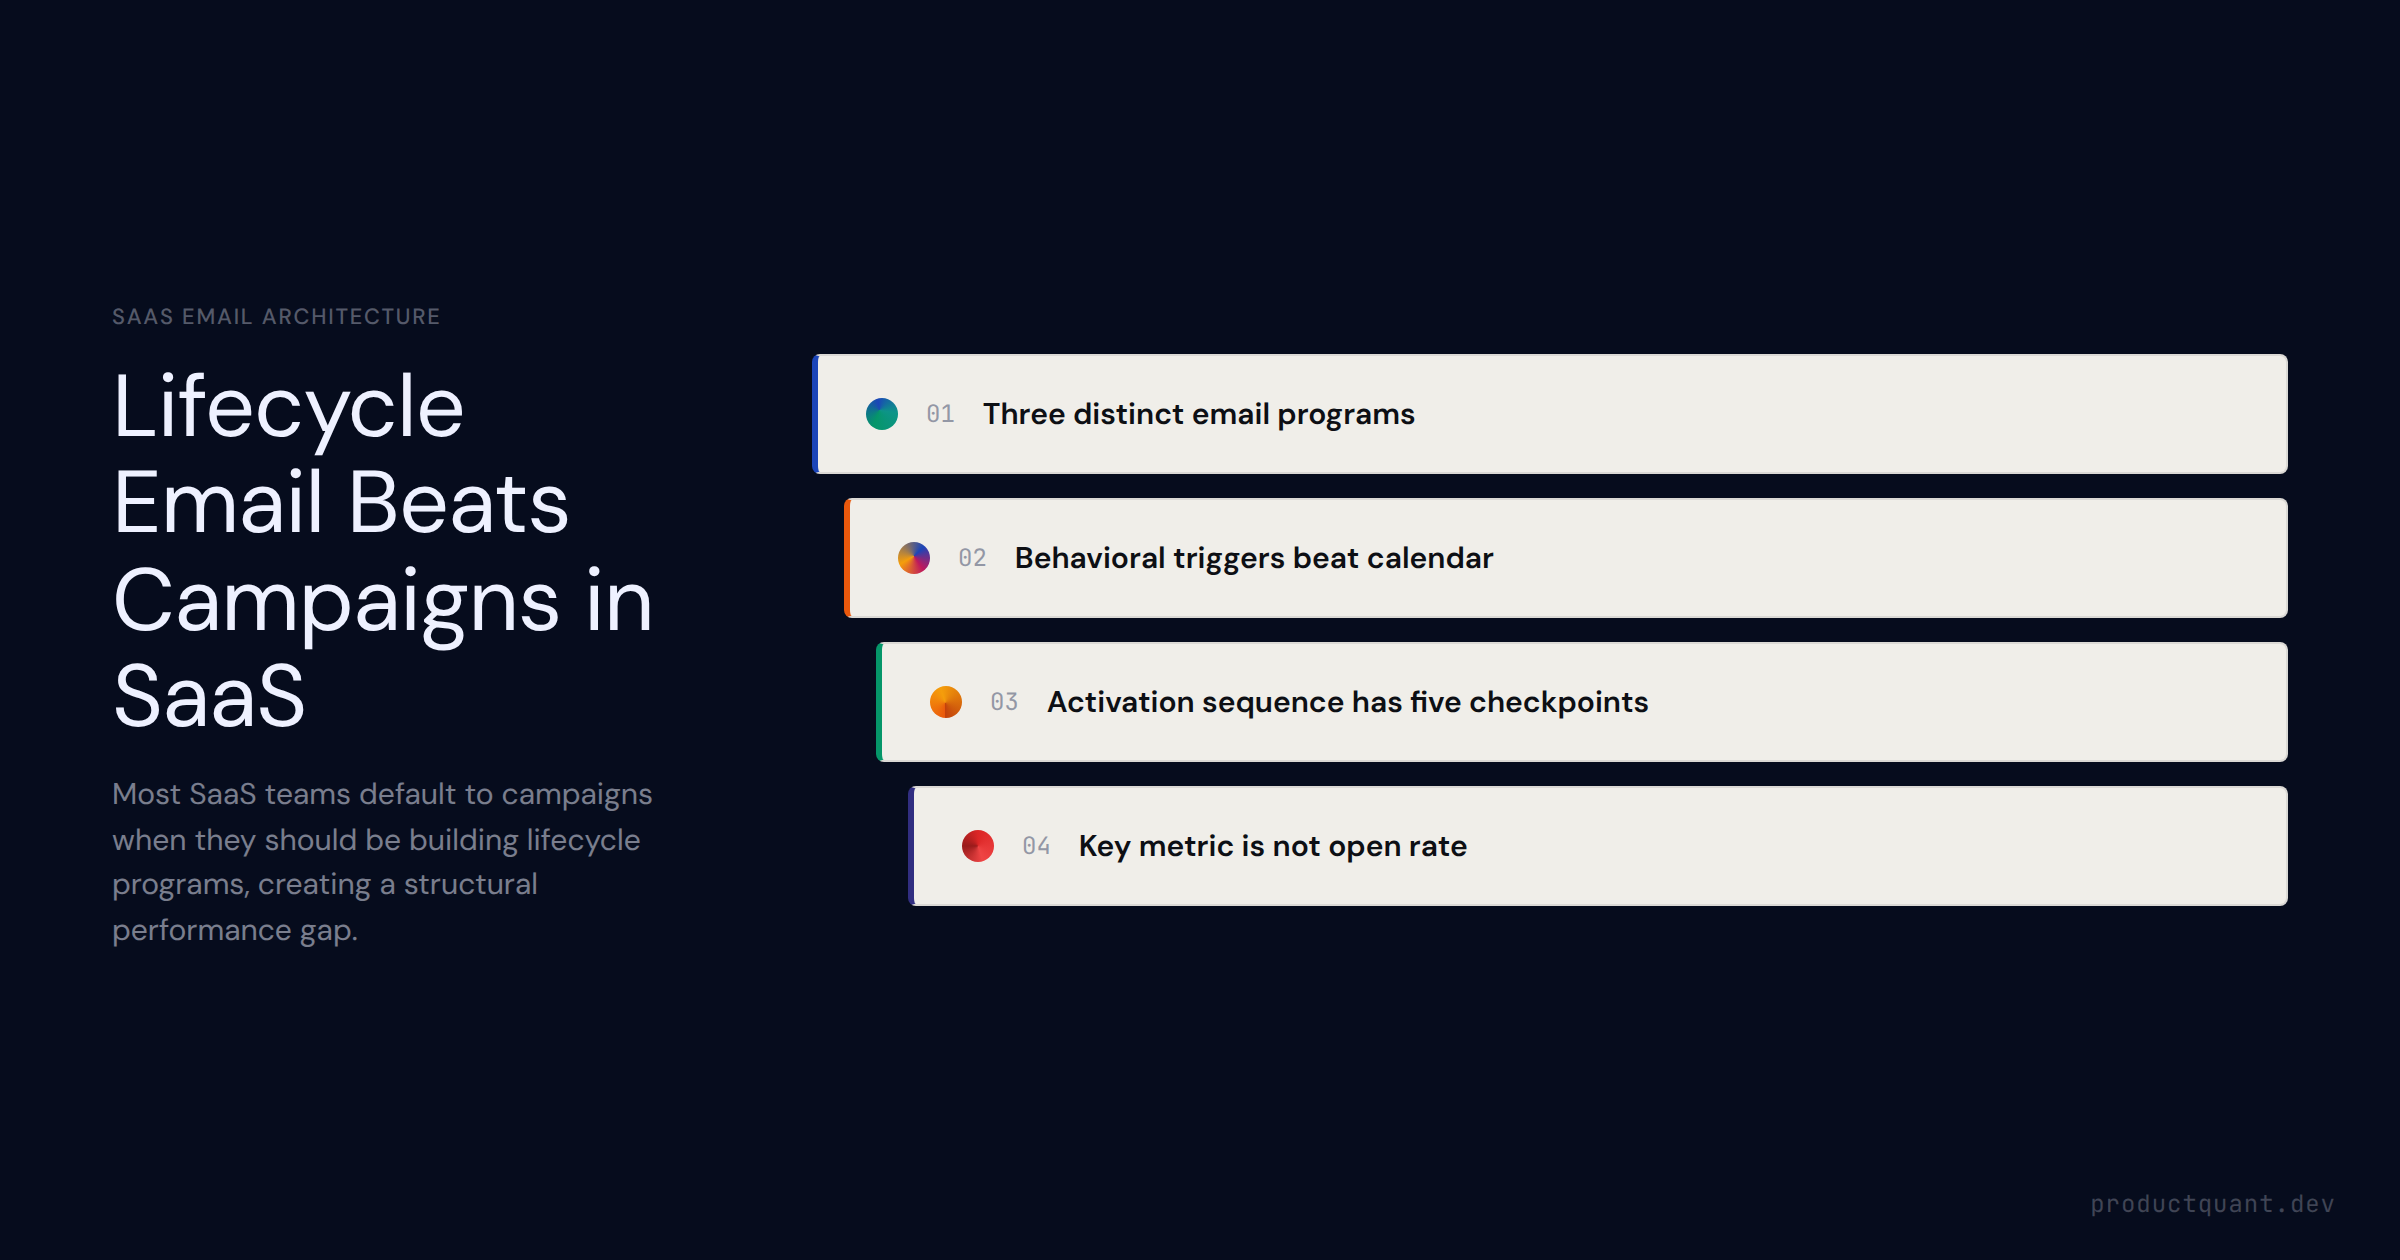
The three SaaS email program types, why lifecycle email outperforms campaign sends, the day 1/3/7/14/30 activation sequence, trigger-based vs. time-based logic, and the key metrics that actually predict revenue impact.
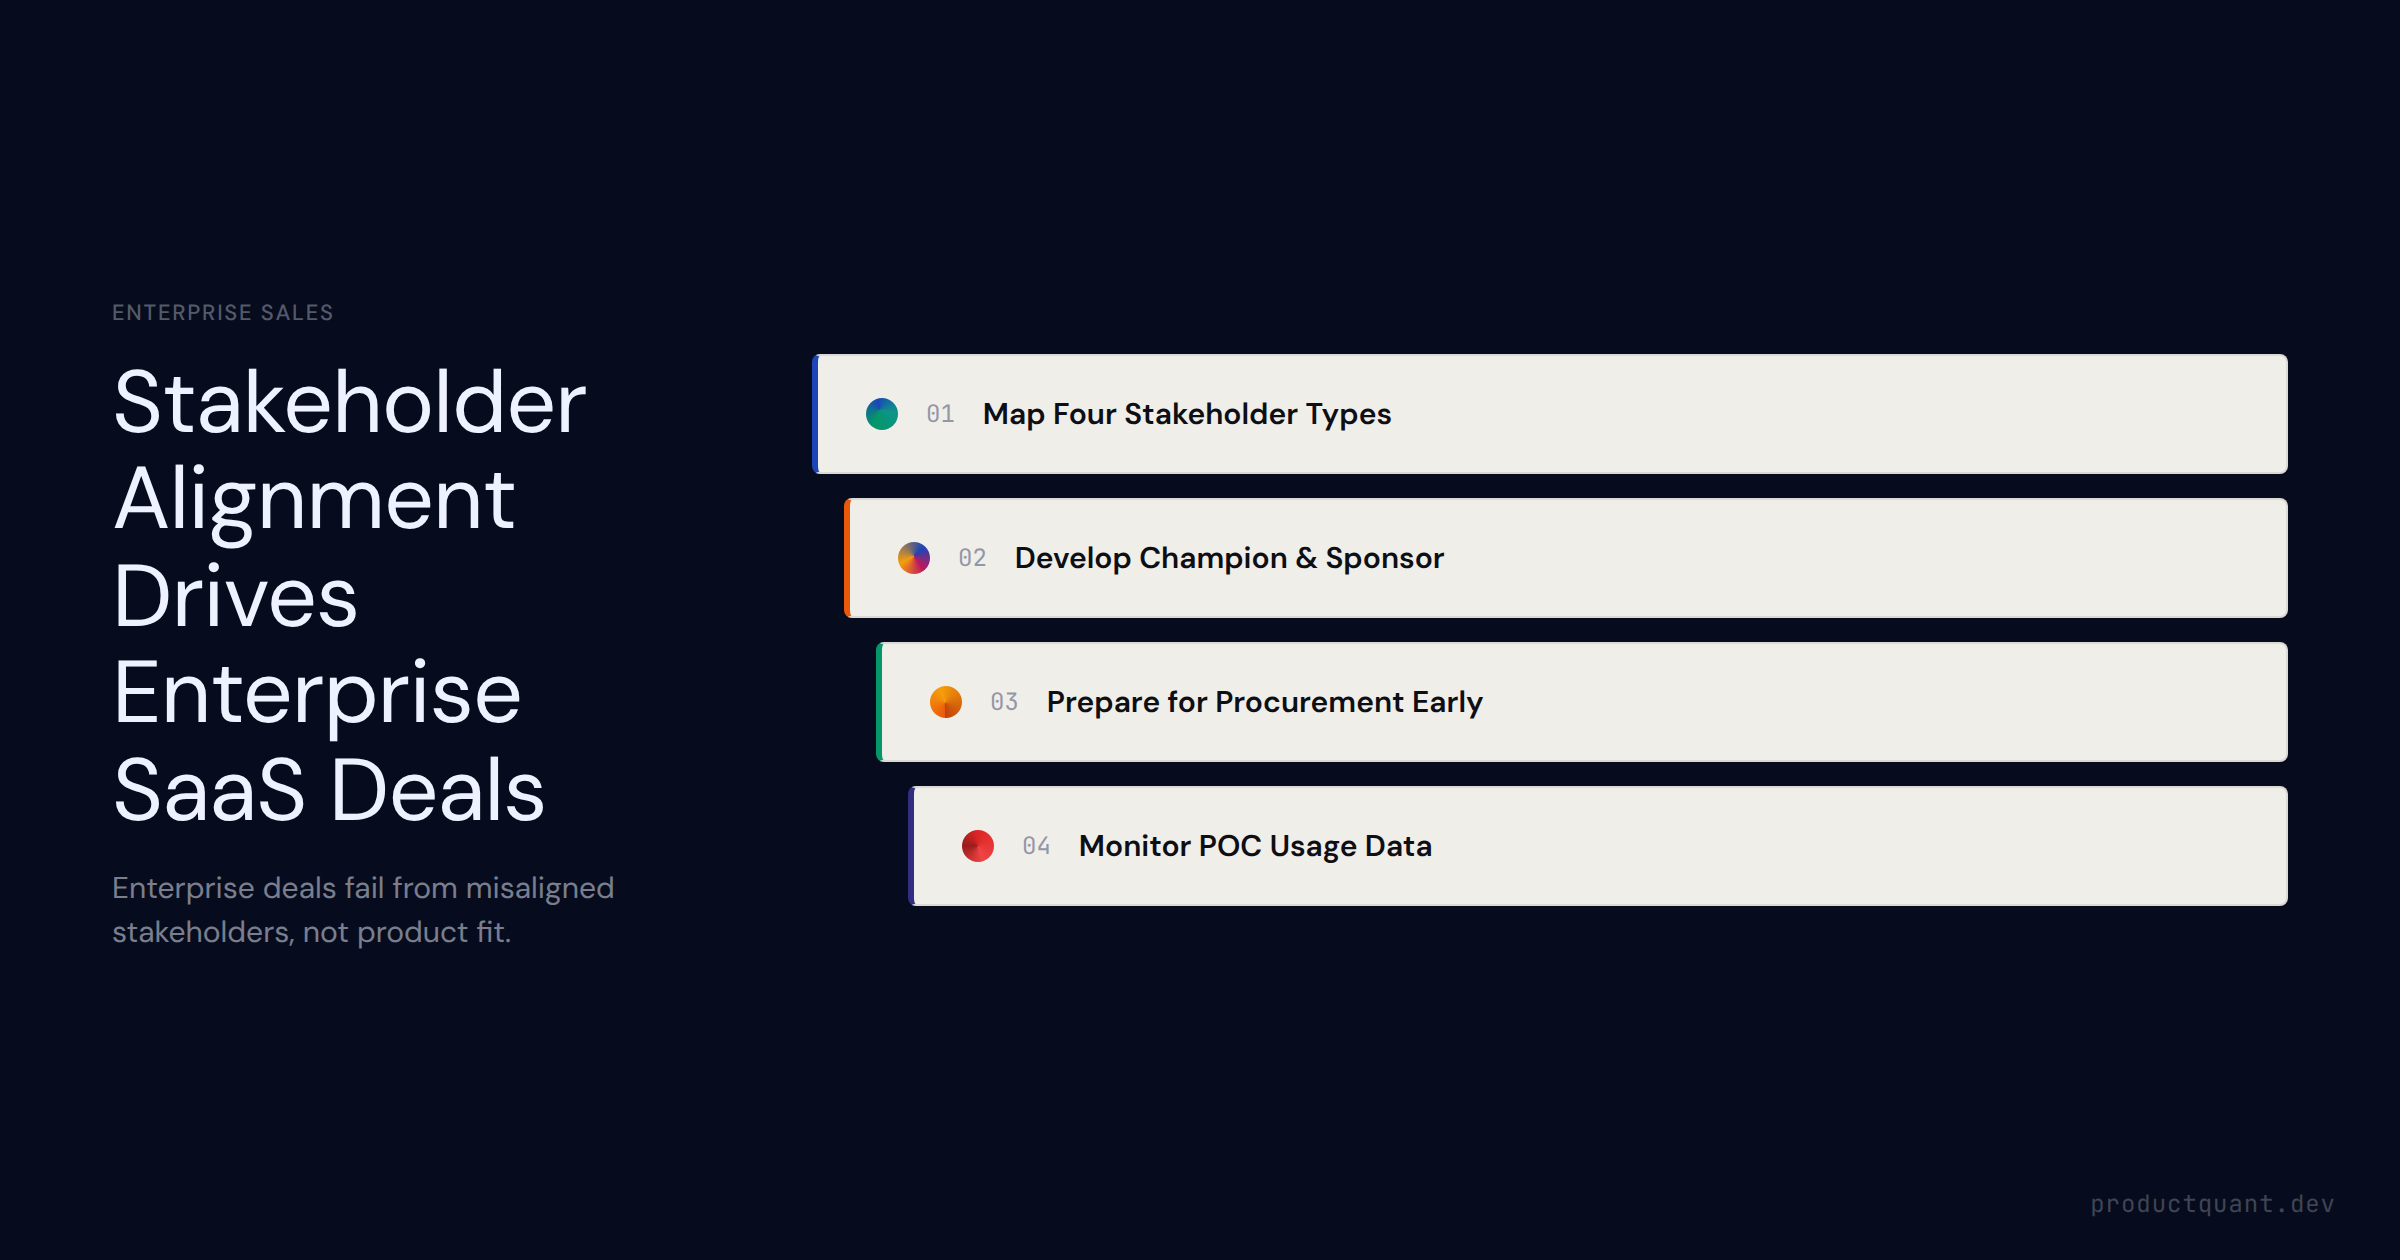
The complete enterprise SaaS sales strategy — covering the four stakeholder types, champion development vs. executive sponsorship, how procurement and security reviews work, and how pilot product usage predicts deal clos
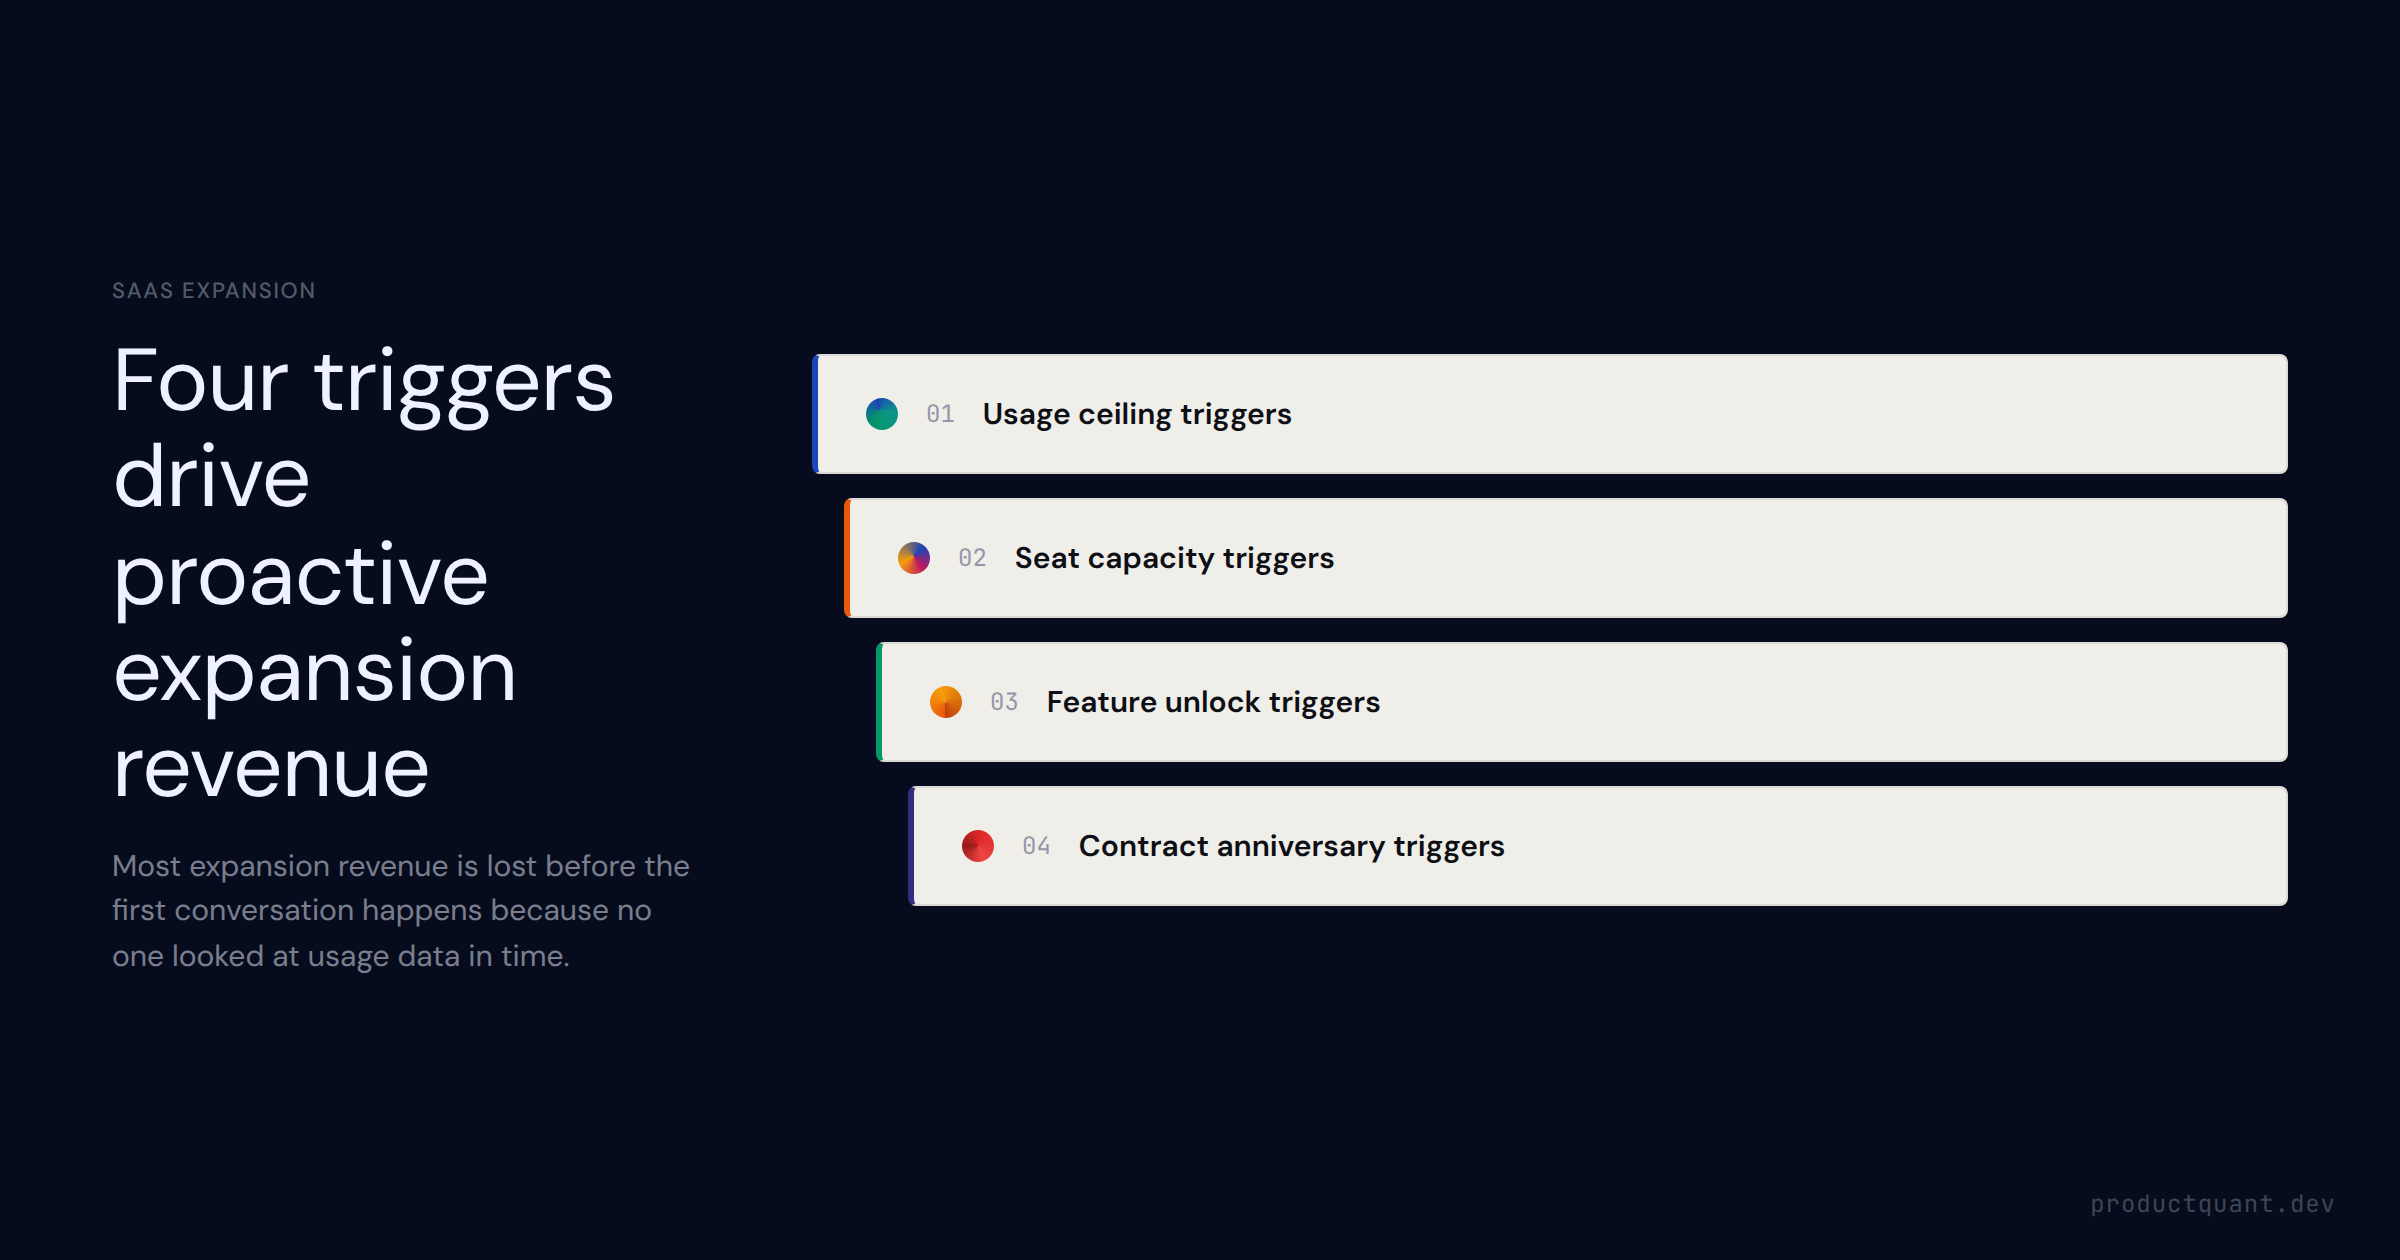
The four expansion trigger types, how to time expansion conversations before the obvious moment, the conversation framework that closes without feeling like a sales call, and the NRR math behind every decision.
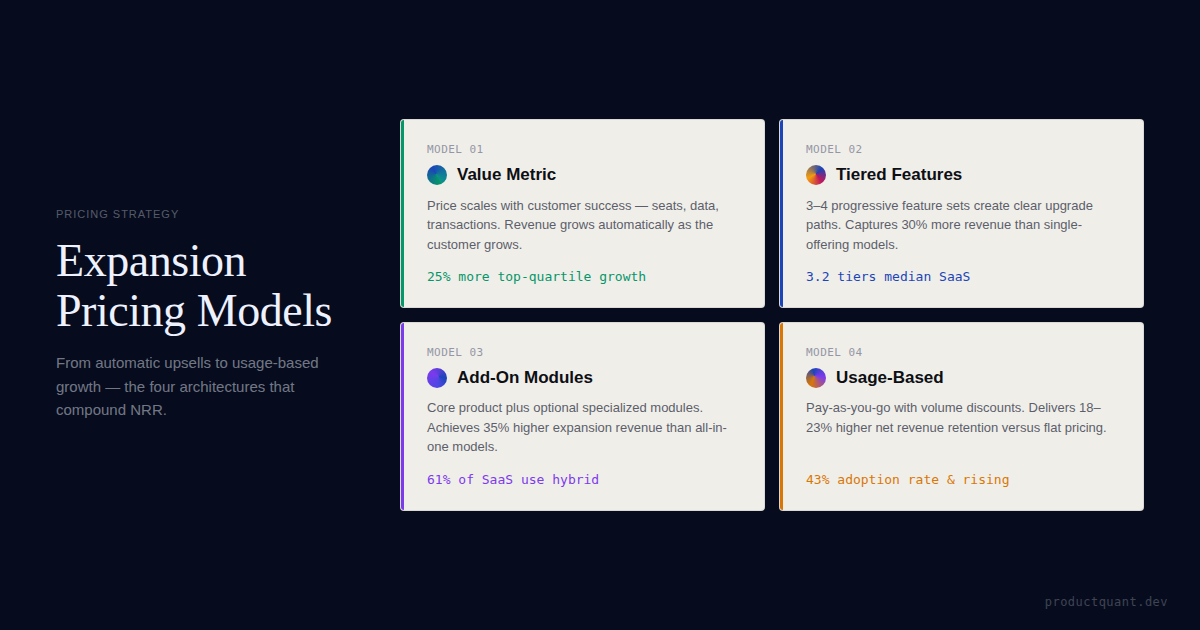
Expansion revenue is the NRR driver in SaaS. Learn the three expansion motions — upsell, cross-sell, and usage-based — the math that determines whether you need to acquire or expand, and how product signals identify expa
Expansion revenue is the fastest path to efficient SaaS growth. Learn how to calculate expansion MRR, which upsell and seat expansion tactics work at each ARR stage, and how to build a system that compounds.
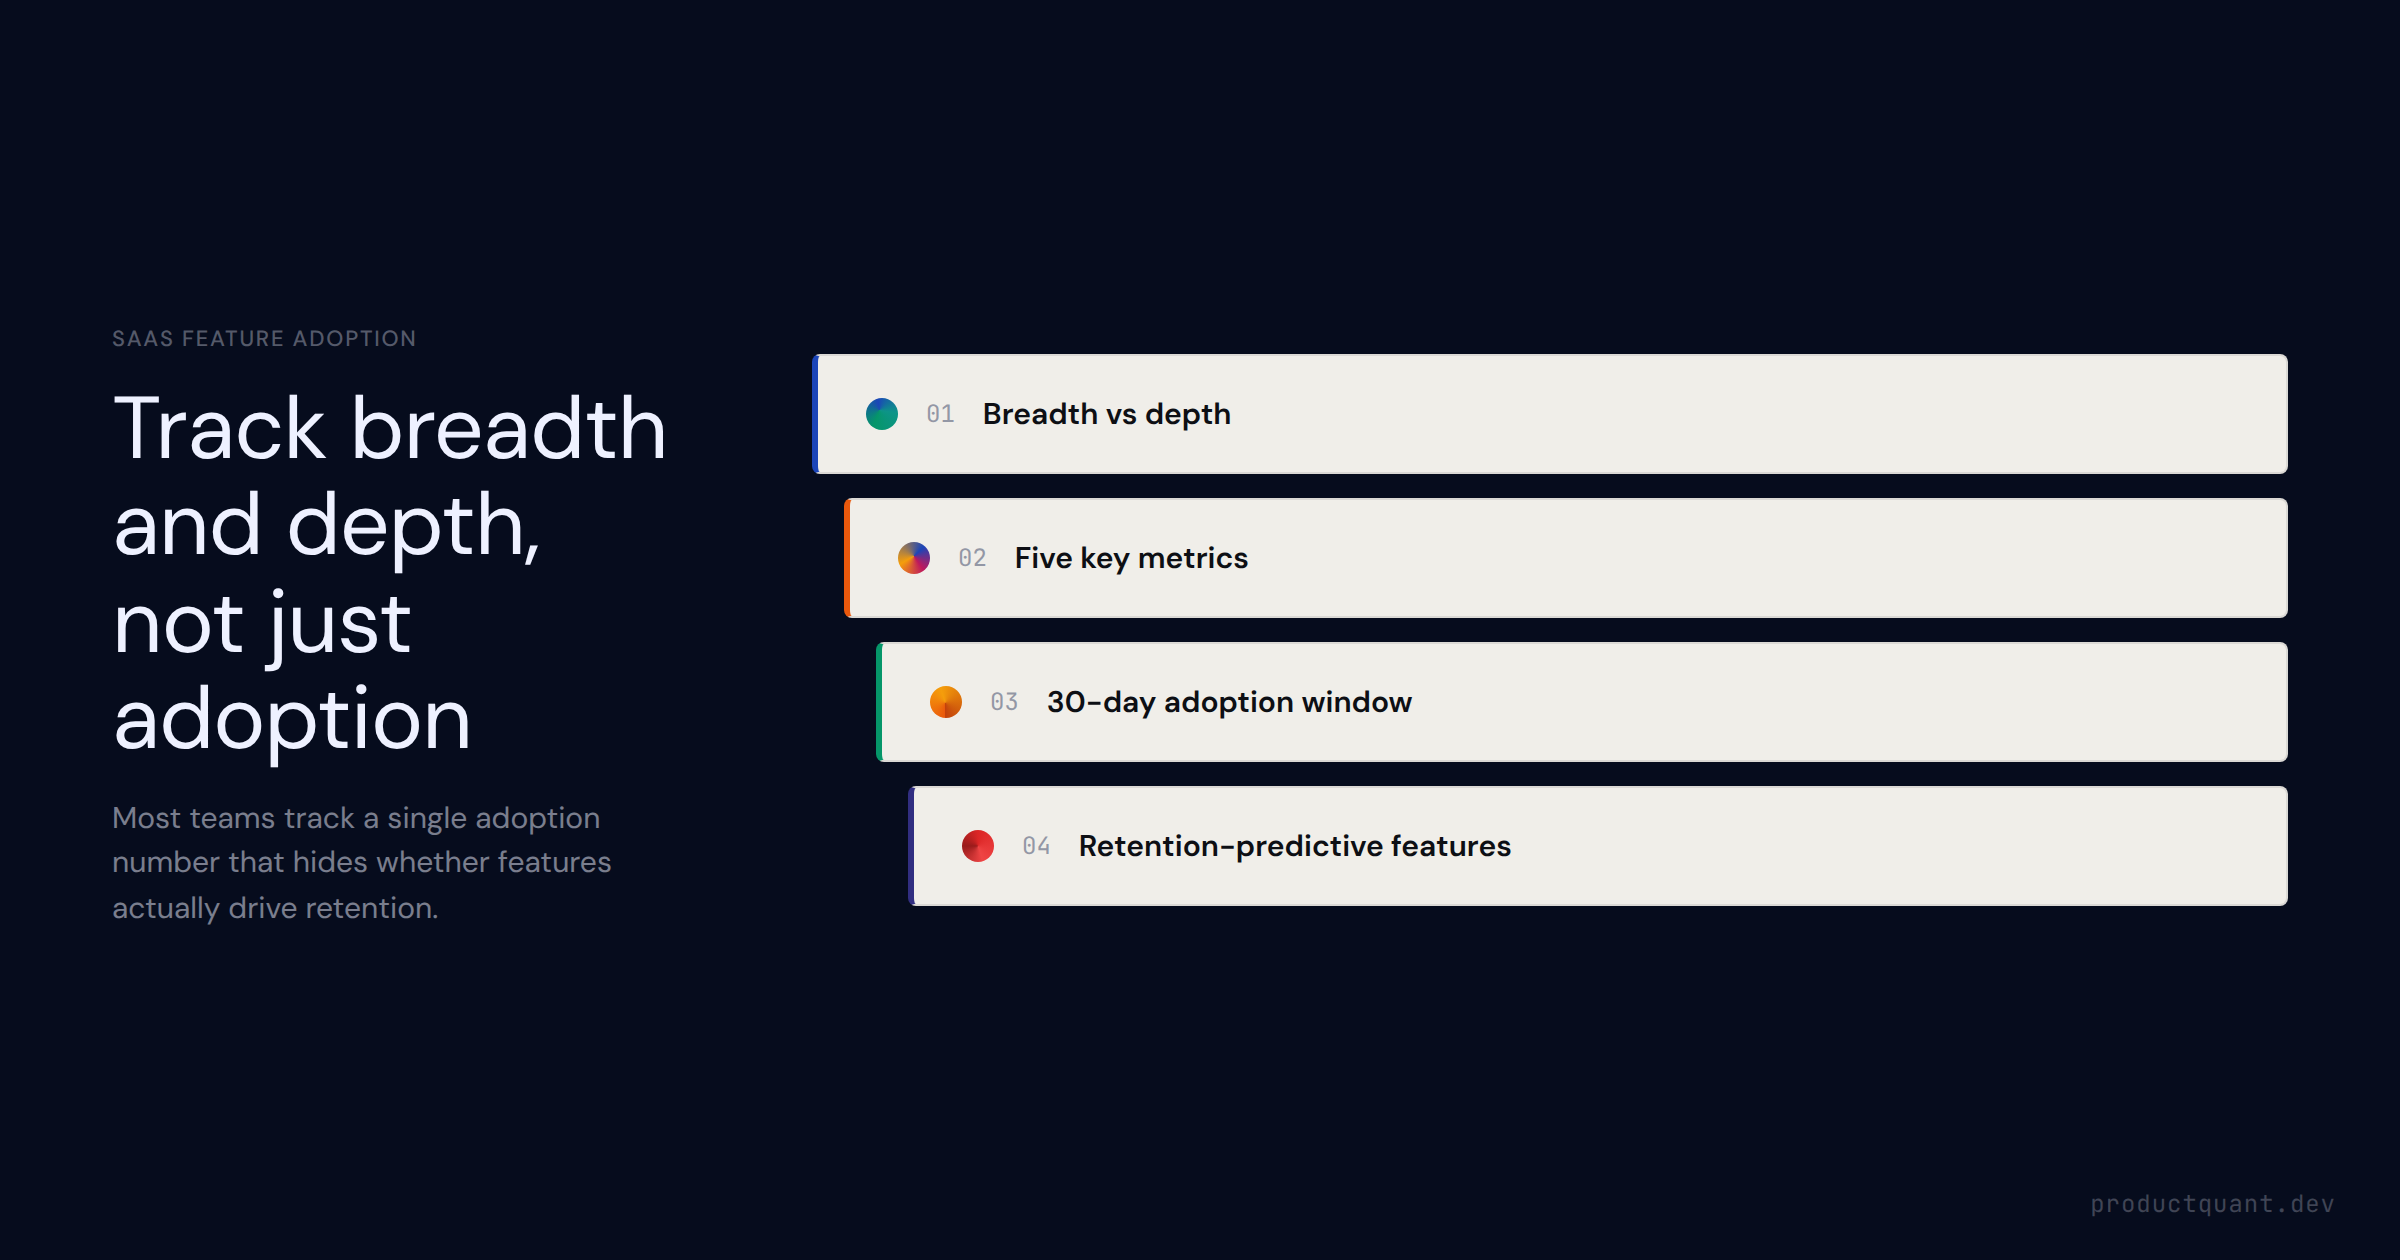
Low feature adoption signals one of three problems: discovery, value, or UX friction. Here is the funnel, the metrics, and the diagnostic framework that tells you which one you have.
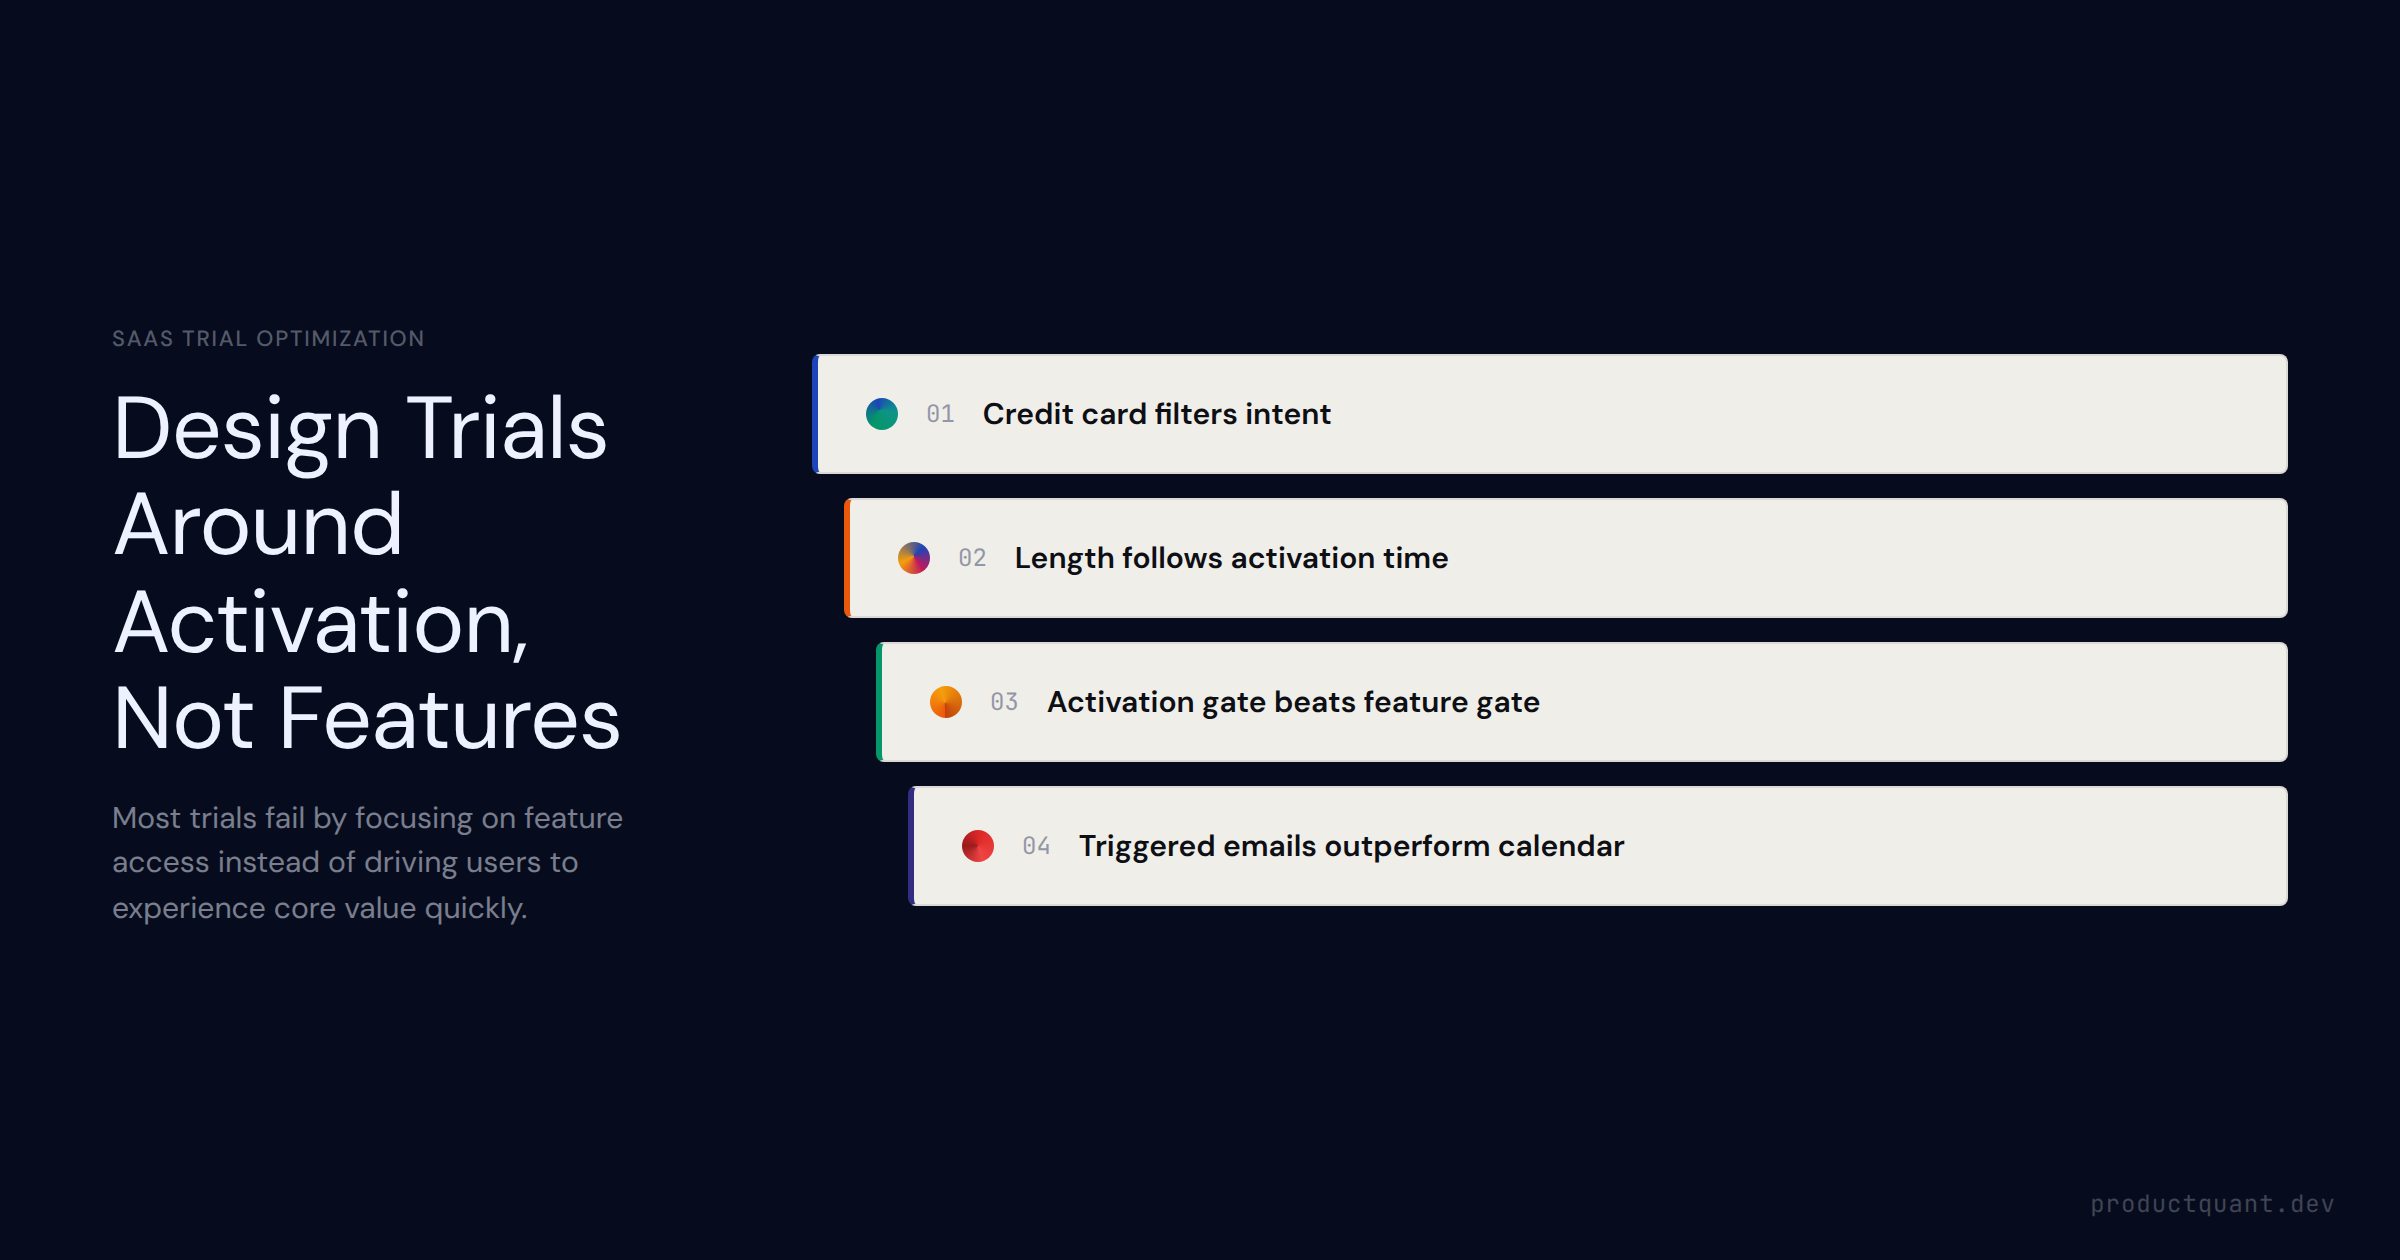
Opt-in vs. opt-out trial models, 14 vs. 30-day length decisions, credit card gates, value-moment design, conversion benchmarks by GTM motion, and in-trial email sequences — a complete guide to SaaS free trial best practi
SaaS free trial conversion rate benchmarks (2–5% self-serve, 15–20% sales-assisted), the activation moment, opt-in vs opt-out trial differences, and the behavioral signals that predict which trial users will convert.
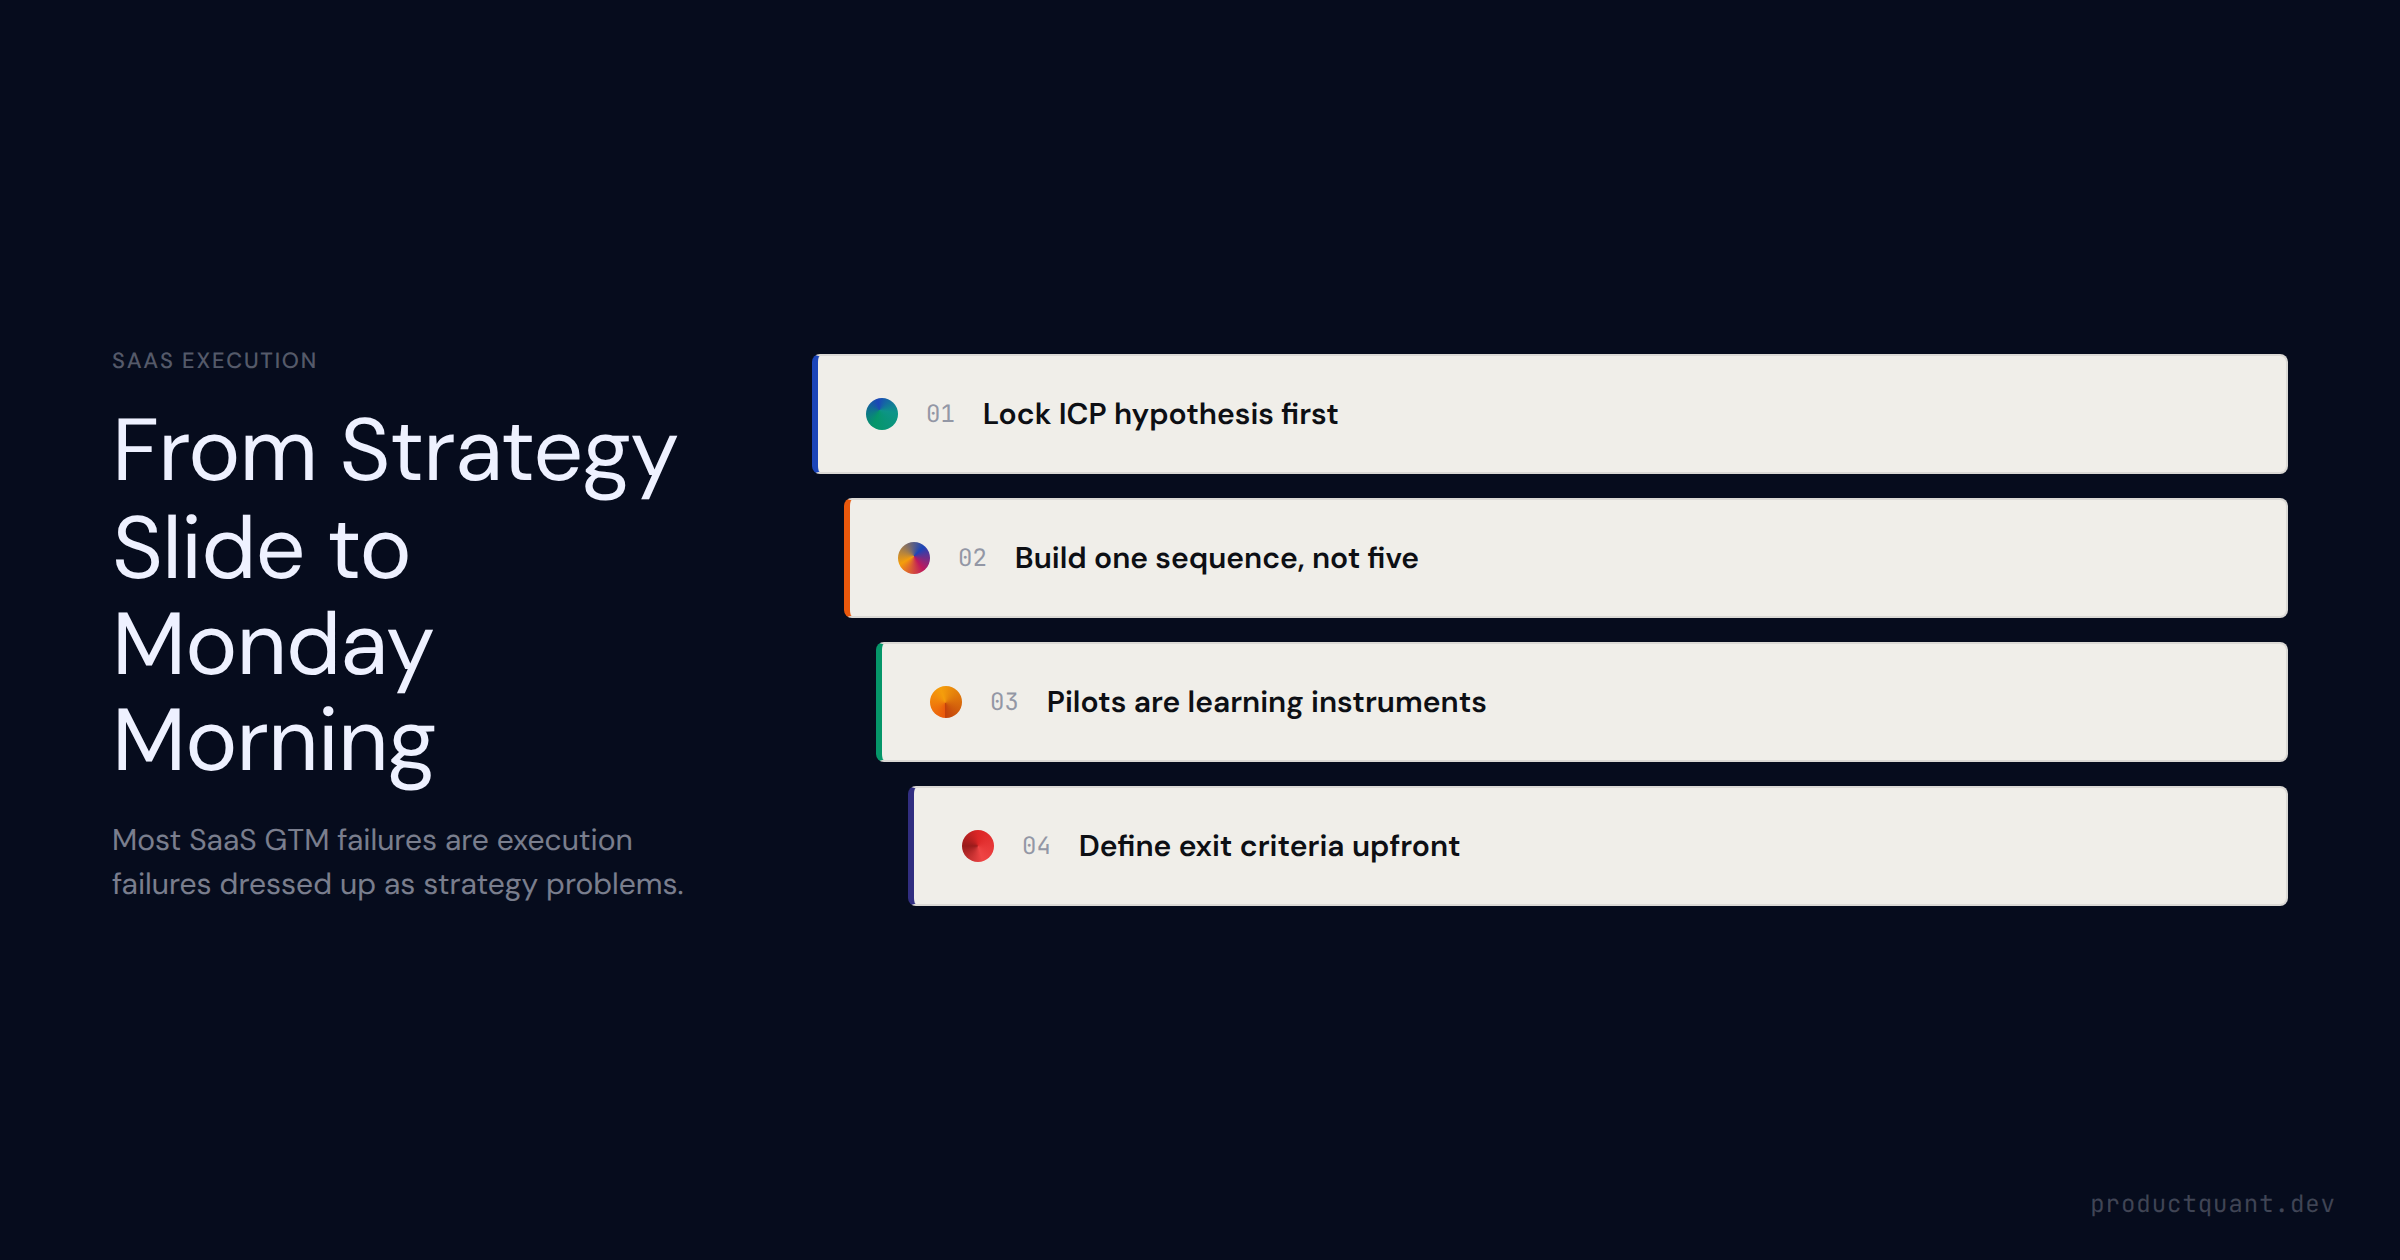
The operational companion to GTM strategy. What you actually do week by week to execute a SaaS GTM motion — ICP activation sequence, pilot customer framework, and the feedback loop that accelerates PMF validation.
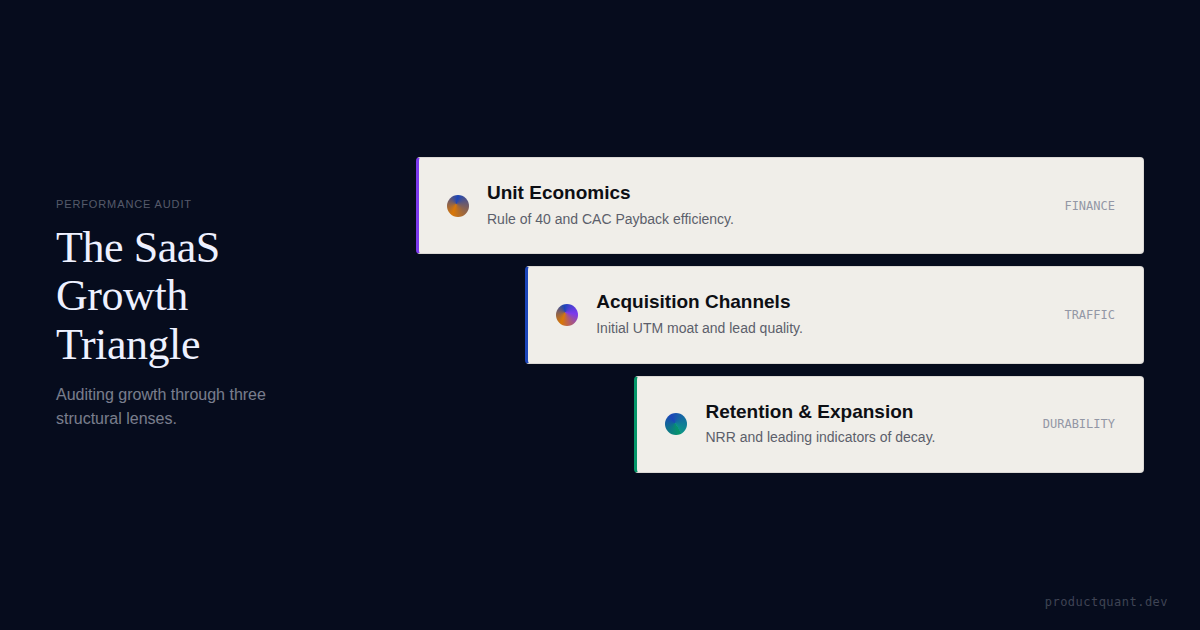
Run a complete SaaS growth audit. 21 critical checkpoints for acquisition, activation, and retention. Learn to identify revenue bottlenecks in 2026.
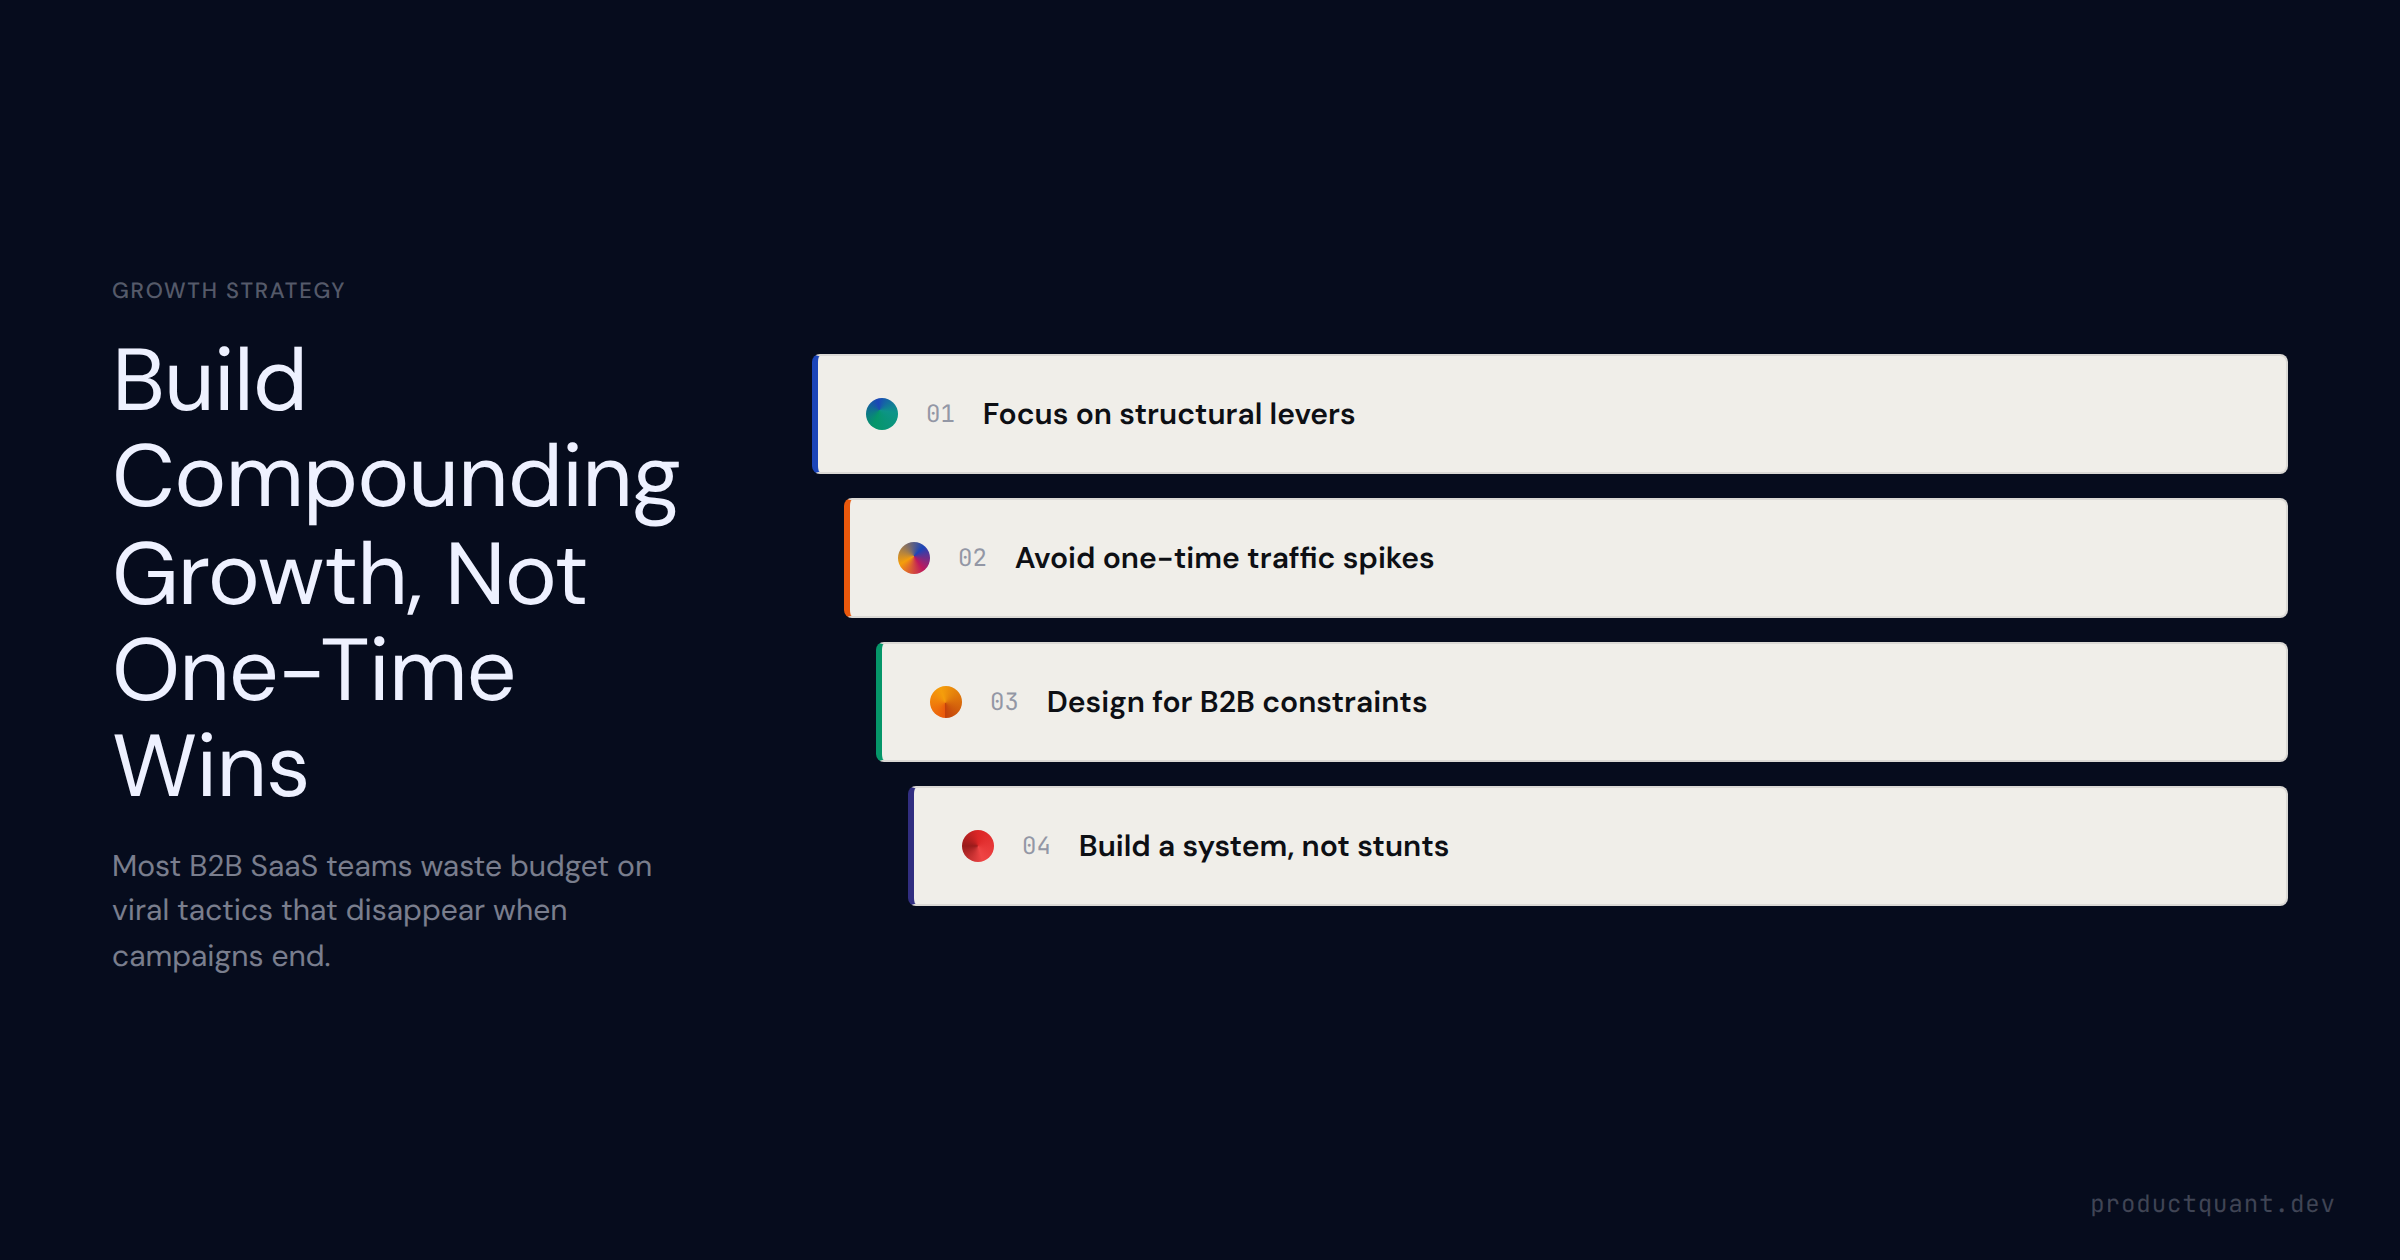
Growth hacking mythology keeps B2B SaaS teams chasing viral stunts instead of structural levers. Here is what compound growth actually looks like — and how to build the experiment system behind it.
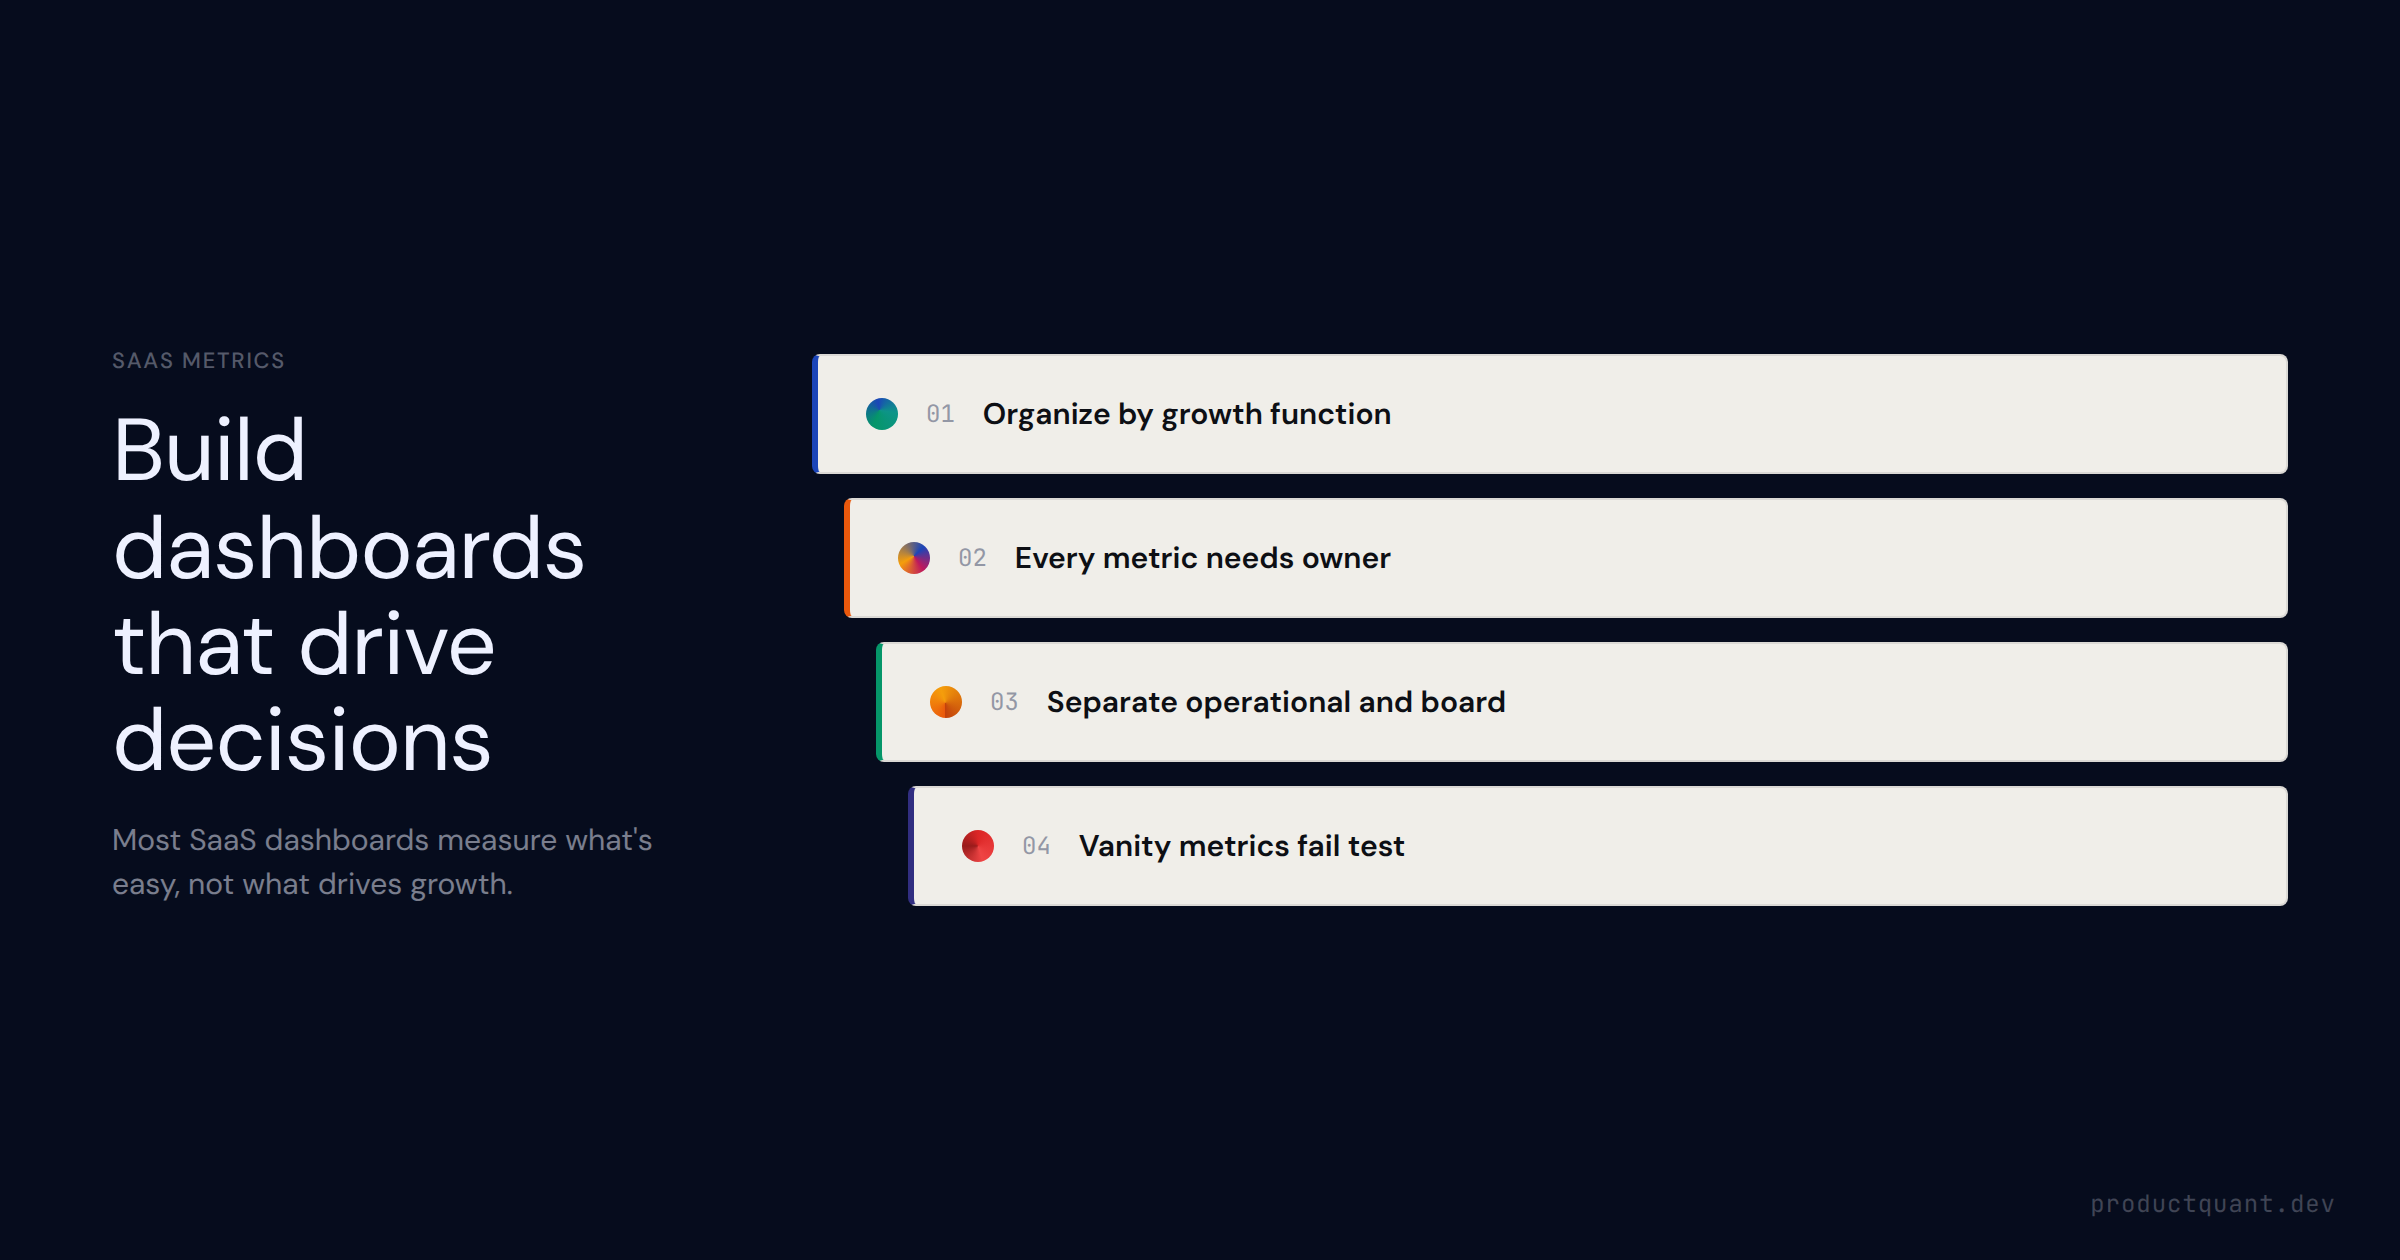
What goes on a SaaS growth metrics dashboard — the metrics that matter by function, how to avoid vanity dashboards, the difference between operational and board metrics, and how to wire each metric to a decision.
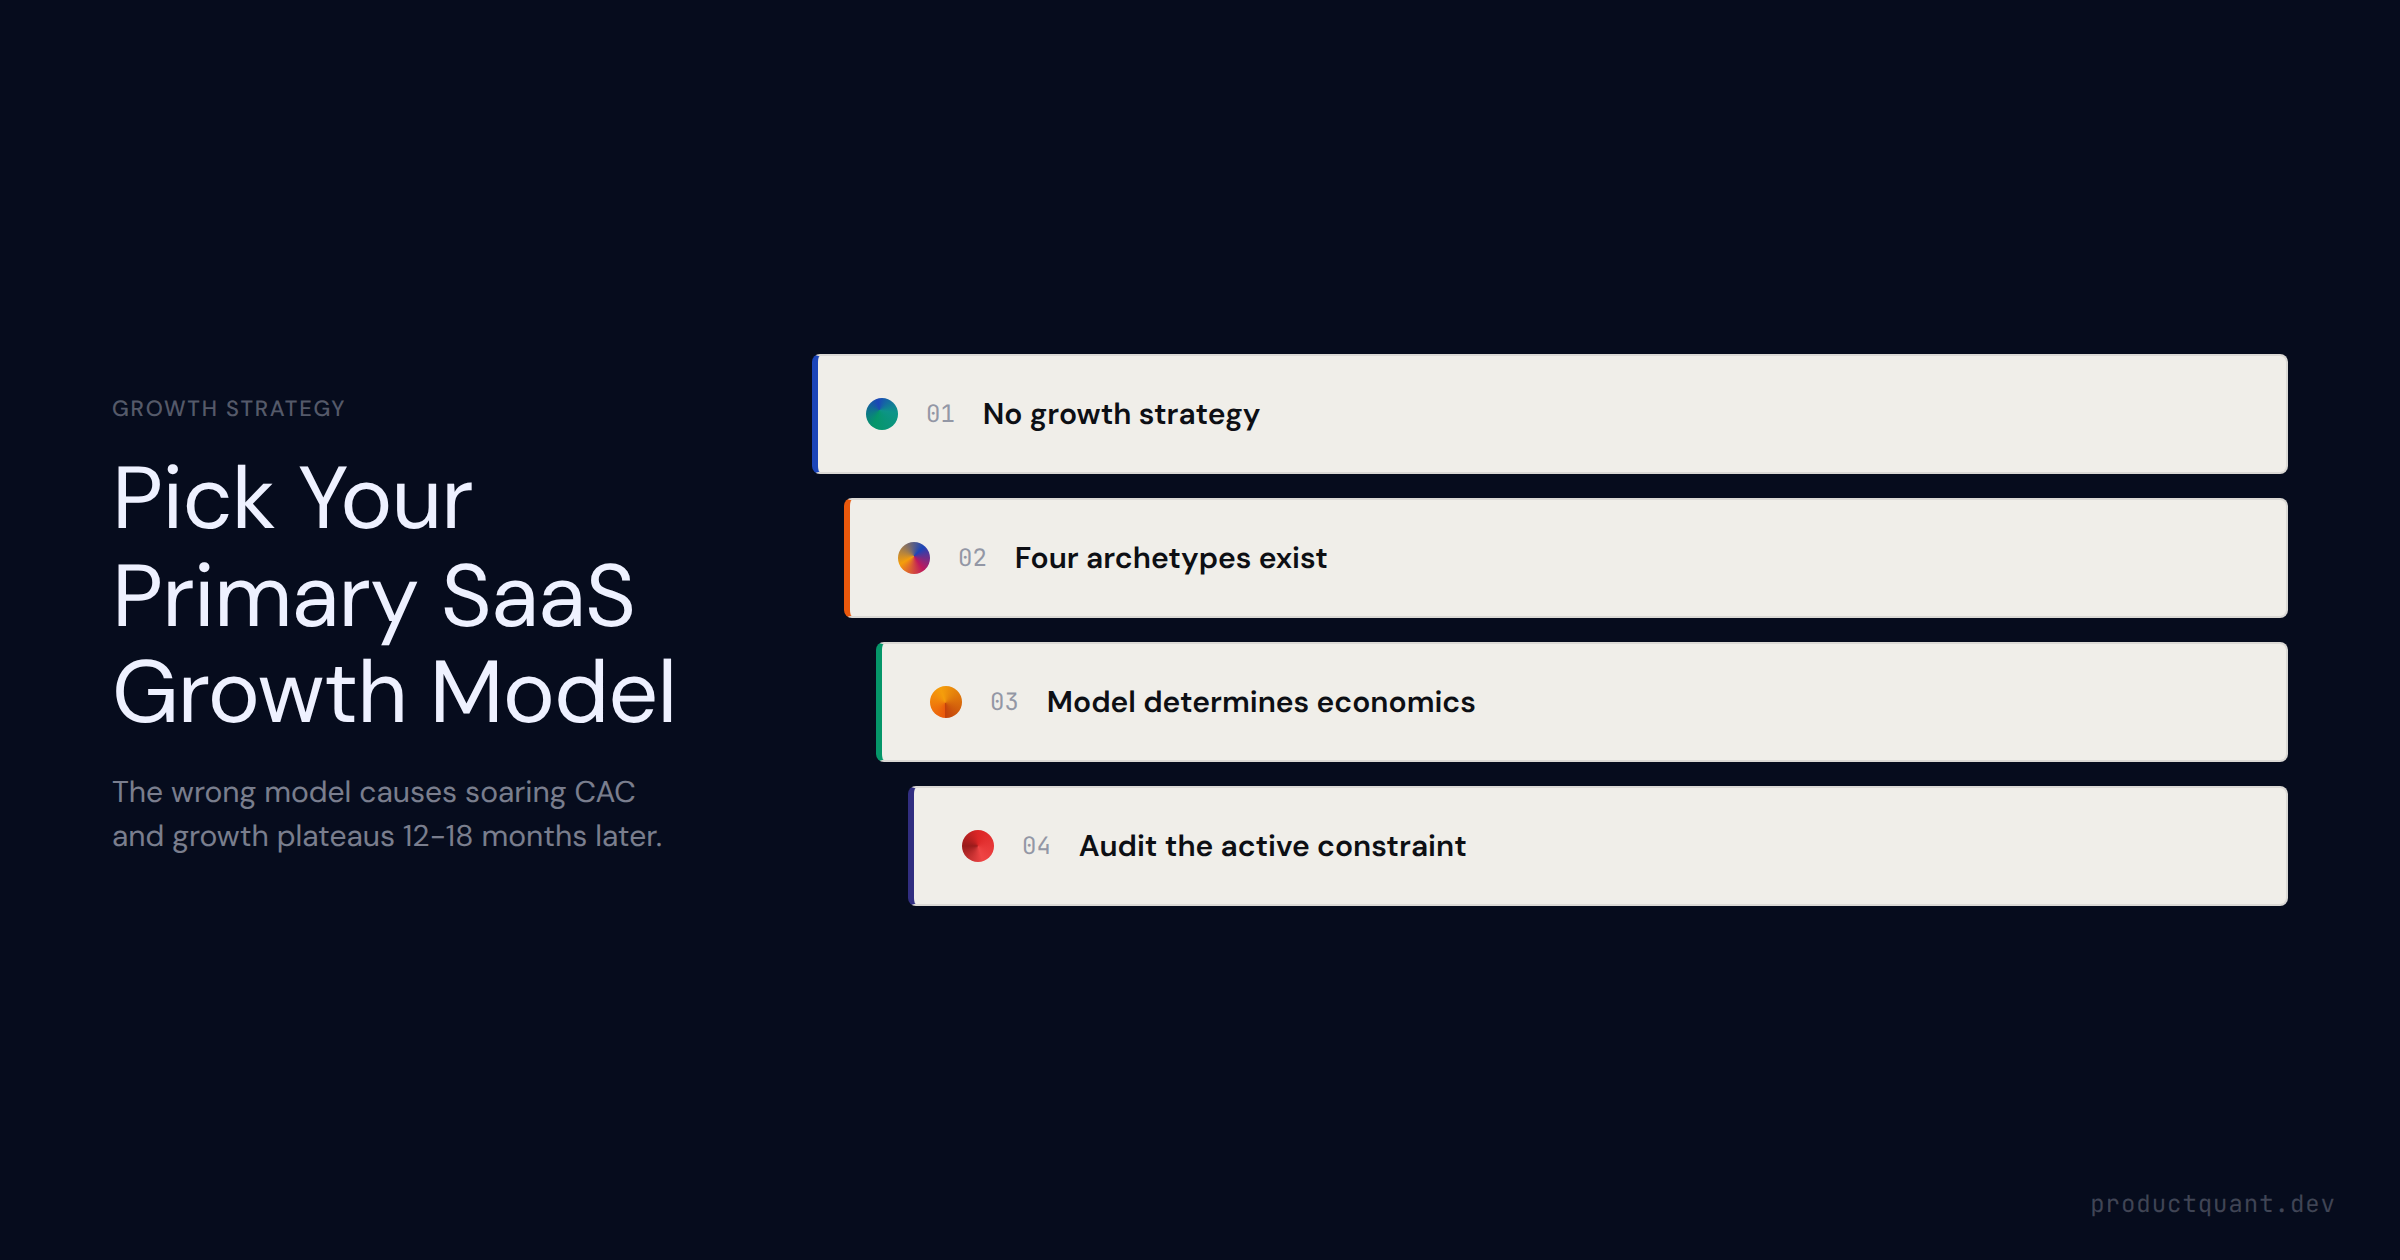
The 4 SaaS growth model archetypes — paid acquisition, organic, product-led, network effect — how each determines unit economics at scale, and the framework for selecting, auditing, and layering growth motions.
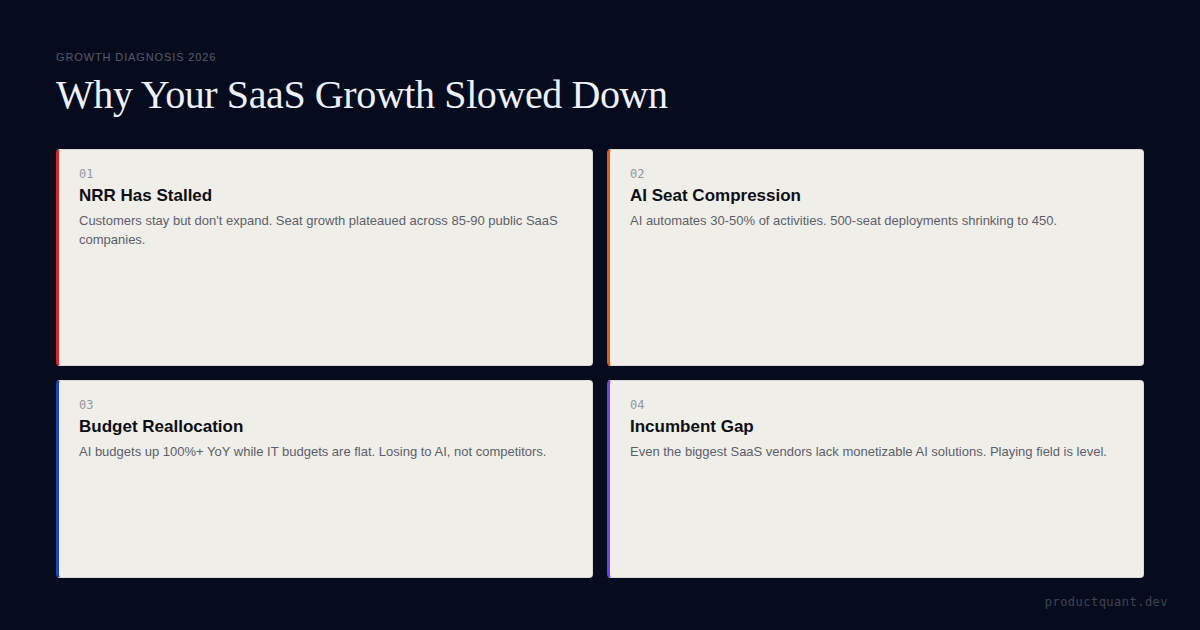
SaaS growth rates declined every quarter since 2021. AI seat compression, NRR stall, and budget reallocation are structural. Here is what to do.
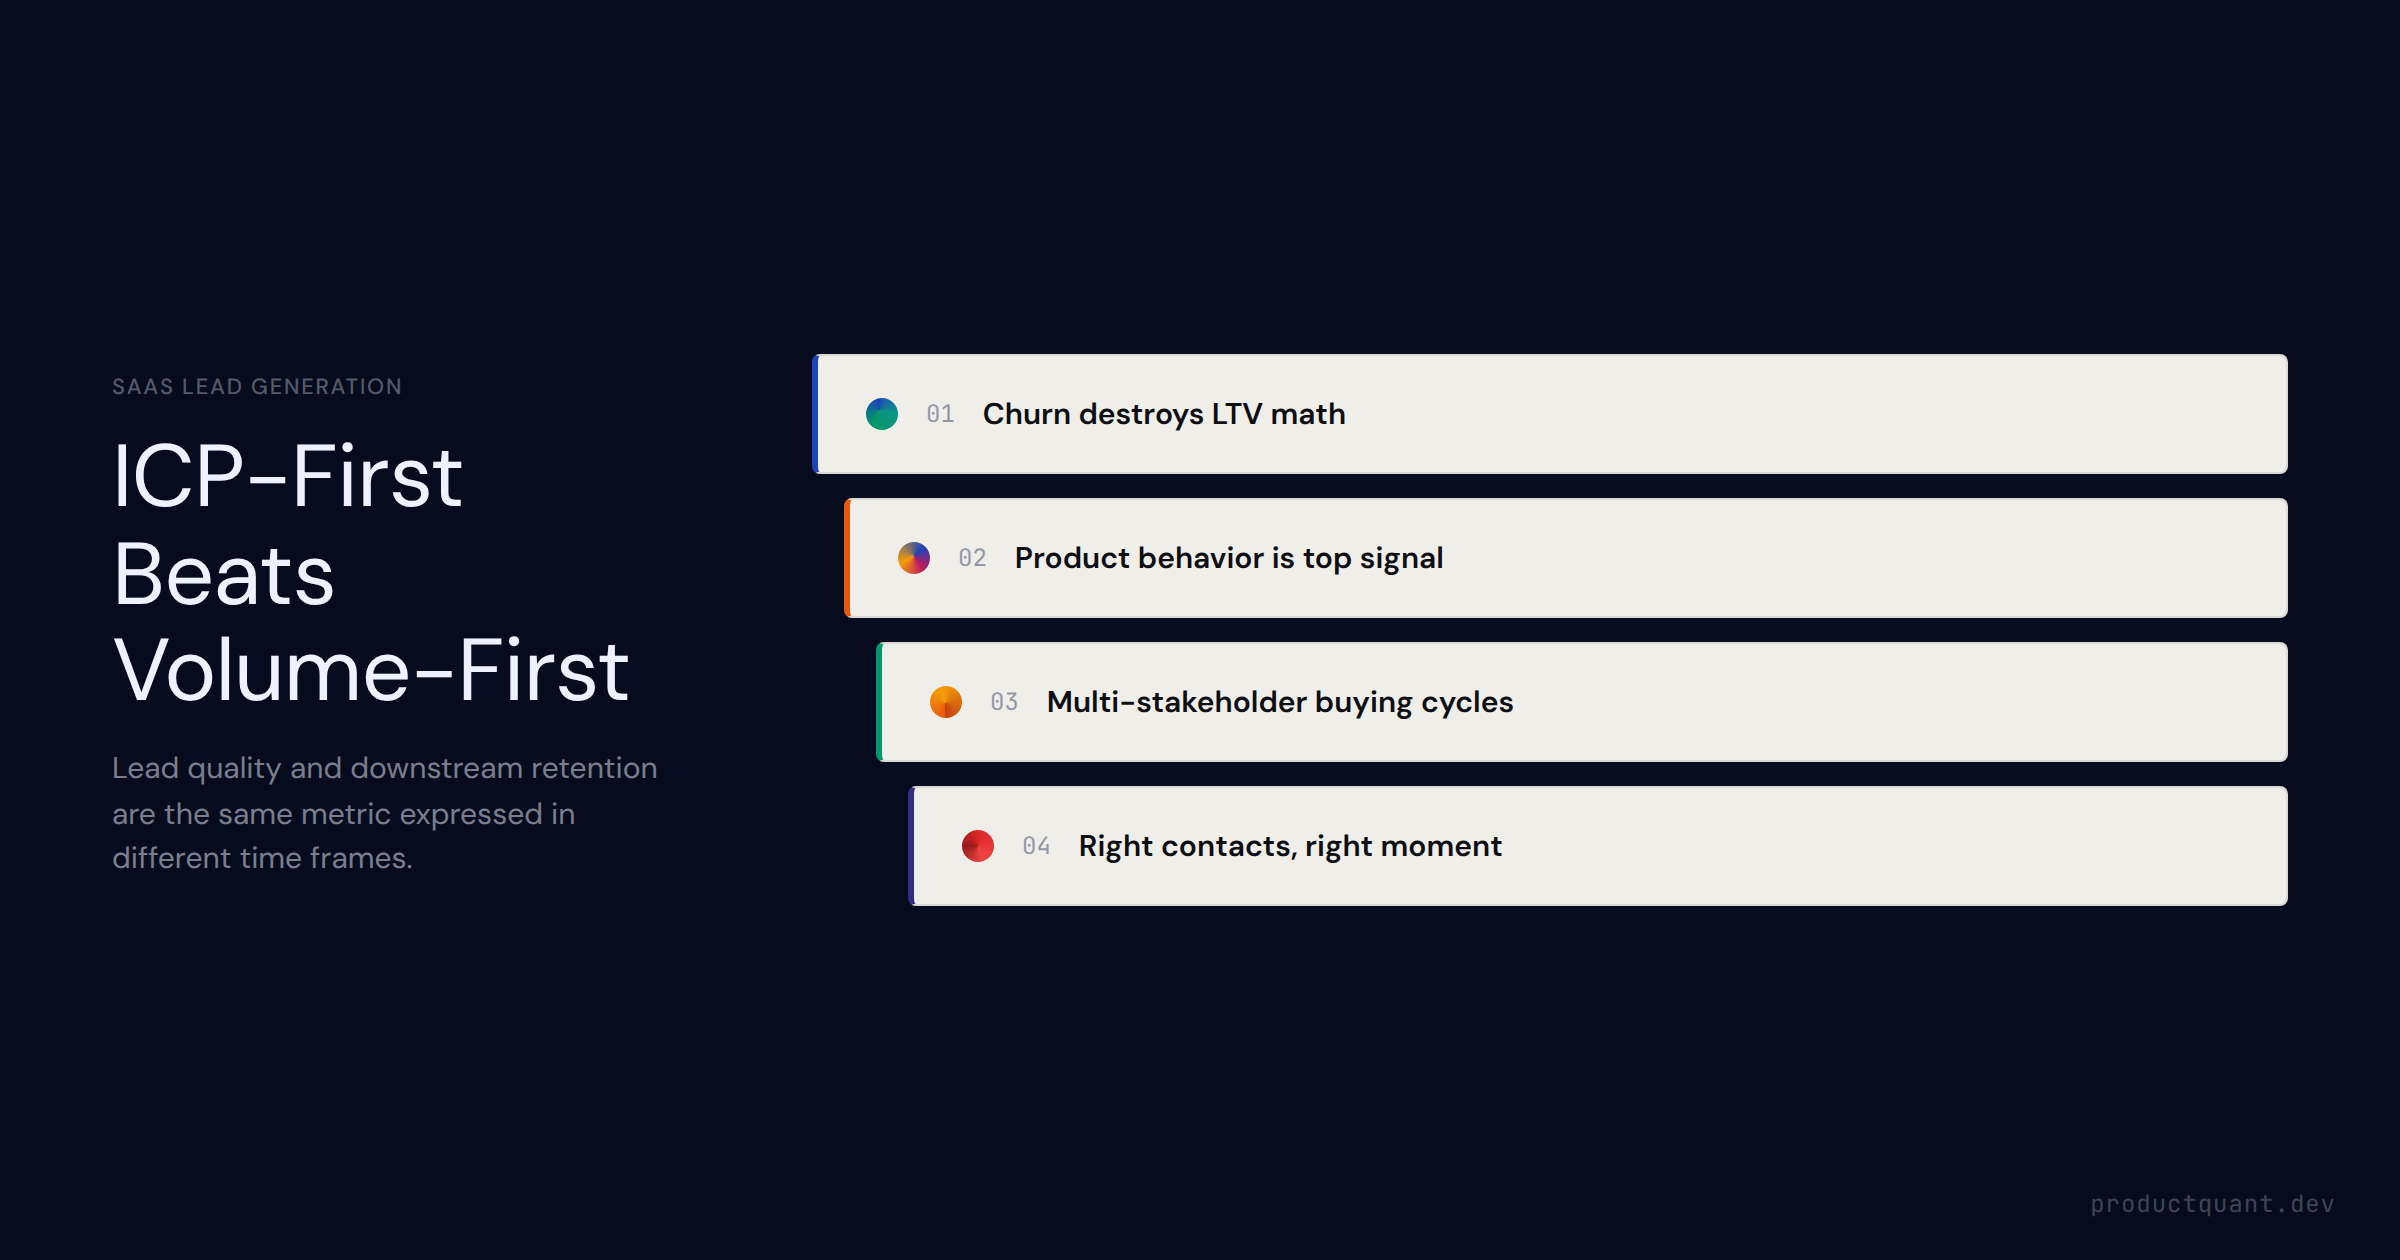
How B2B SaaS companies generate qualified pipeline in 2026 — channel types, ICP-first vs. volume-first, and the signal-layered outbound motion that compounds over time.
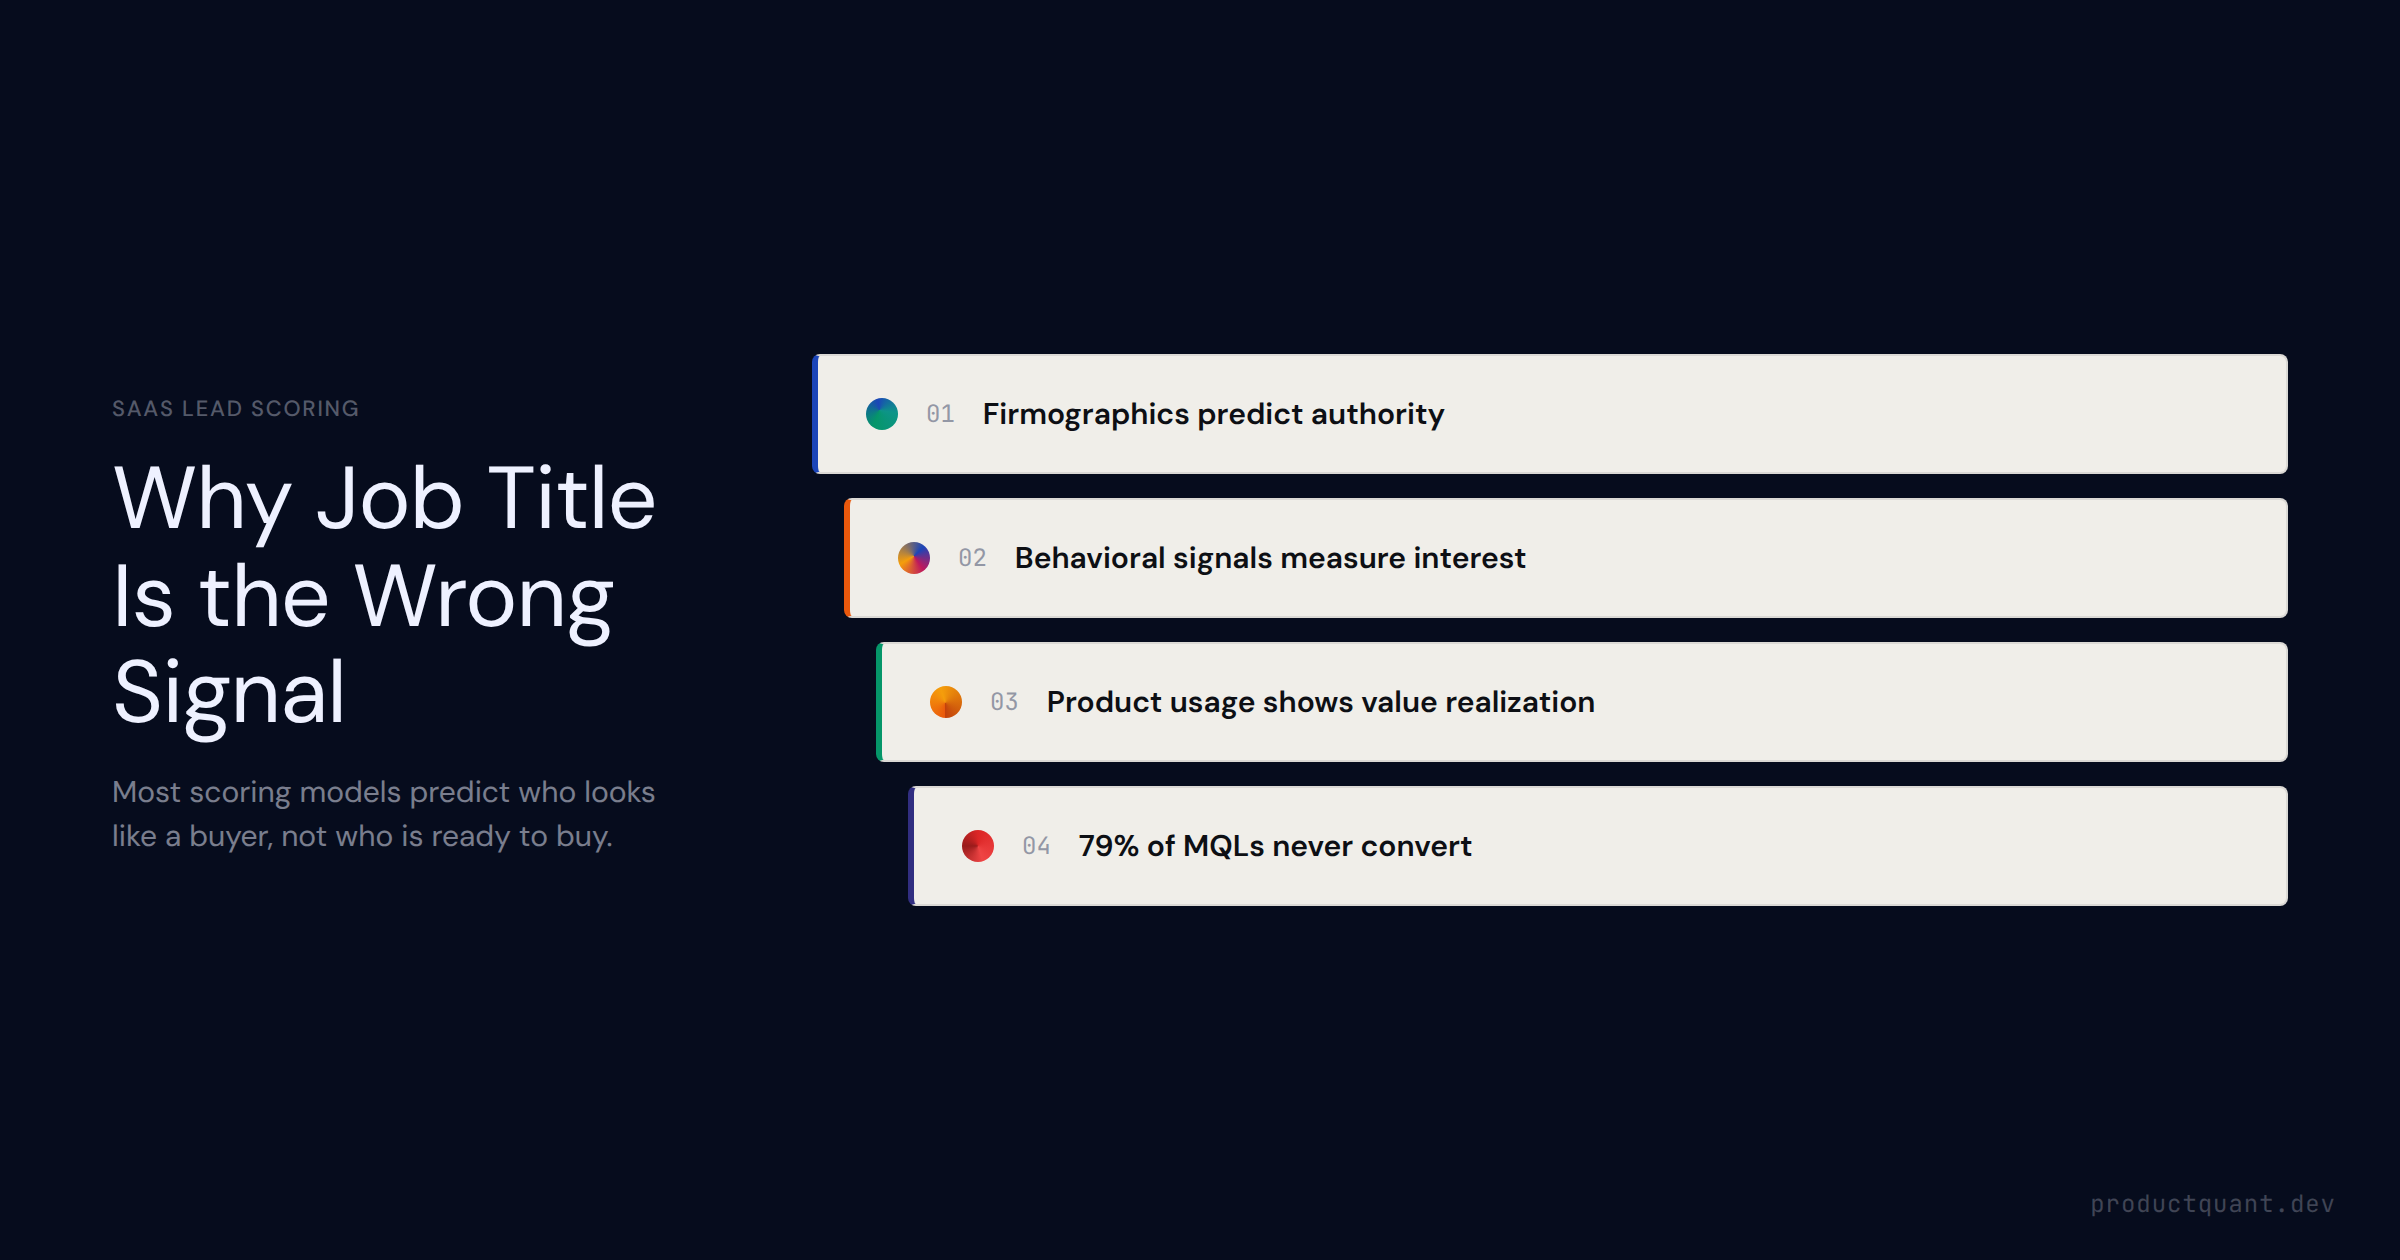
How to build a B2B SaaS lead scoring model that predicts conversion — why demographic scoring overweights job title, how Product Qualified Leads (PQLs) outperform MQL logic, and the handoff criteria that turn a score int
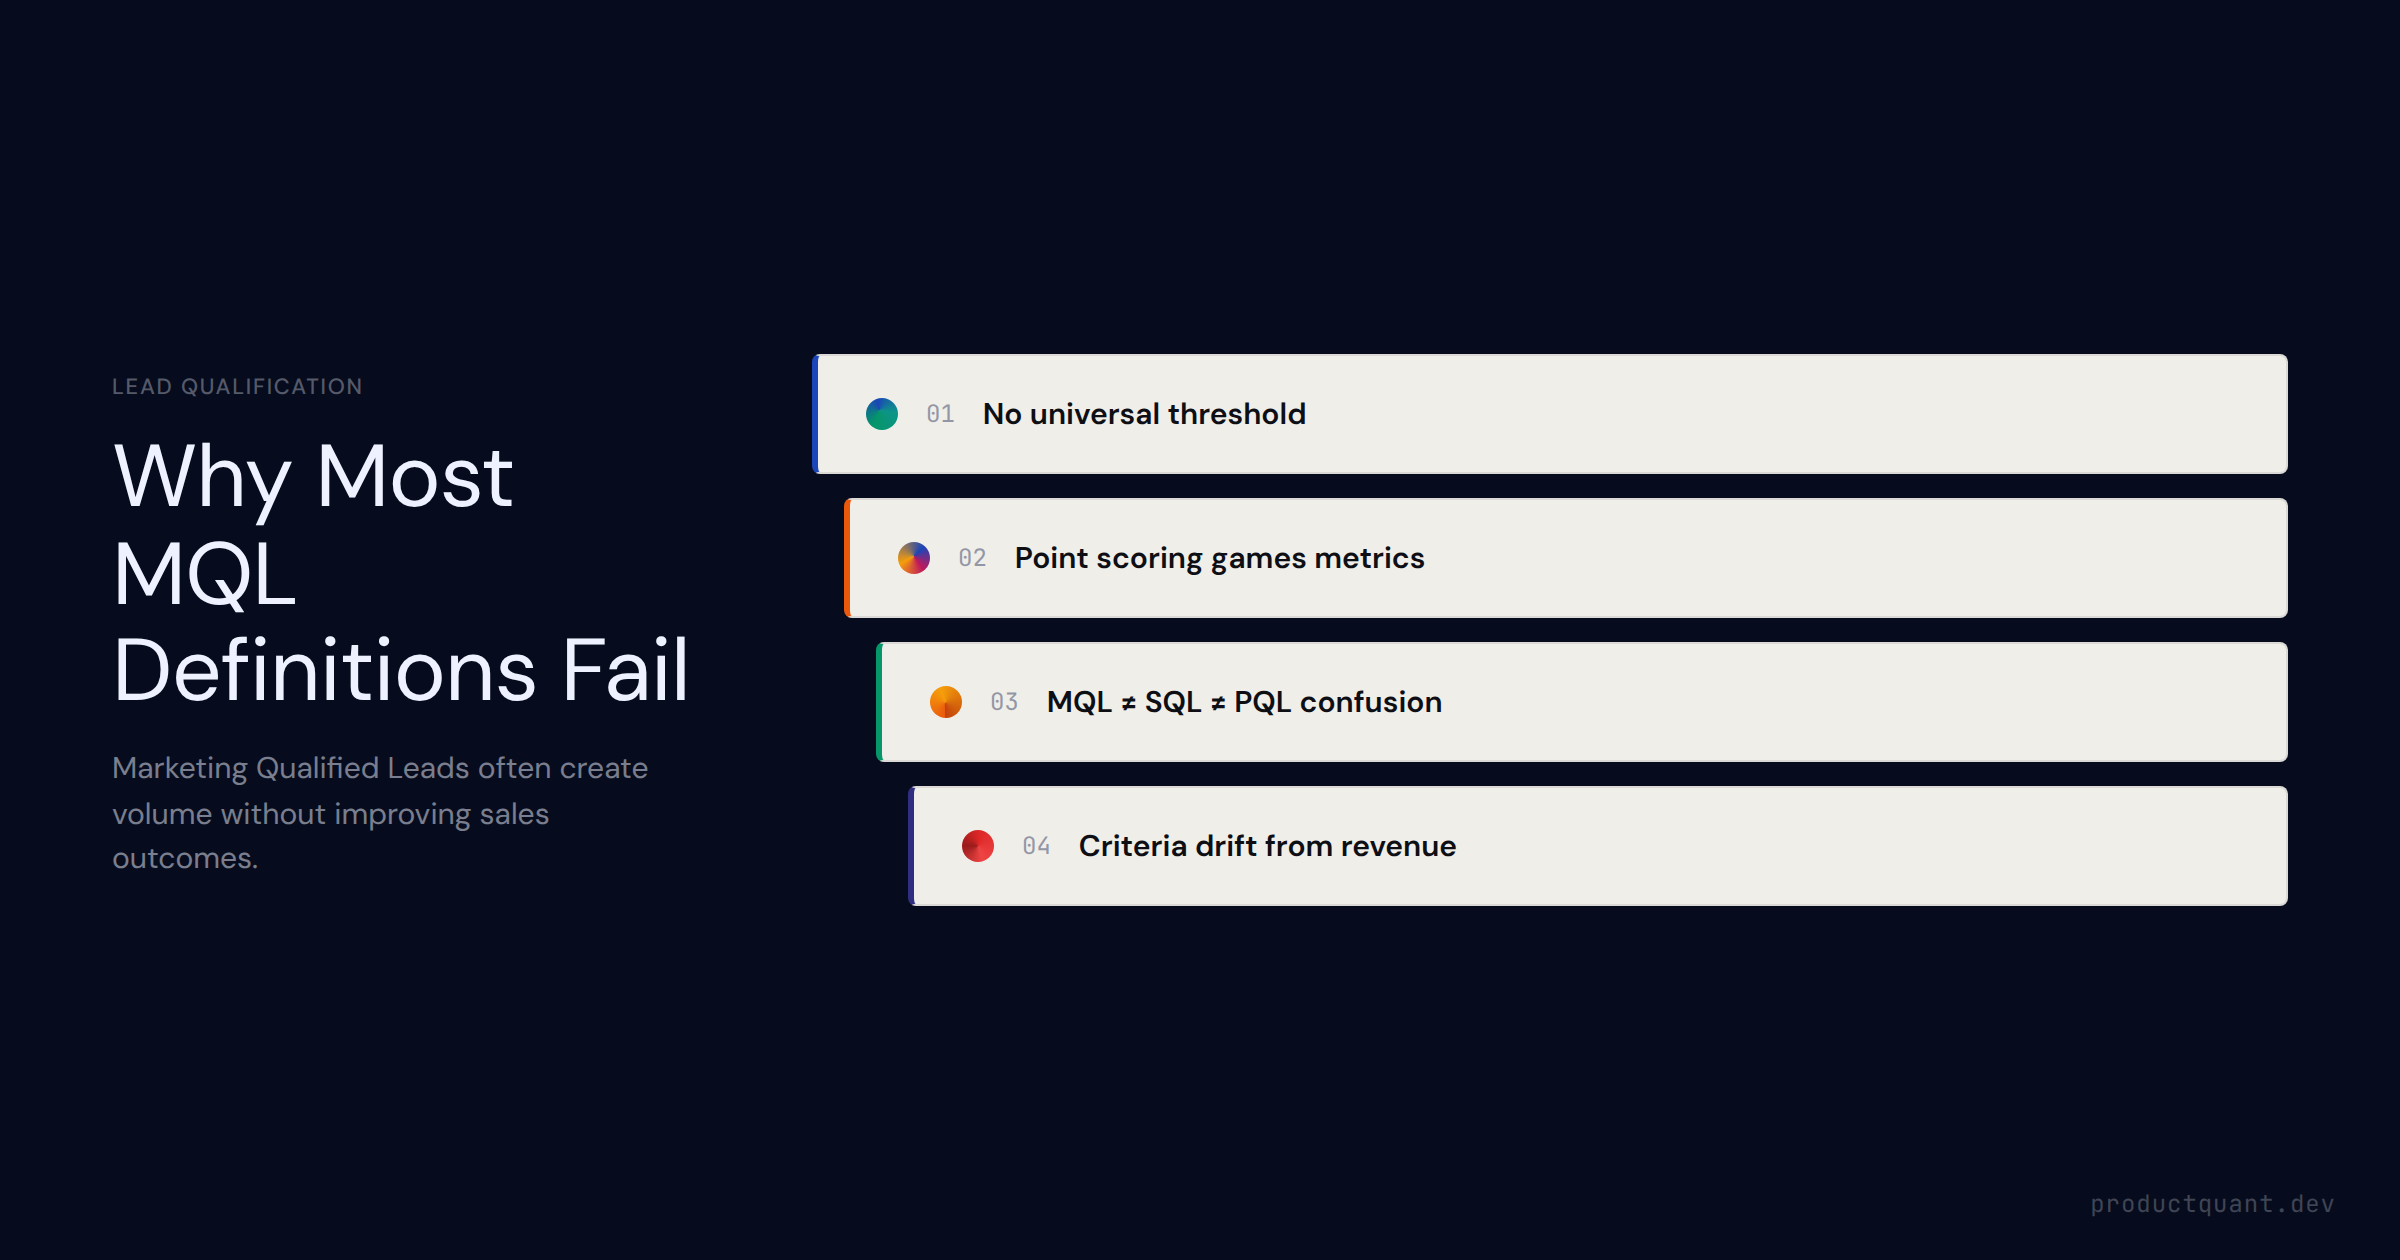
An MQL in SaaS is a lead who has shown enough marketing engagement to be worth sales attention — but most MQL definitions score activity, not intent. Learn how to fix that.
The 4 SaaS dashboard types by audience — executive, growth, customer success, product — which metrics belong on each, the design principles that make dashboards actionable, and why most fail.
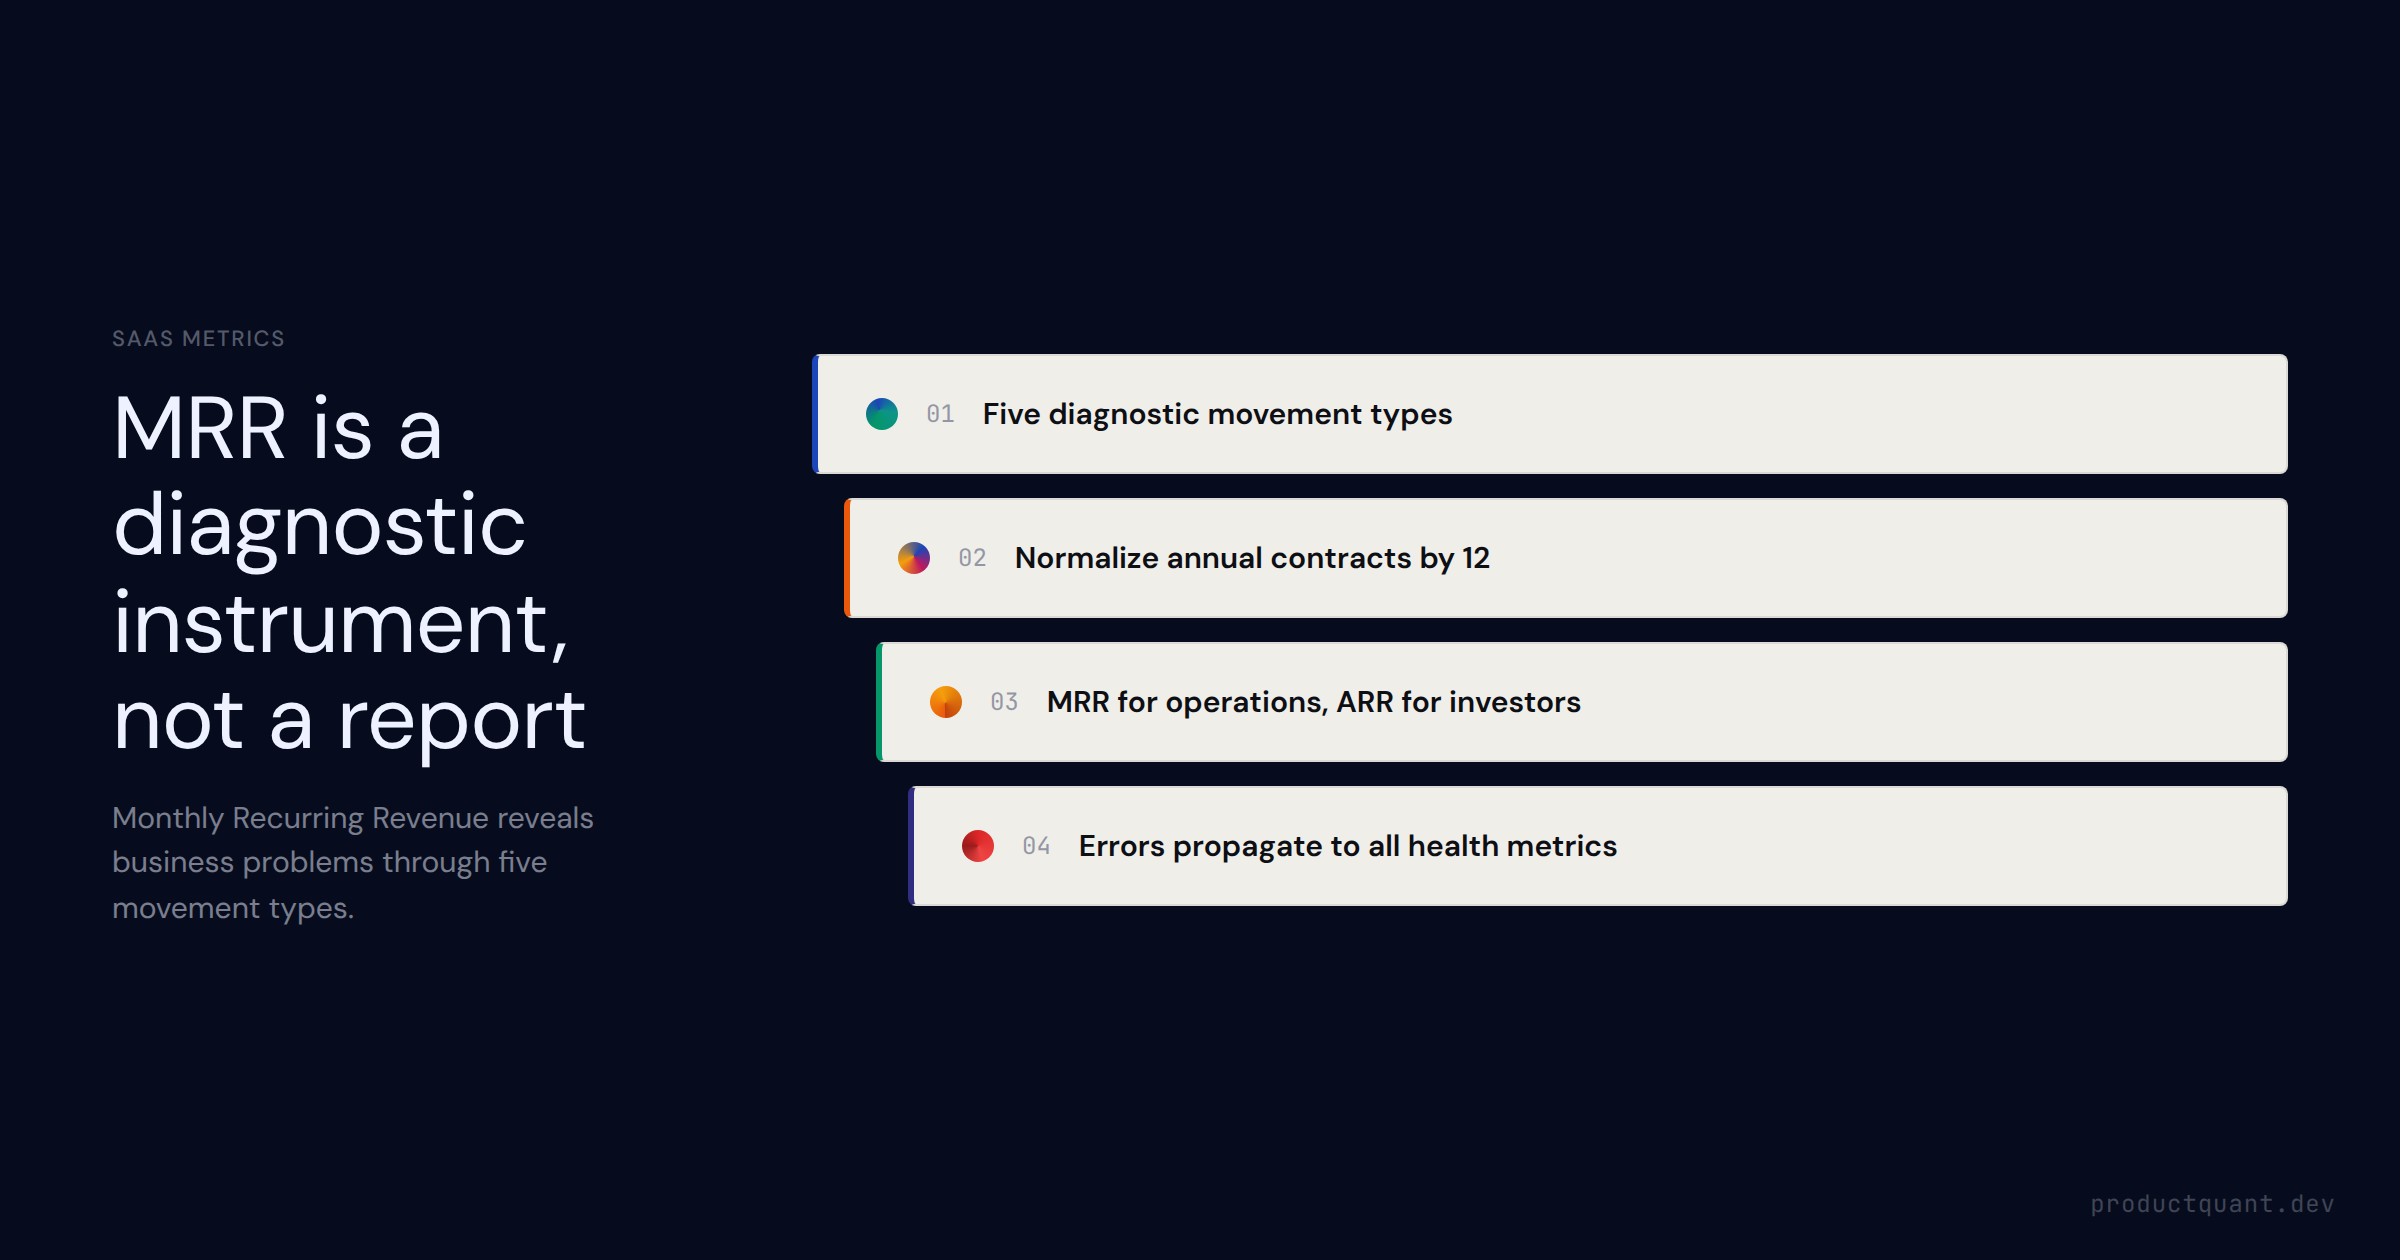
MRR is the fundamental SaaS health metric. Learn how to calculate MRR correctly, understand the five MRR movement types, read waterfall charts, and benchmark growth rates by ARR stage.
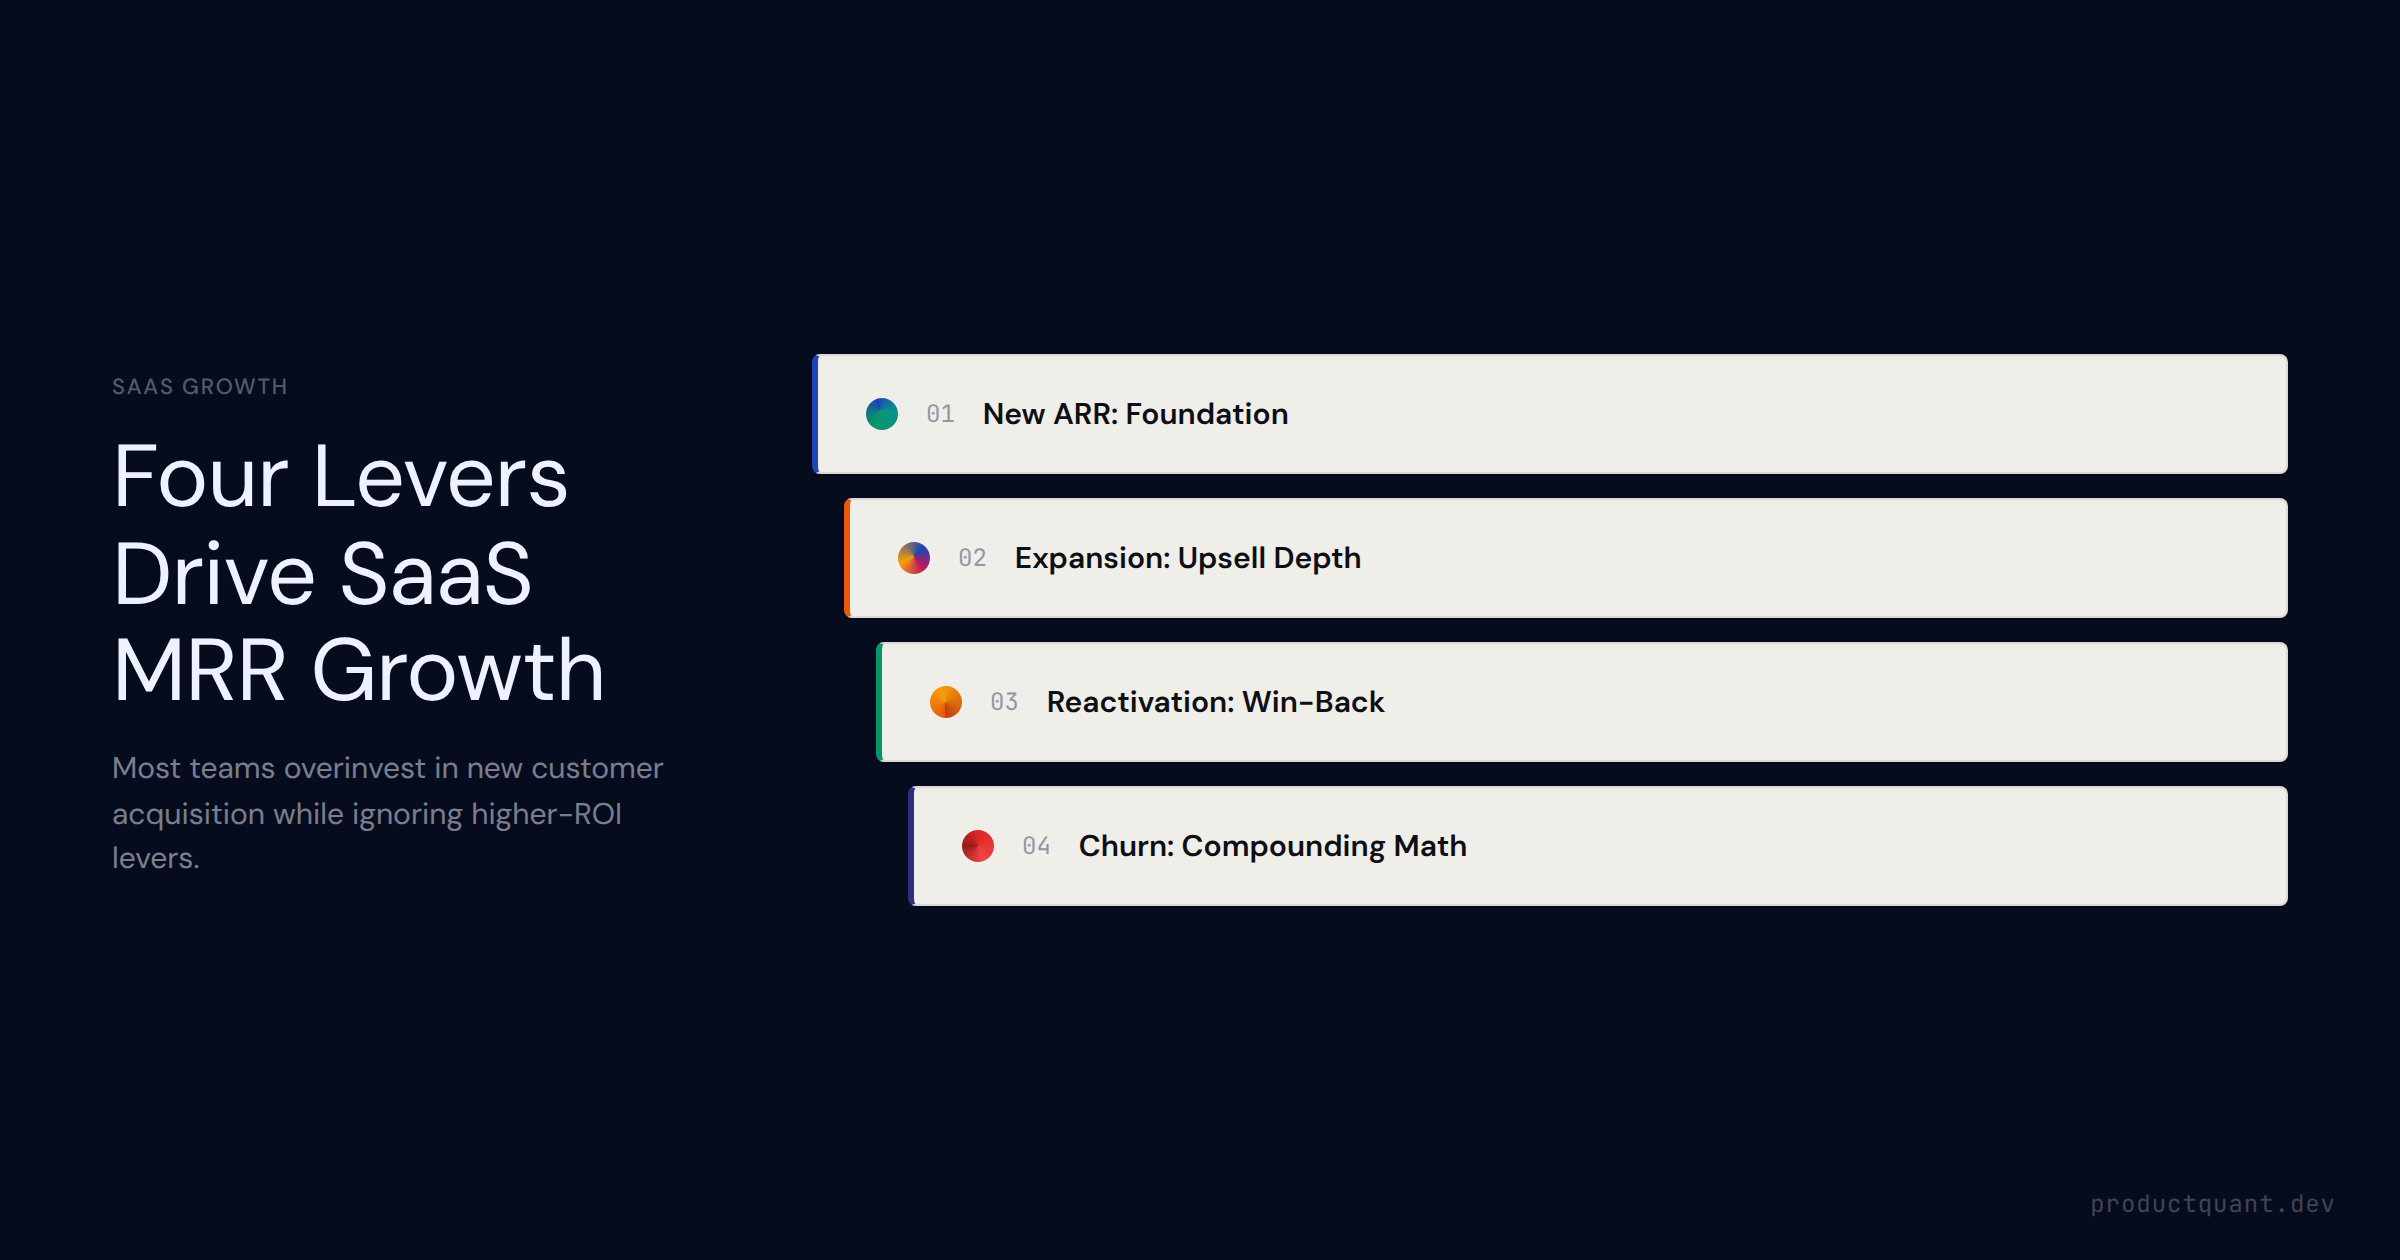
Most SaaS teams over-invest in new ARR while leaving expansion and churn reduction — the highest-ROI levers at most ARR stages — almost untouched. Here is how to prioritize the four MRR growth levers by stage.
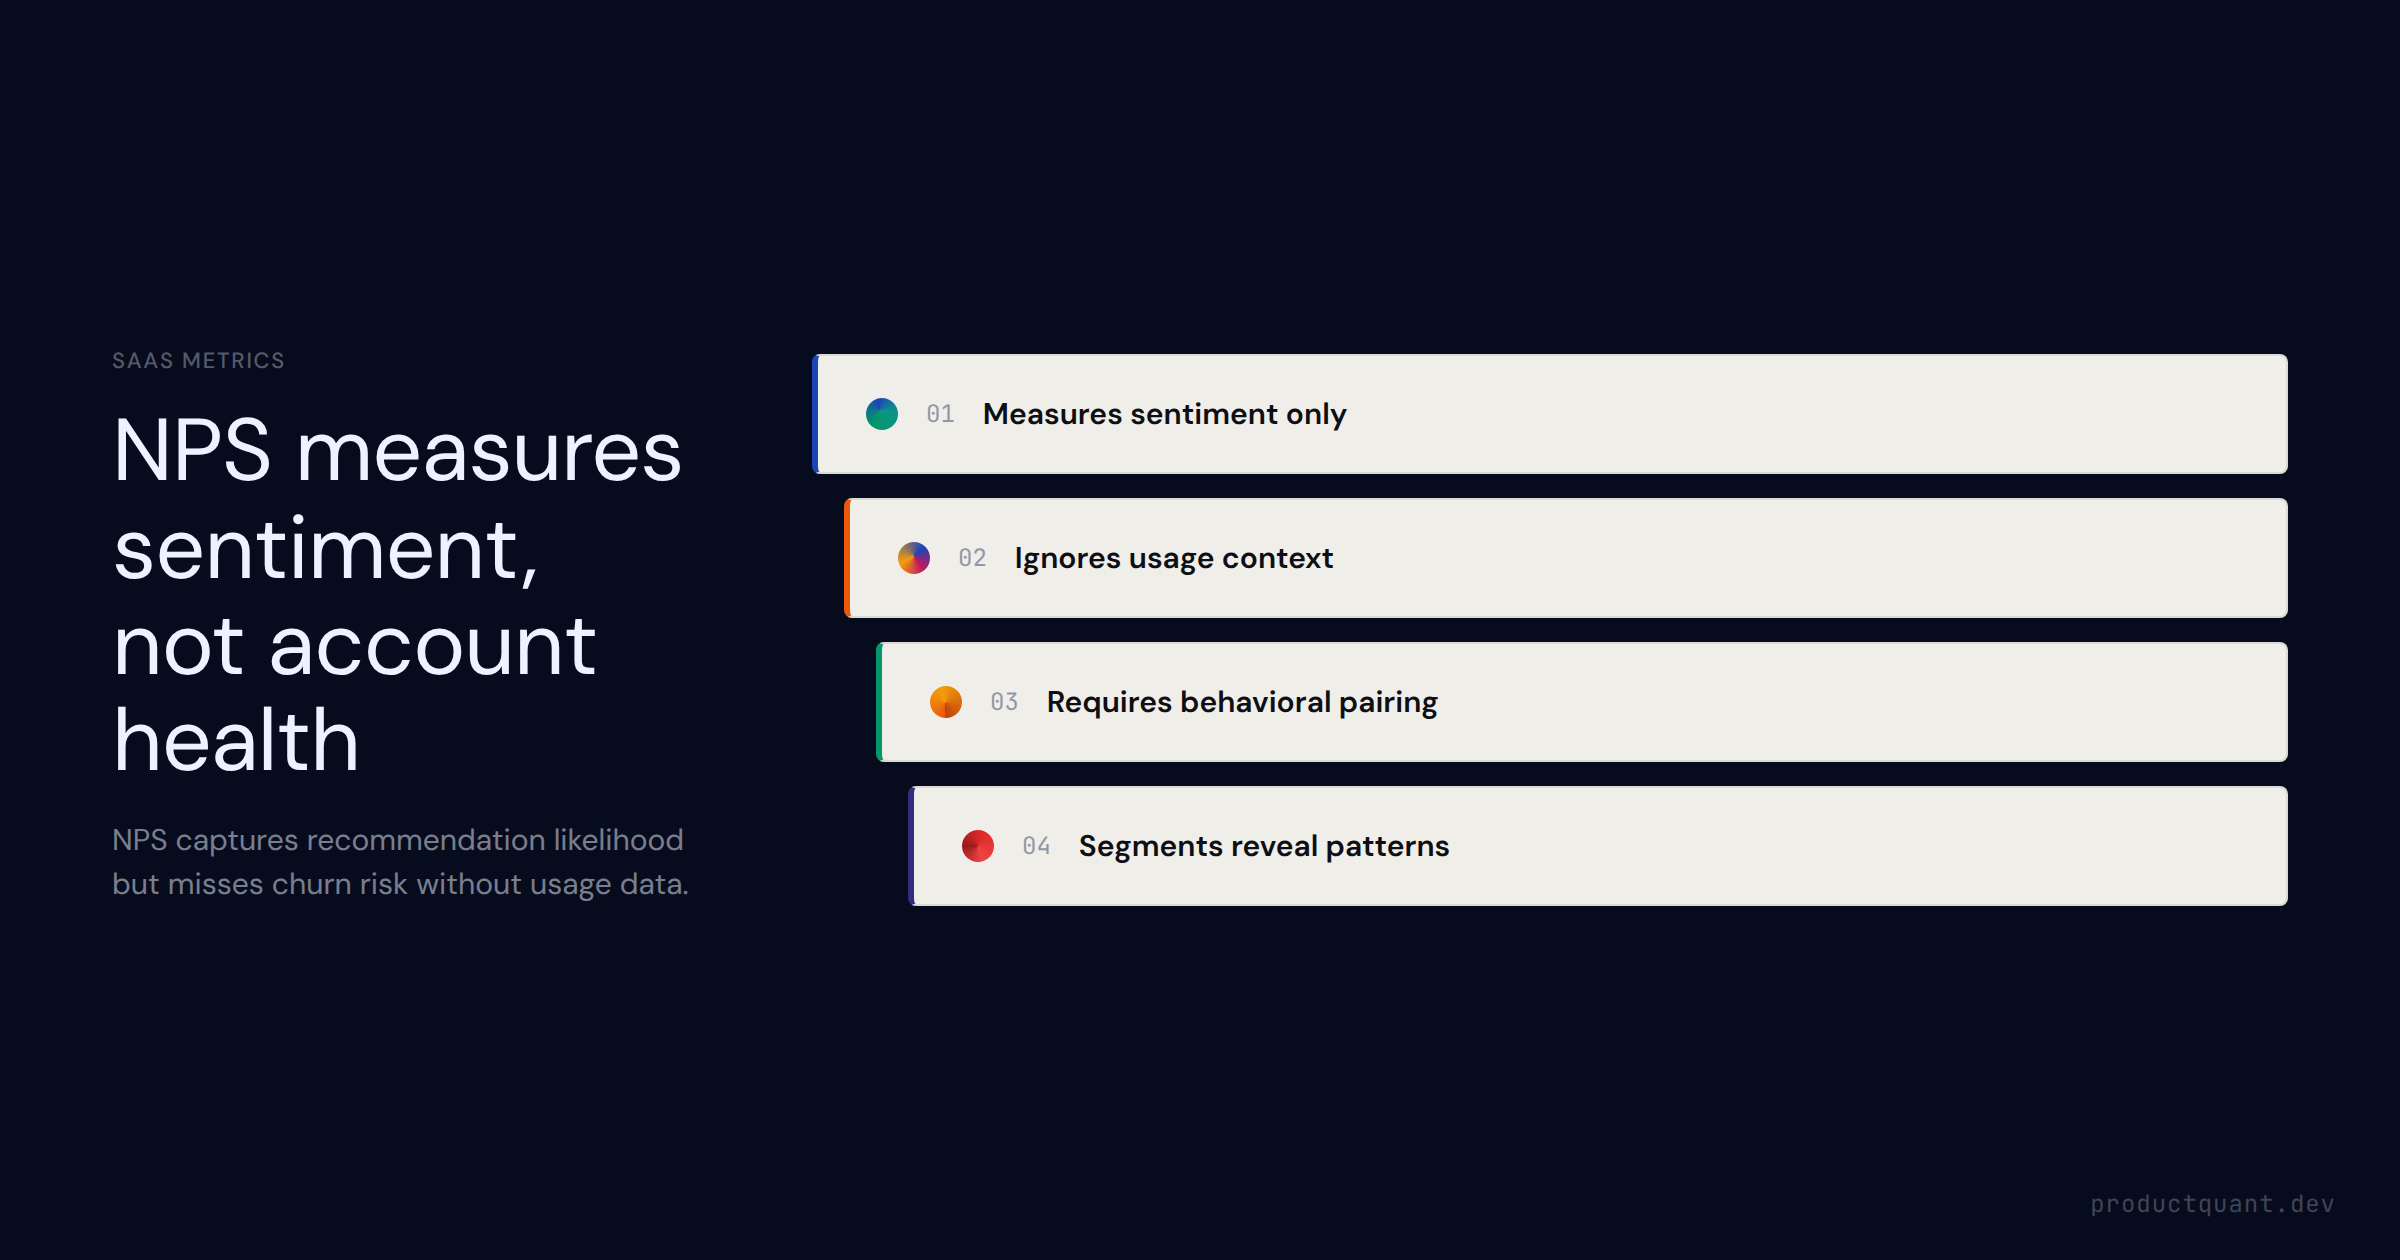
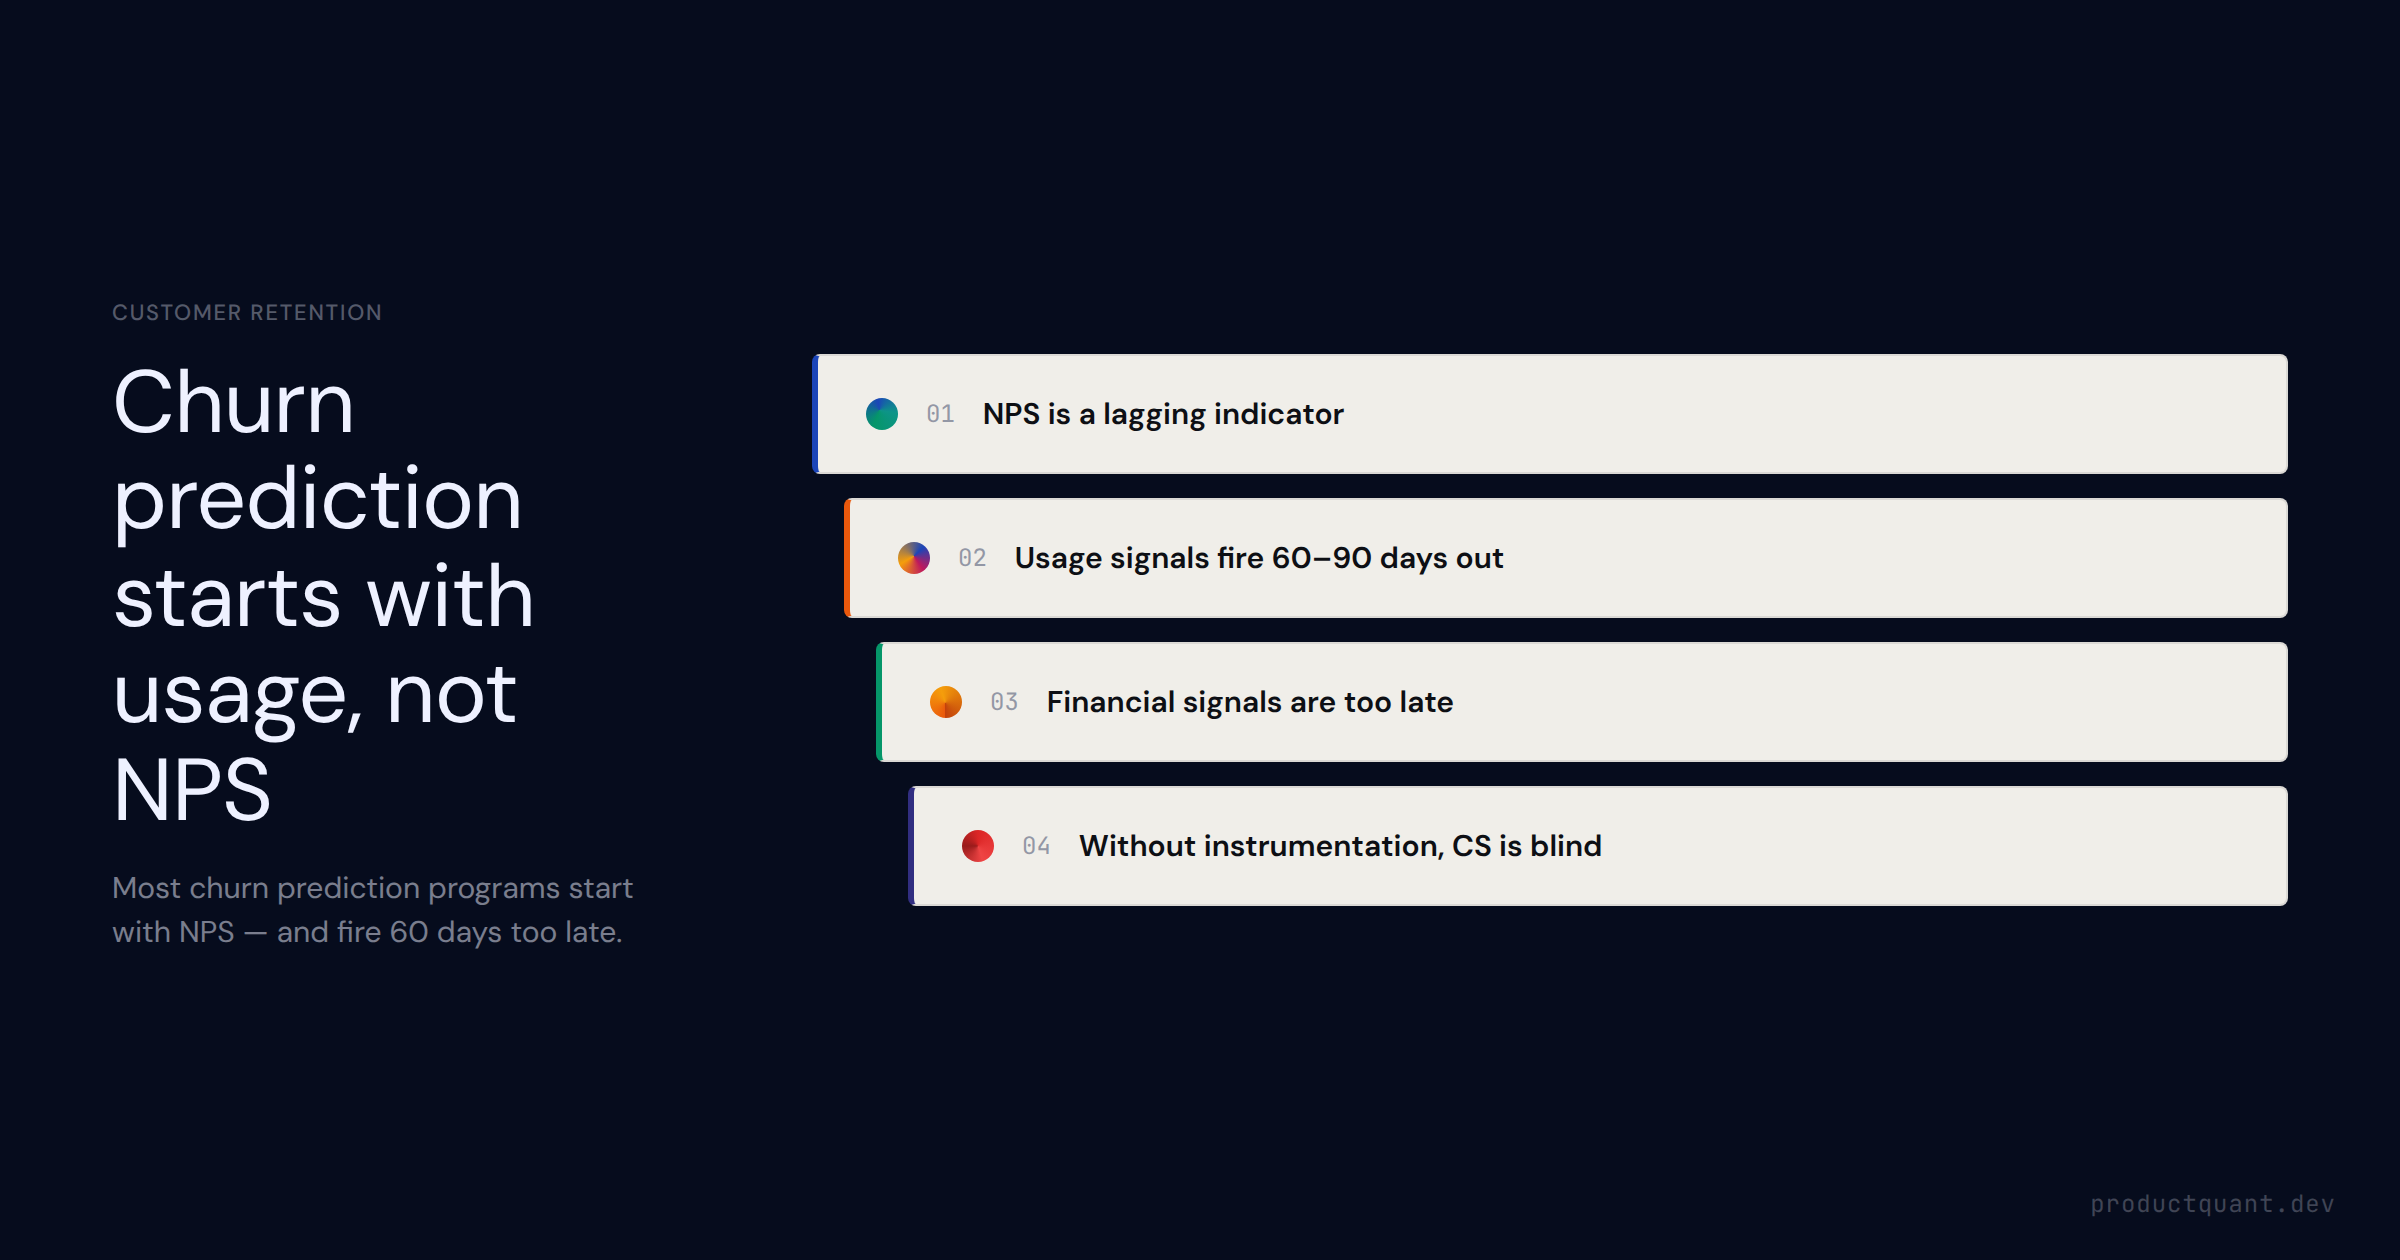
NPS tells you sentiment. It doesn
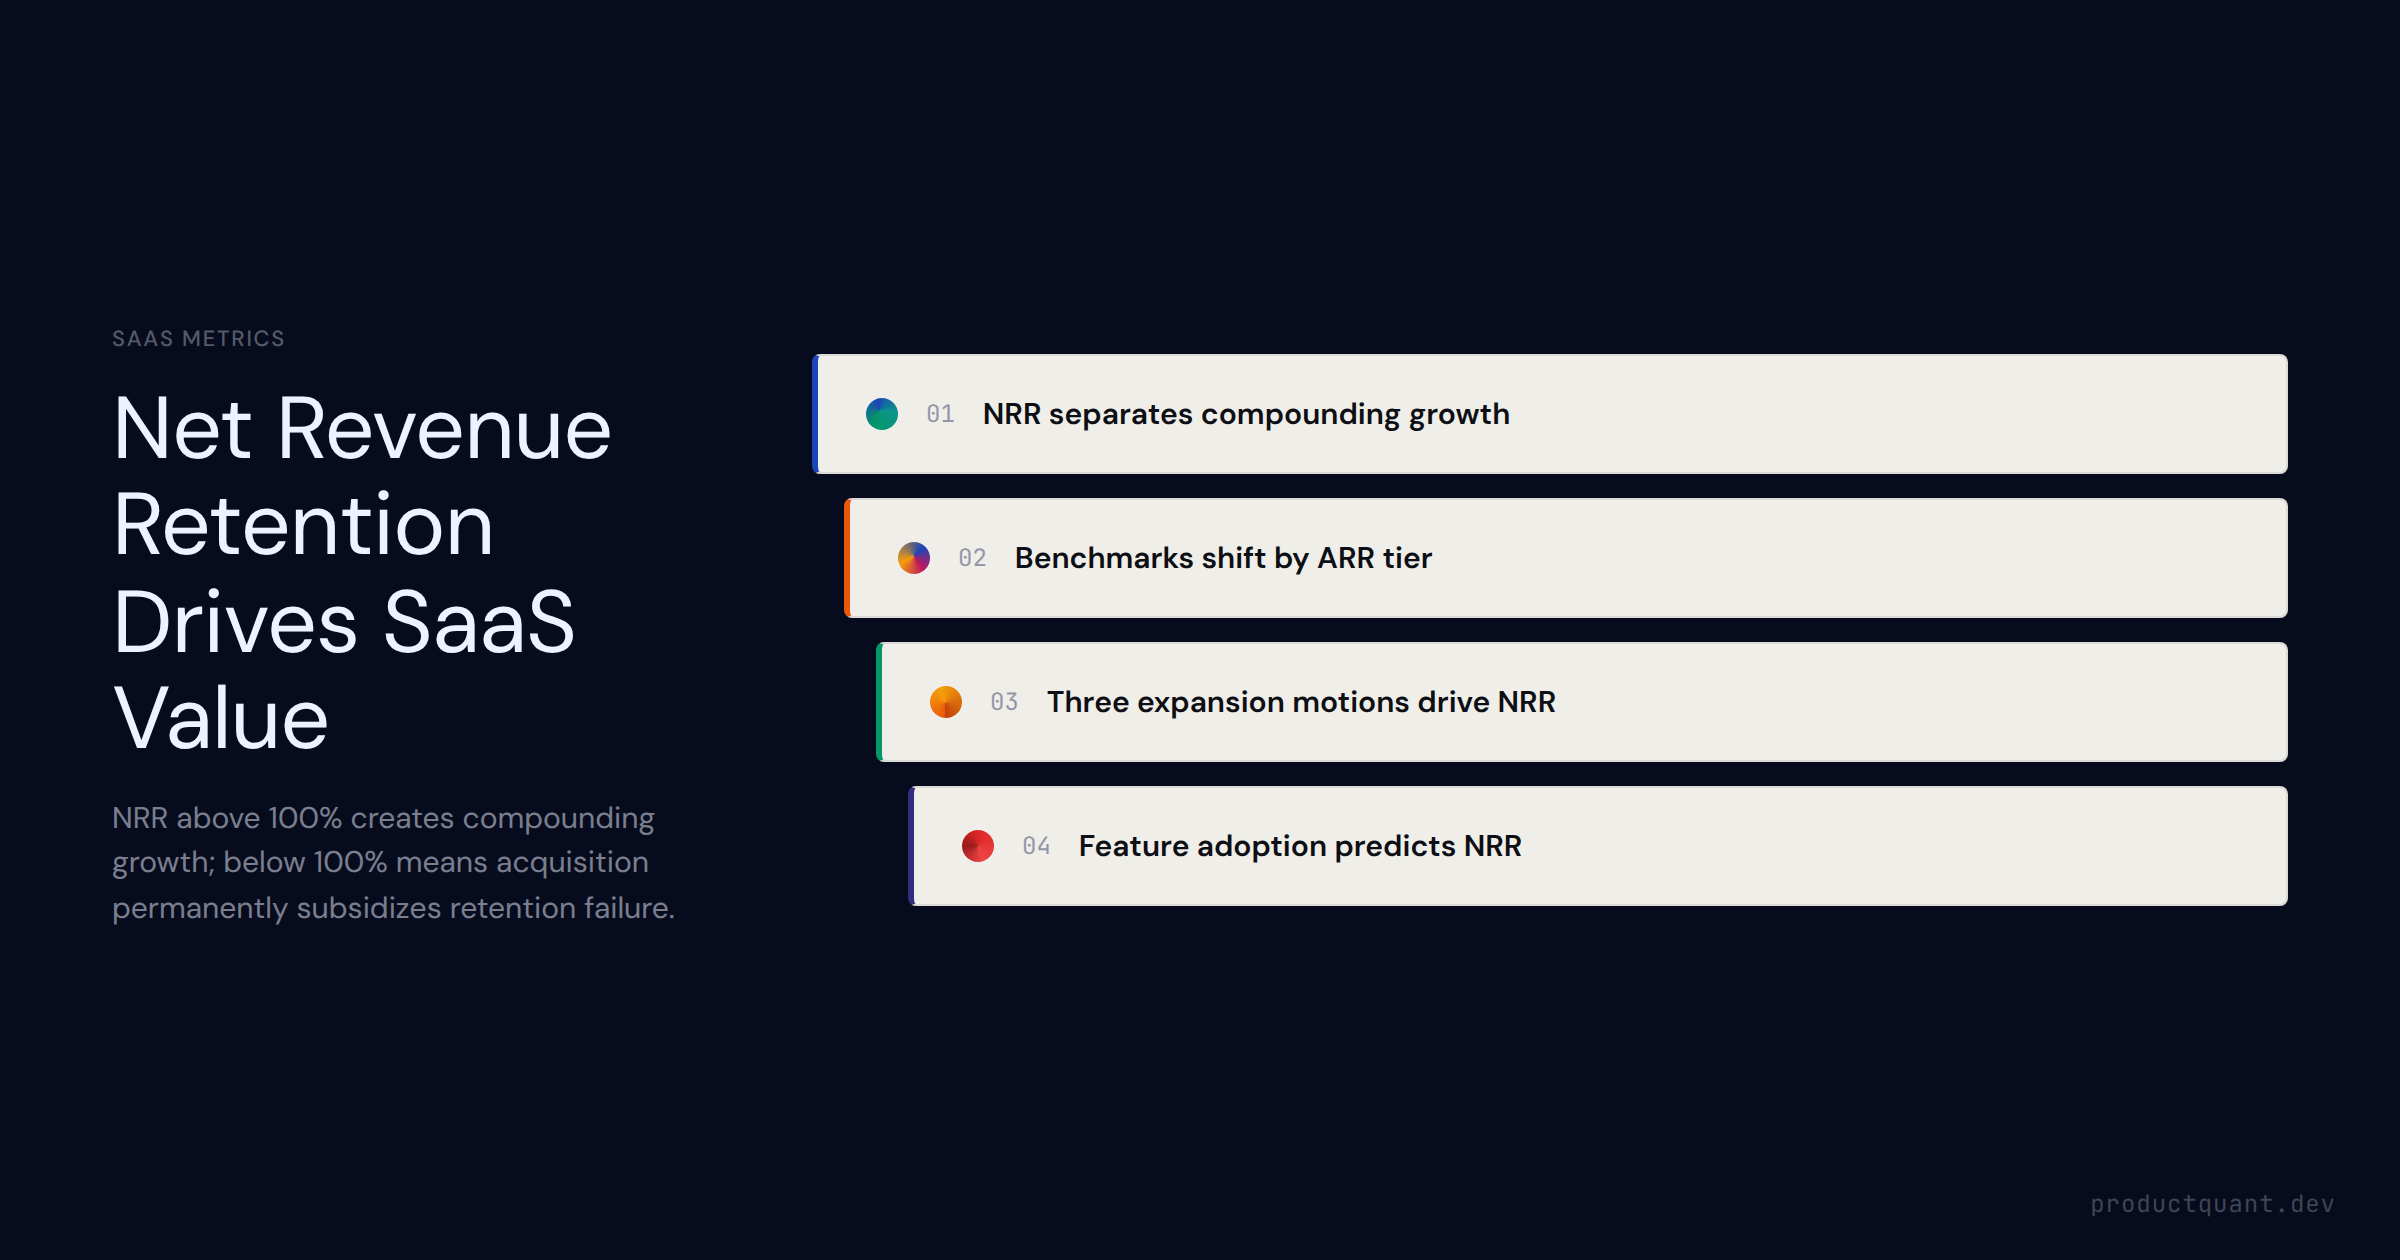
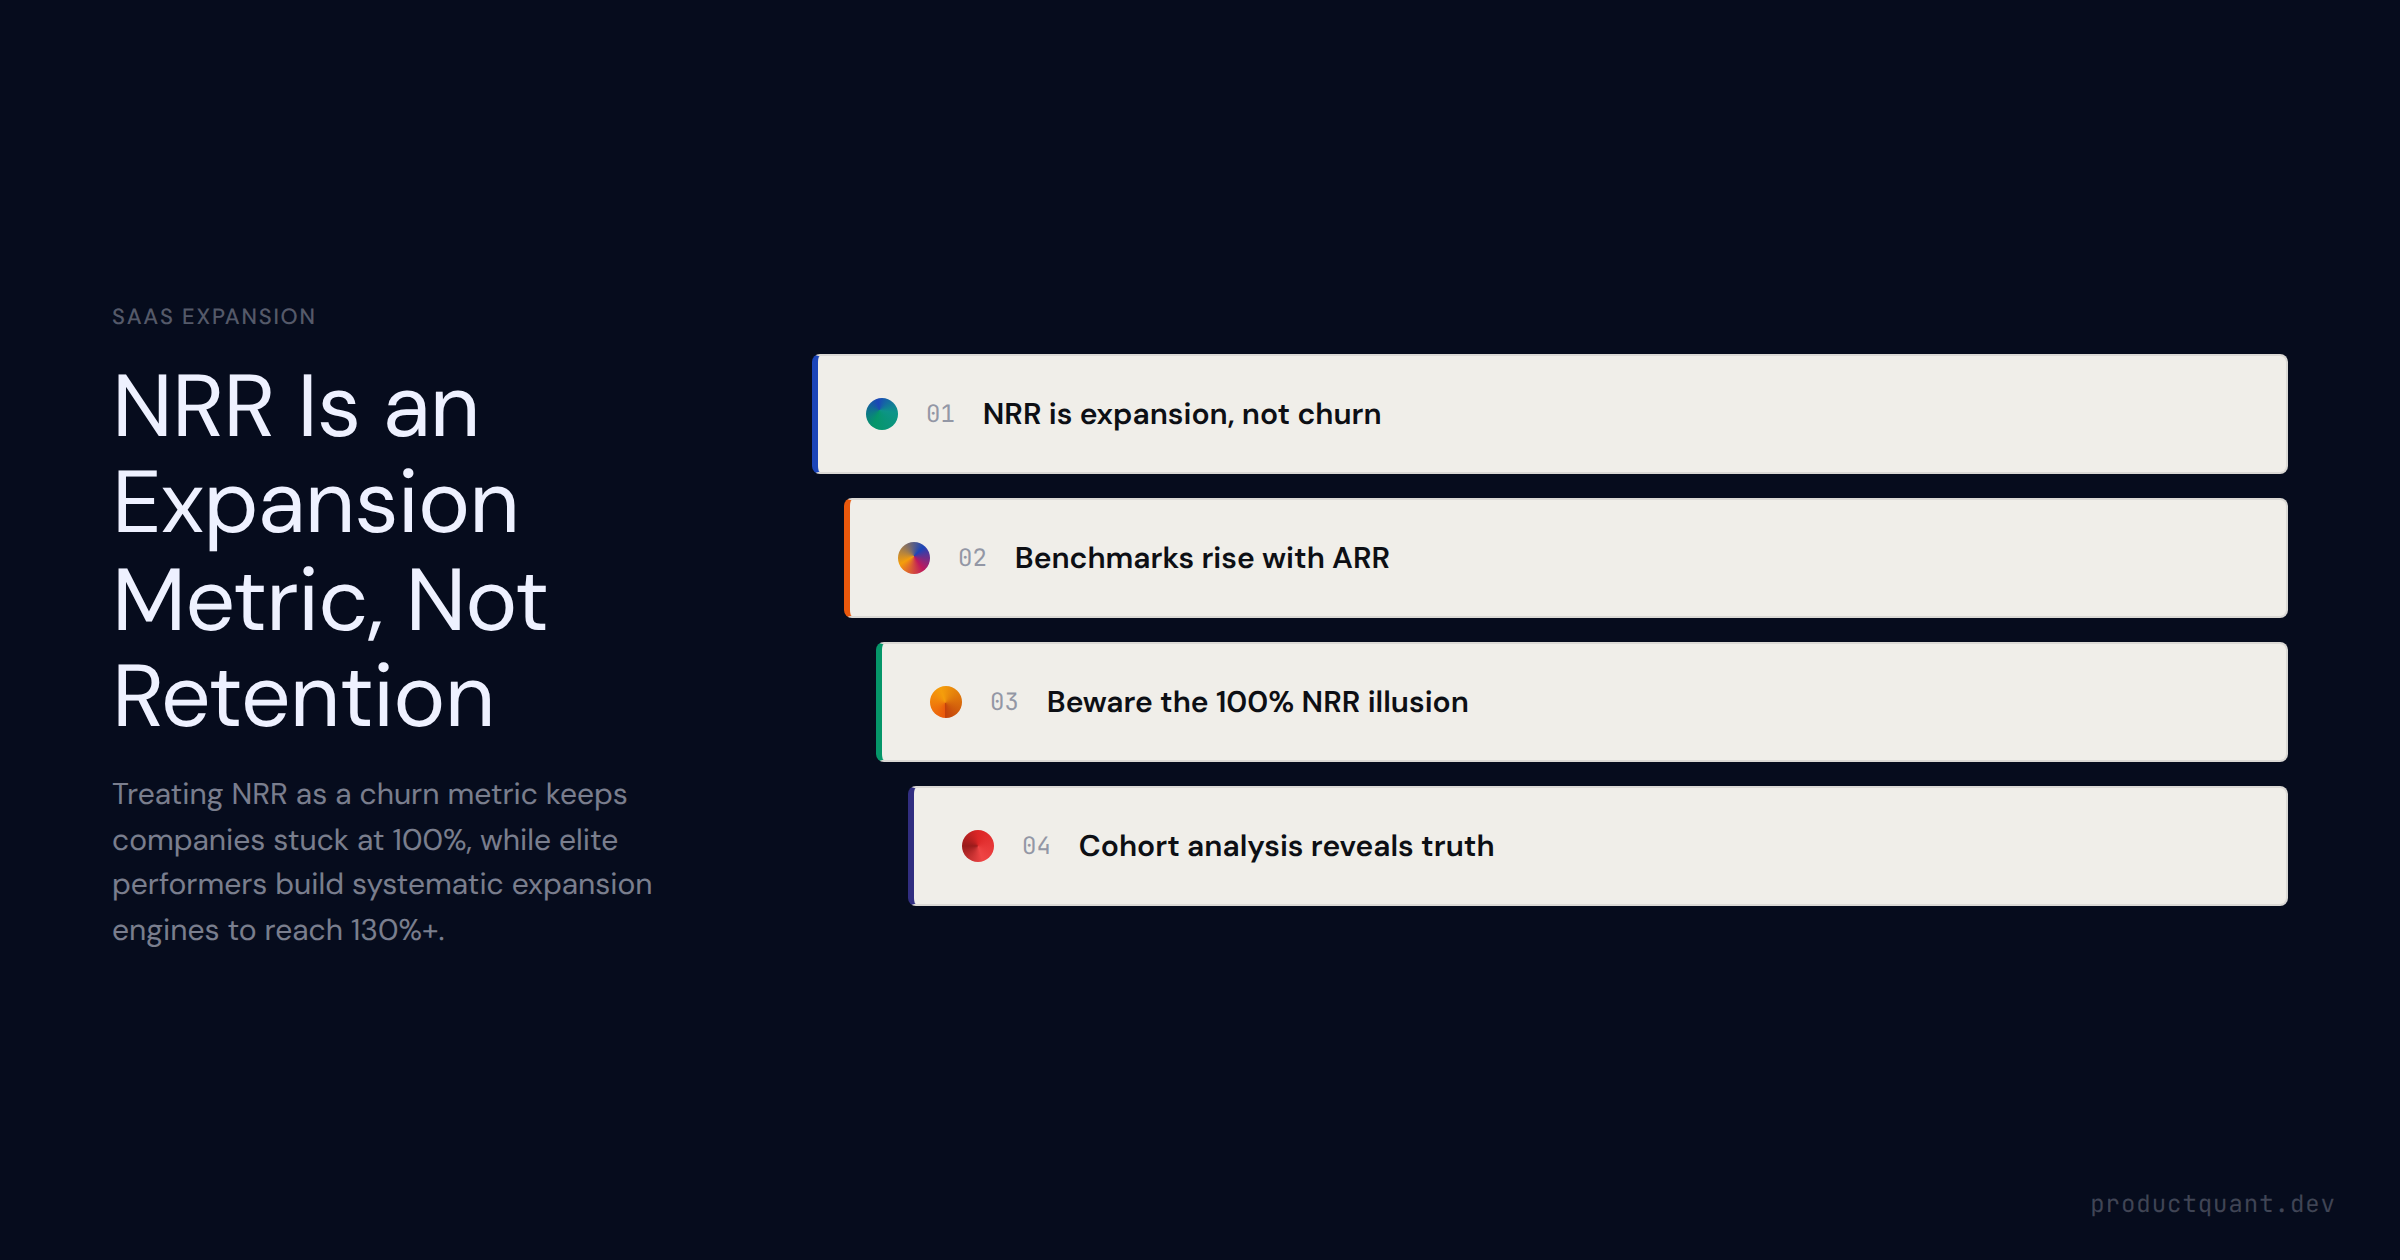
NRR is the compounding growth metric in SaaS. Learn the NRR formula, component definitions, benchmark by ARR tier, and which expansion motions push NRR above 100%.
NRR benchmarks by ARR tier for 2026. What
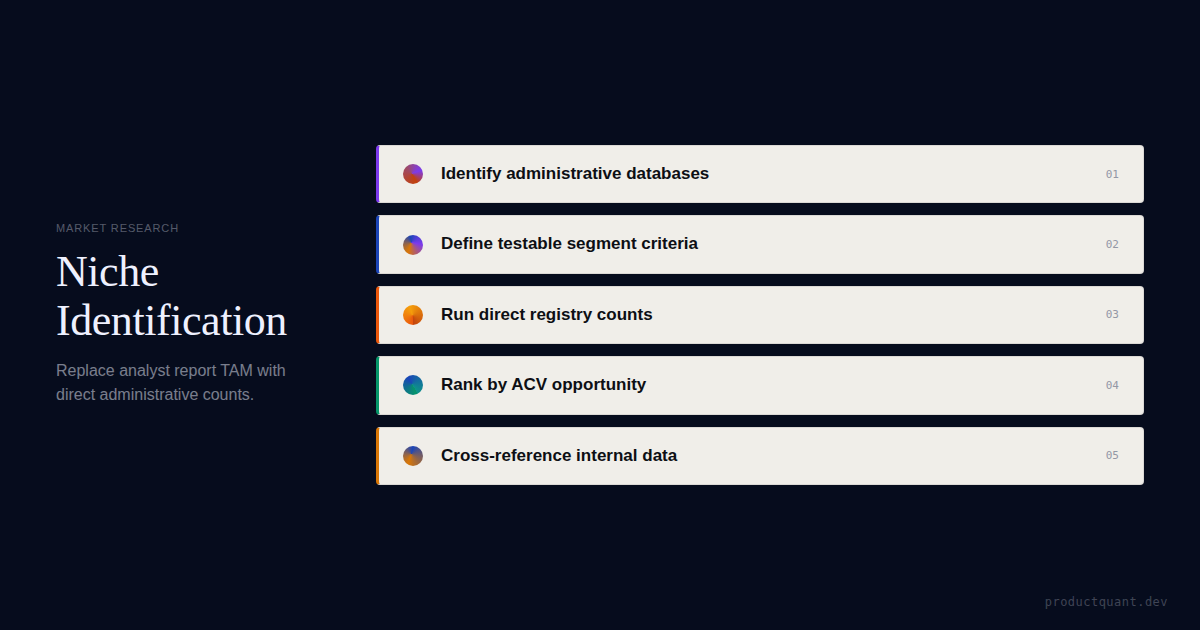
How to find your highest-opportunity market segment using public government databases — and cross-validate it with your own product usage data for a...
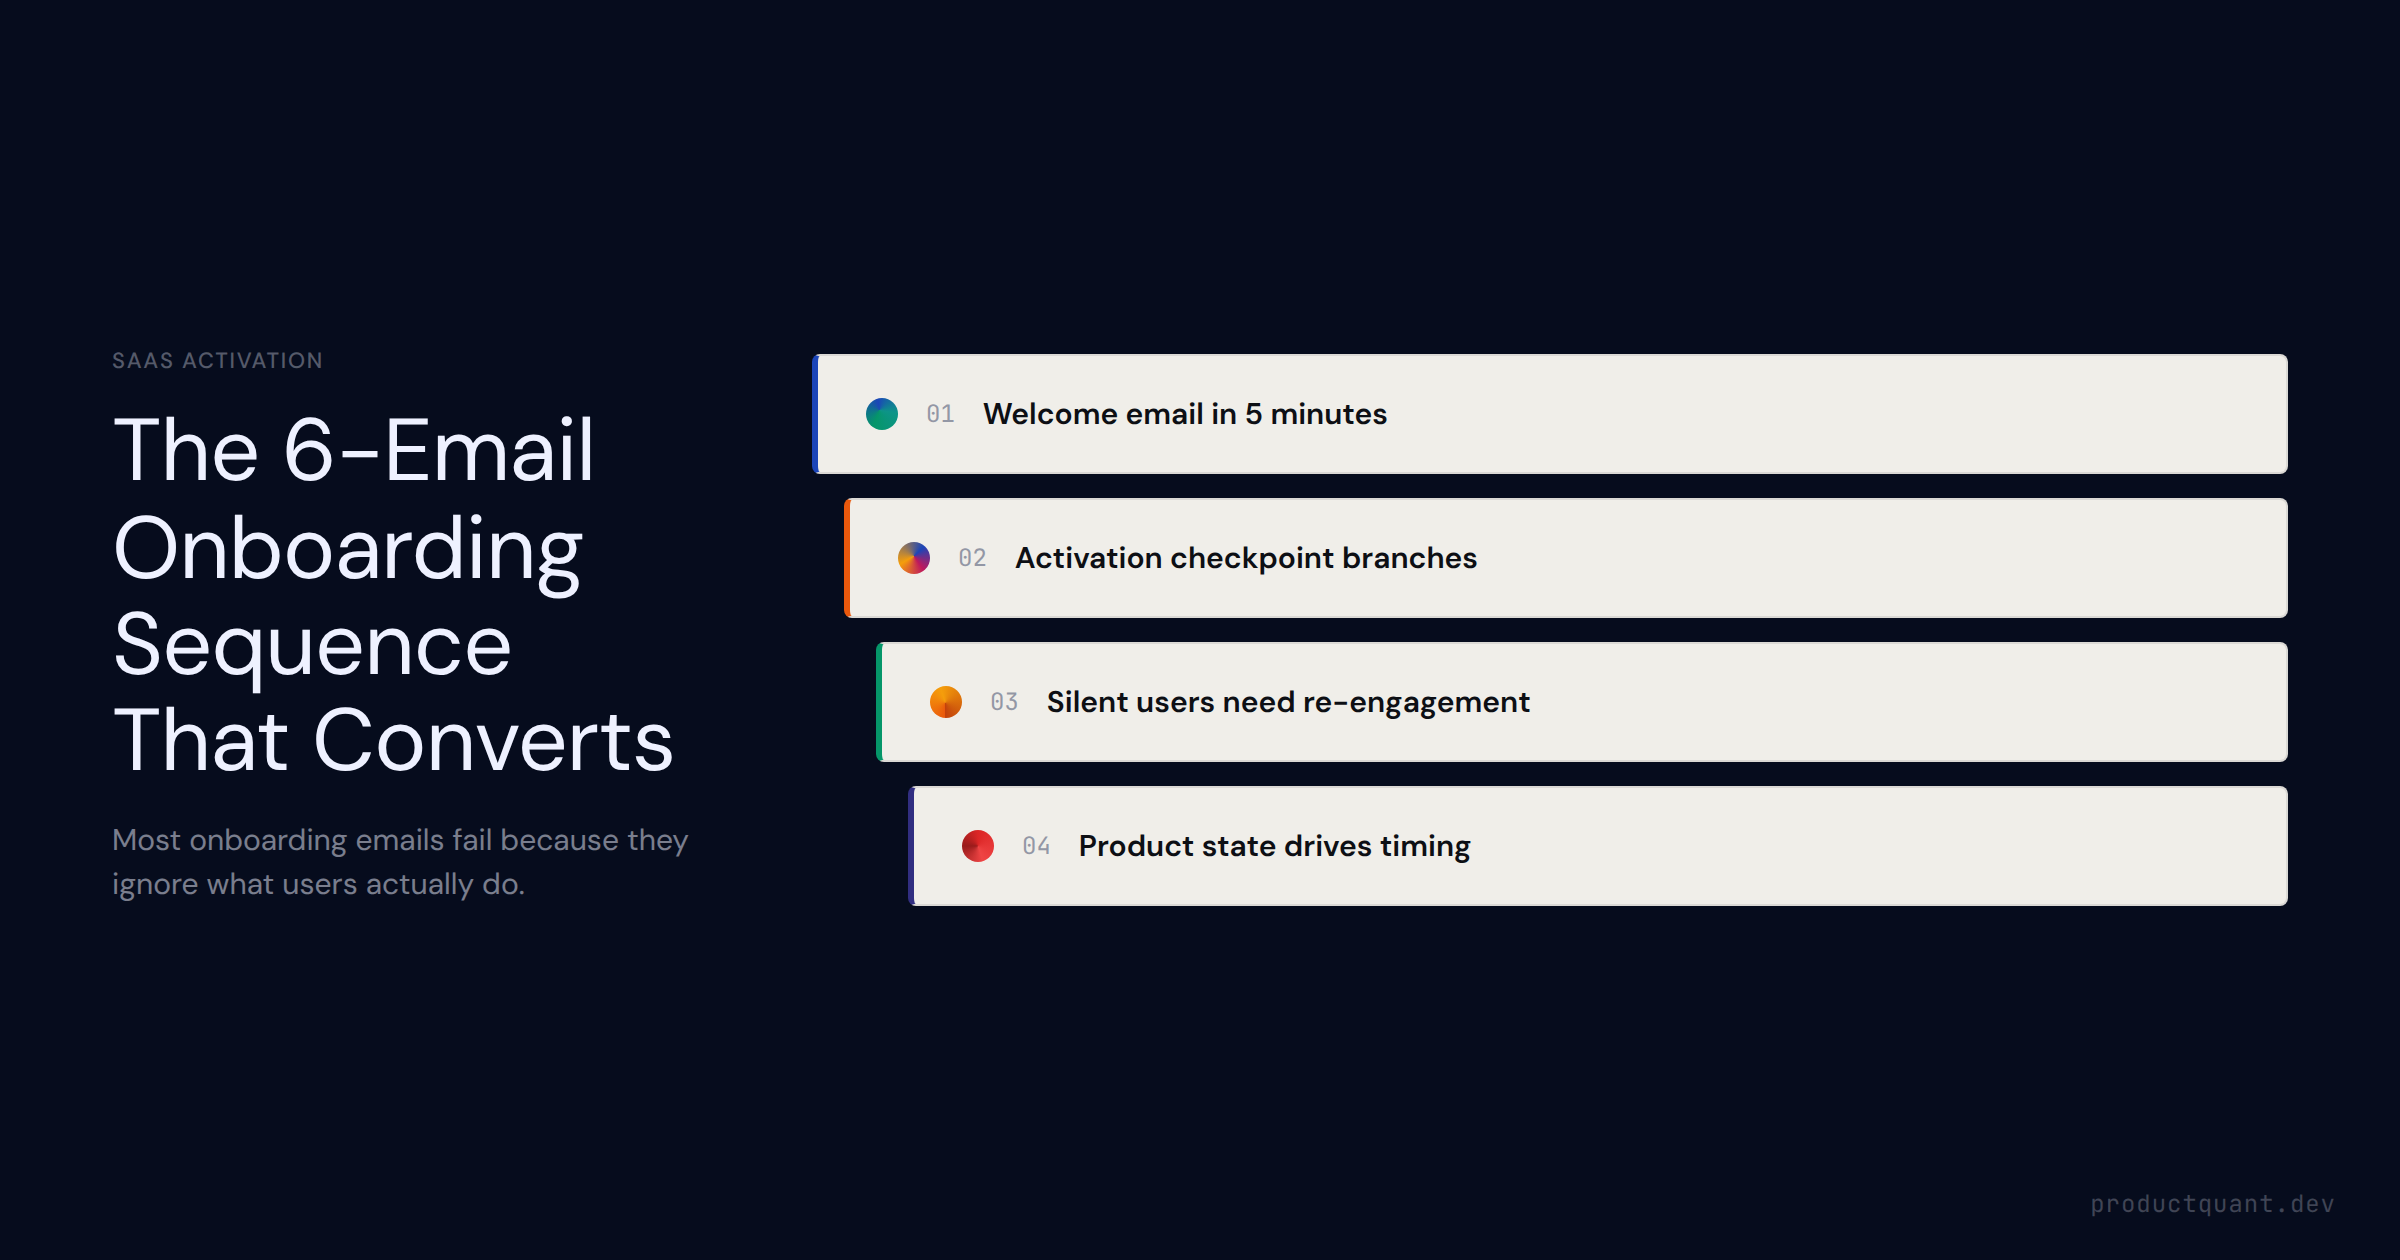
The complete 6-email SaaS onboarding sequence — Welcome through Expansion Offer — with send timing, behavioral triggers, fallback logic for silent users, re-engagement branching, and benchmarks by GTM motion.
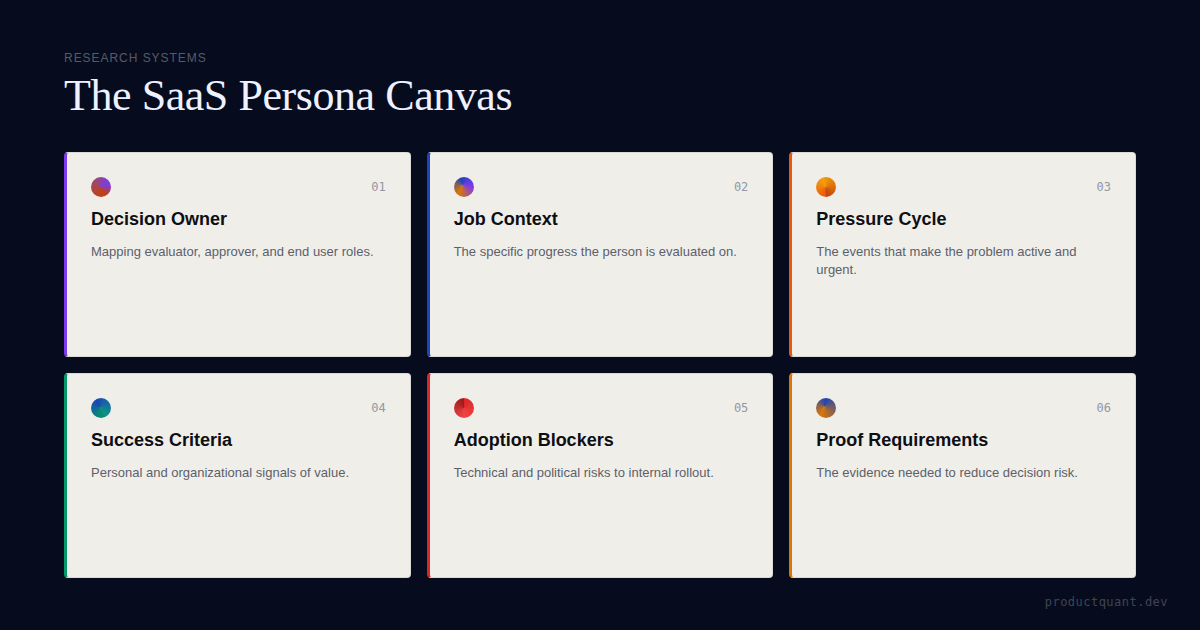
A practical persona canvas for B2B SaaS teams that models the decision owner, job context, buying pressure, adoption blockers, and success criteria...
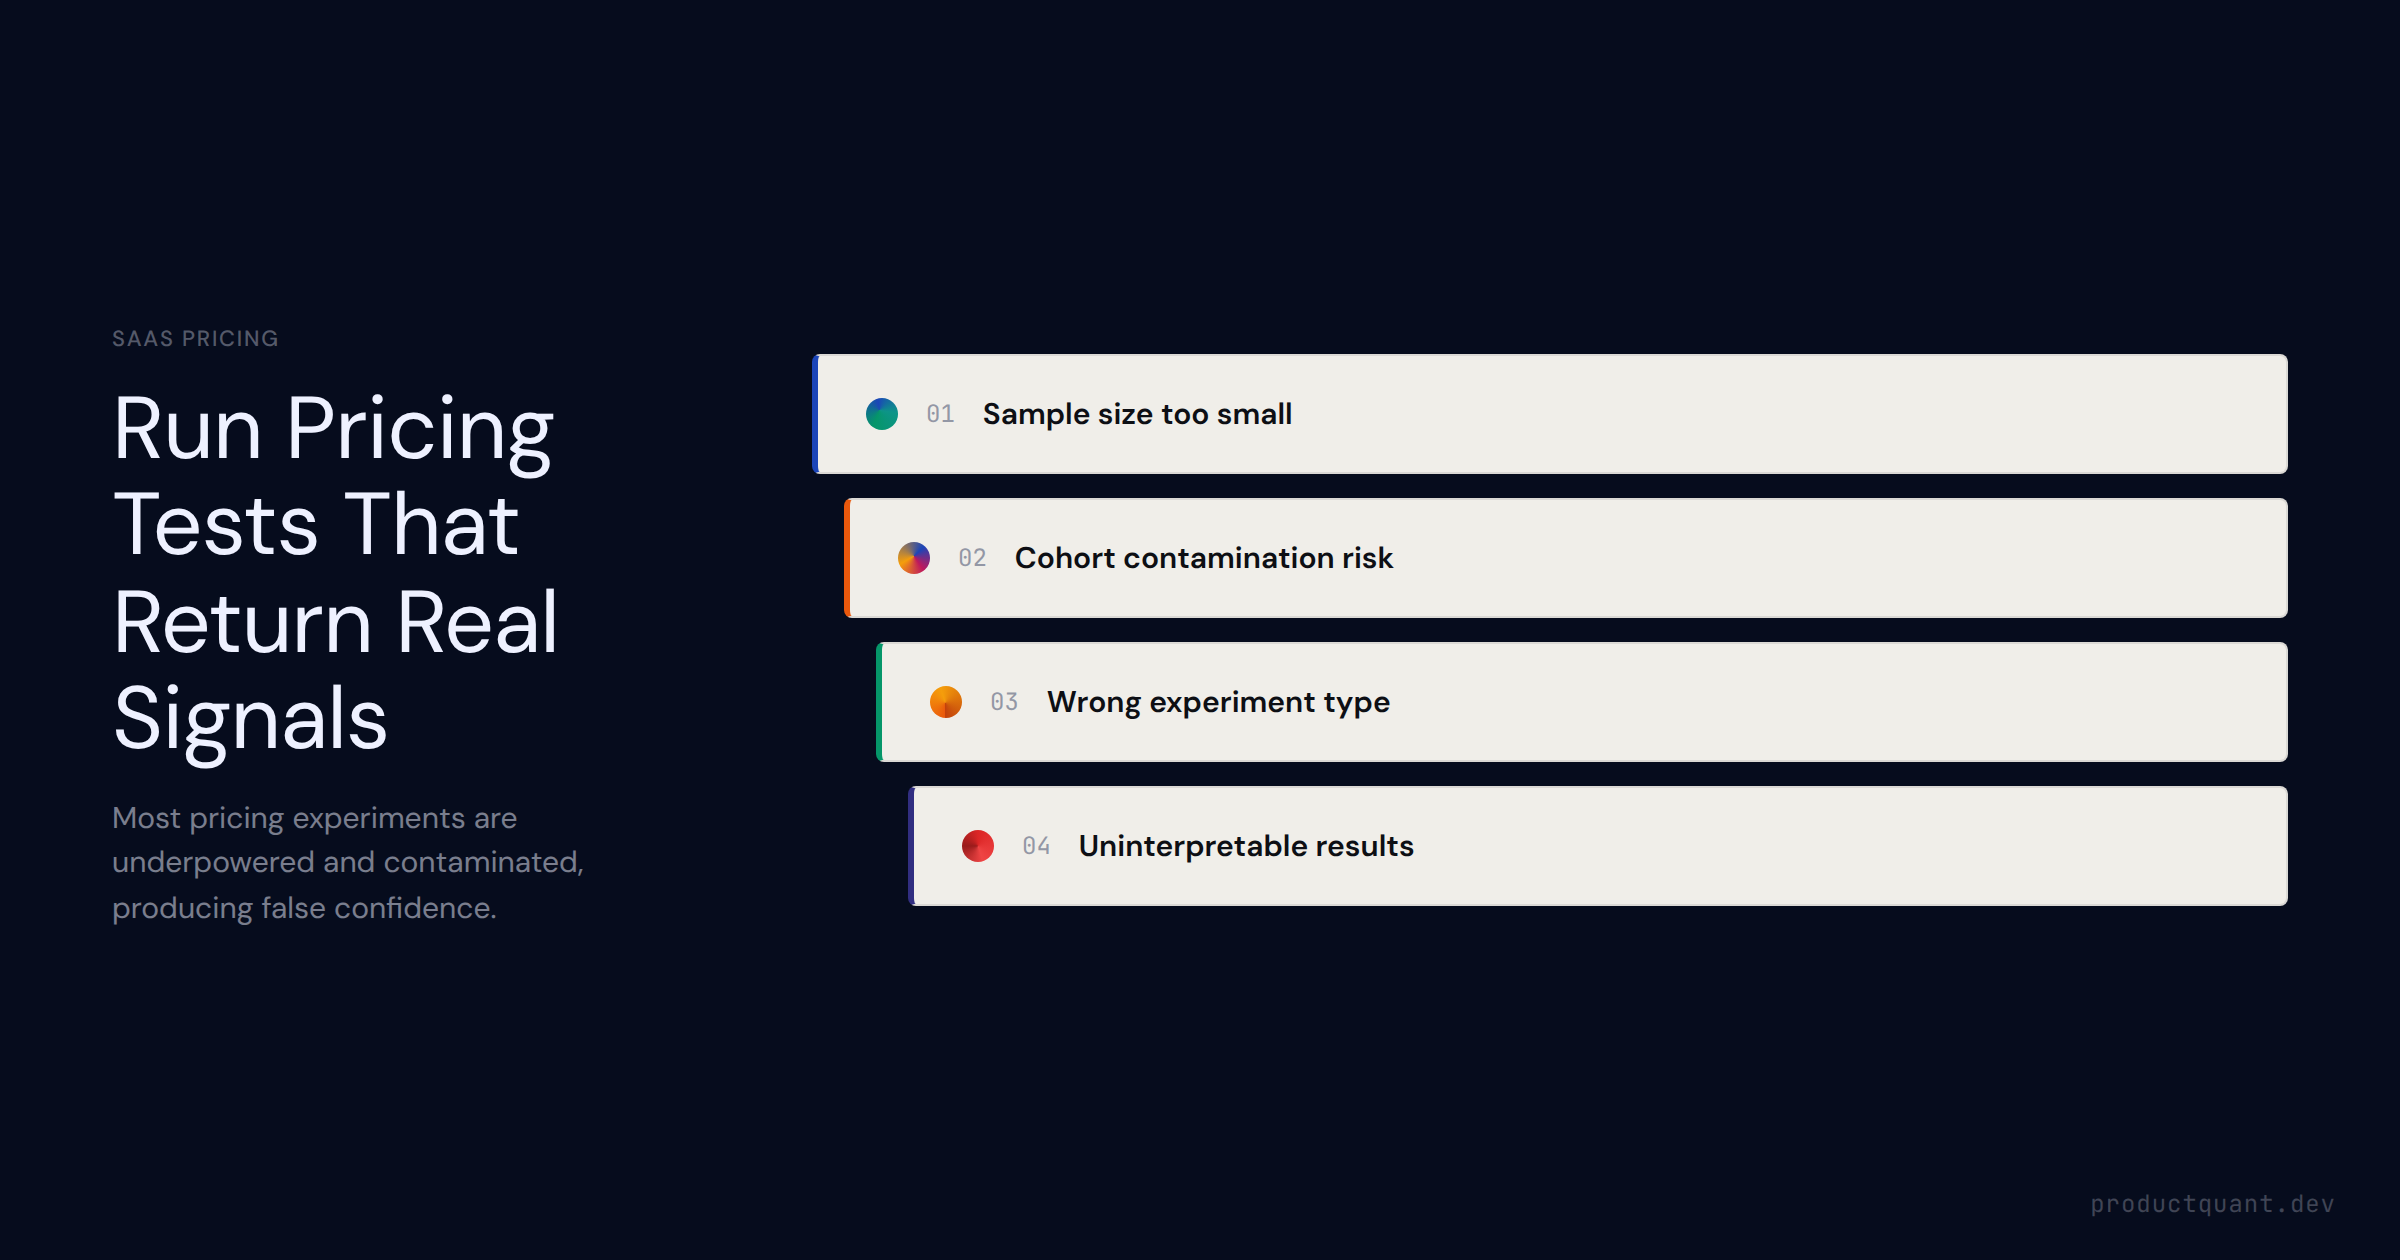
Most SaaS pricing experiments are underpowered, contaminated, or both. Here is how to design controlled pricing tests that return real signals — and how to use product usage data to predict price sensitivity before you c
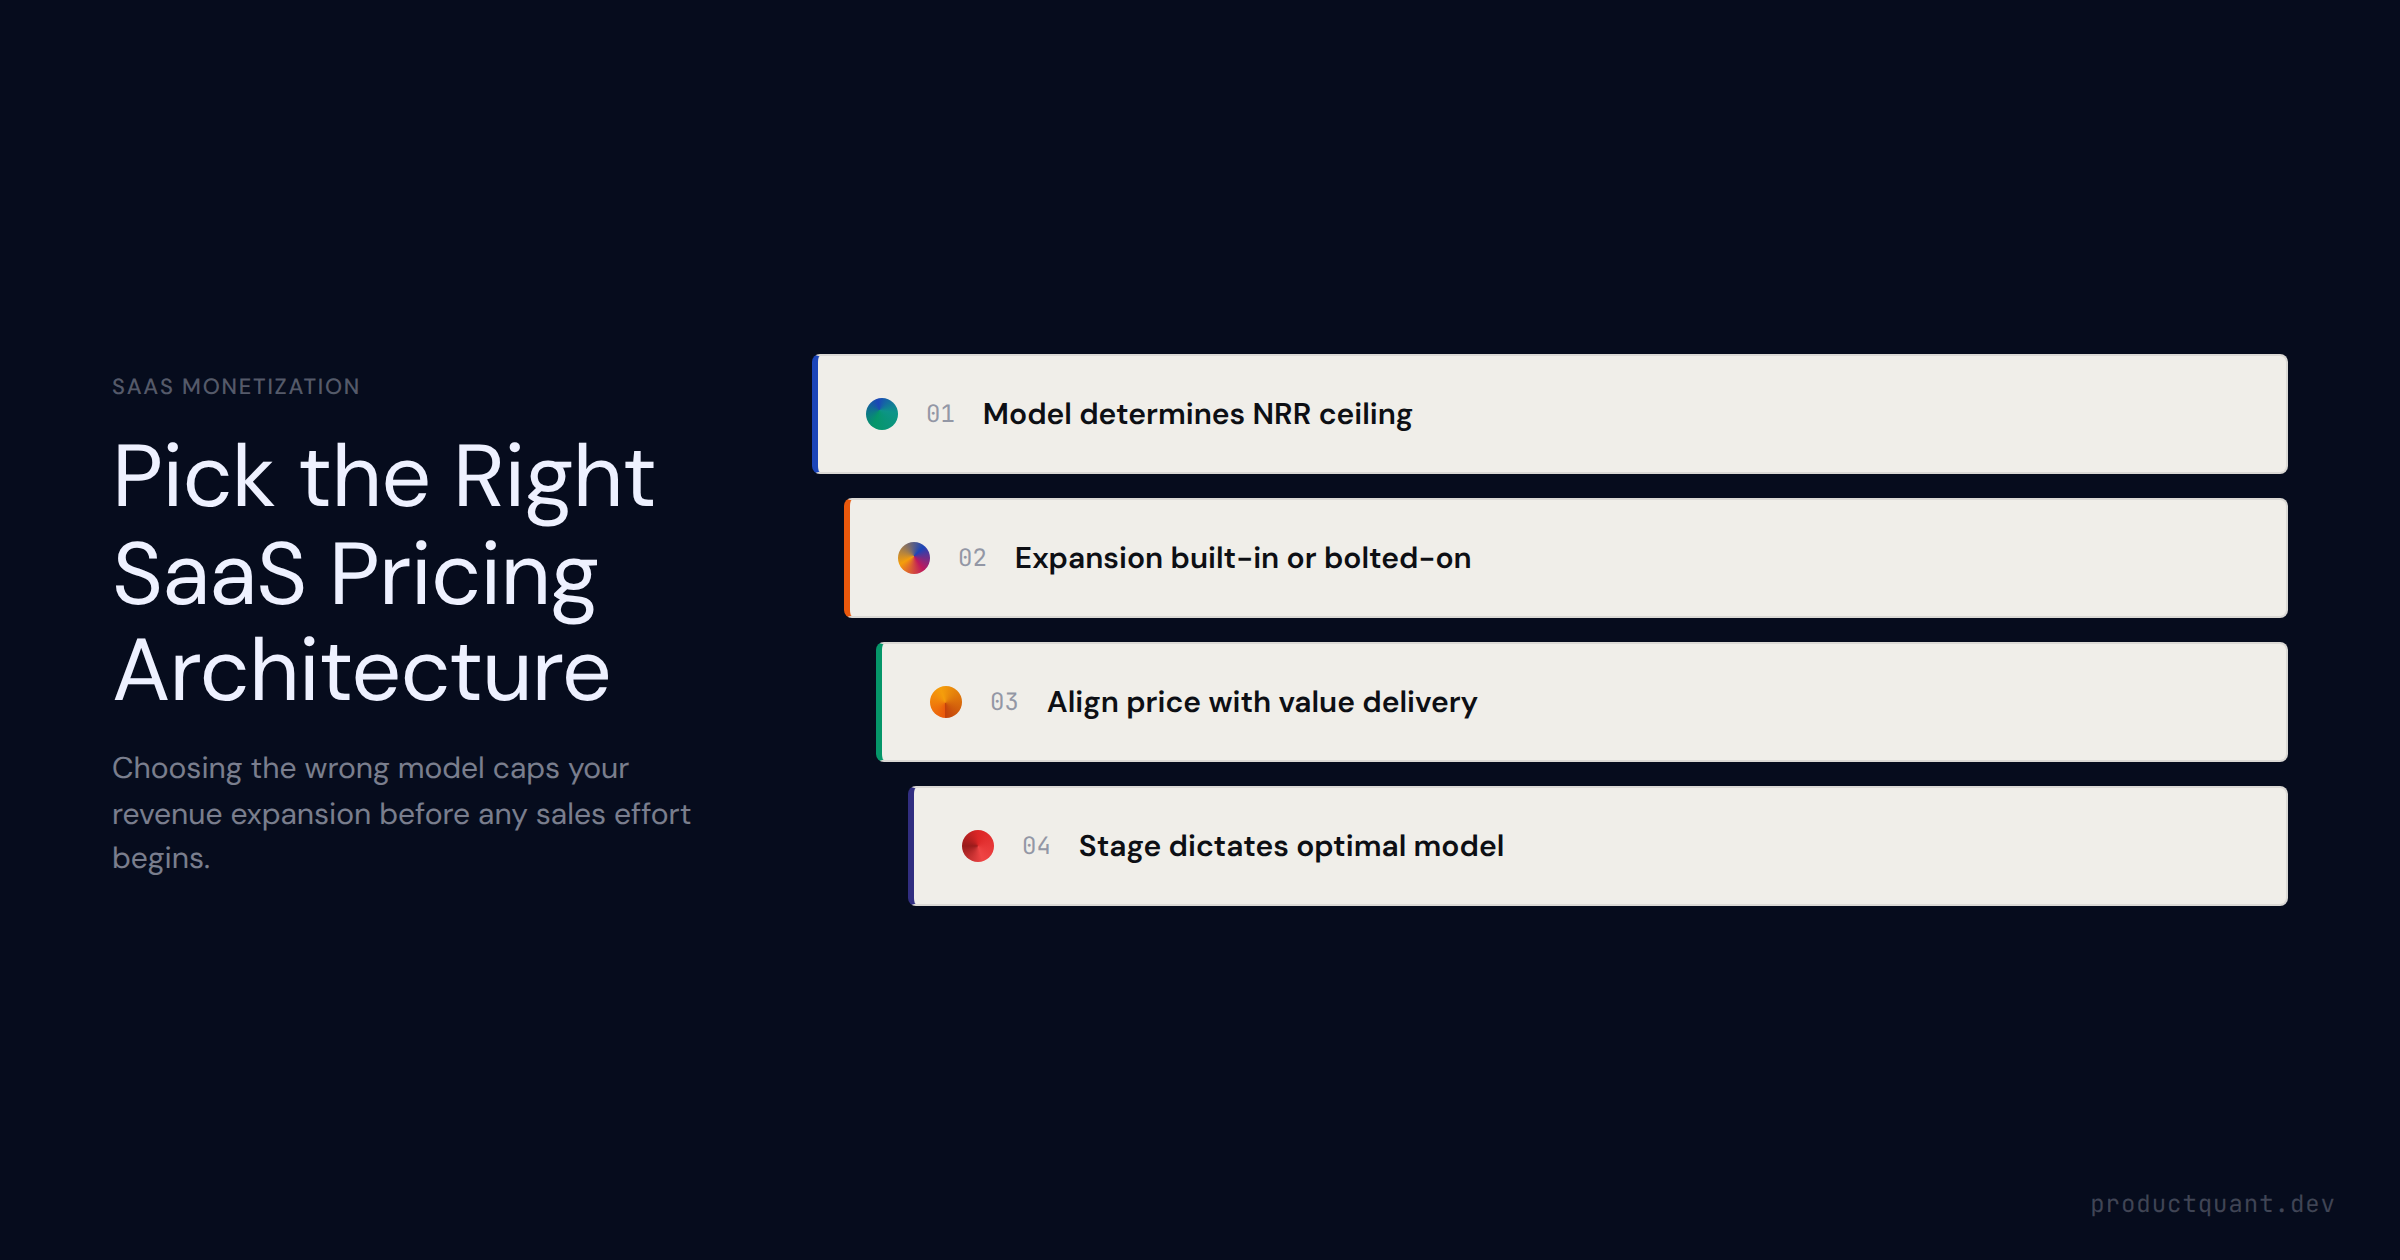
Side-by-side comparison of the five core SaaS pricing models — per-seat, usage-based, flat-rate, tiered, and freemium — with decision criteria, NRR implications, and when to evolve each model.
Pricing page visitors are your highest-intent traffic. Here is the complete framework for structure selection, the five conversion elements that drive trial starts, and a safe CRO testing methodology for pricing pages.
A practical guide to B2B SaaS pricing strategy — seat-based vs usage-based vs outcome-based, pricing page design, discounting discipline, and building an expansion pricing motion.
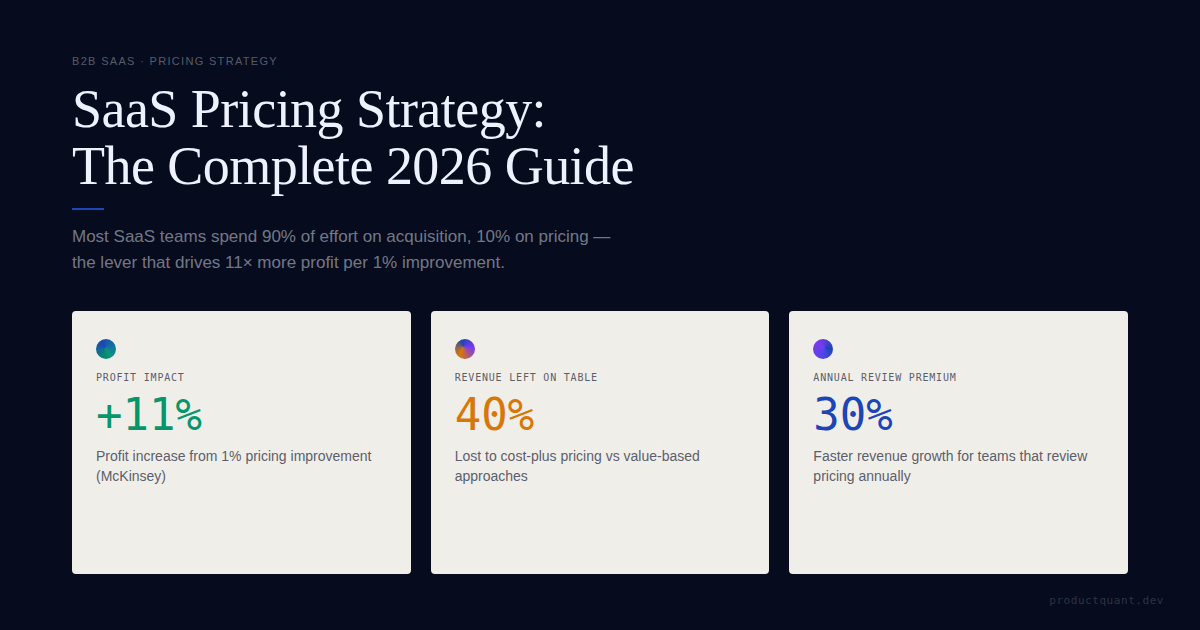
B2B SaaS pricing strategy guide: choose the right model, design tiers, and capture value. 1% pricing improvement drives 11% profit increase.

Product analytics in SaaS broken into 4 layers — acquisition, activation, retention, expansion. Which metrics are leading vs. lagging, how to instrument the right events, and how usage data becomes connective tissue betw
Event tracking, session recording, cohort analysis, build vs. buy — the data layer decisions B2B SaaS teams get wrong, and how to select an analytics stack that connects to activation and retention outcomes.
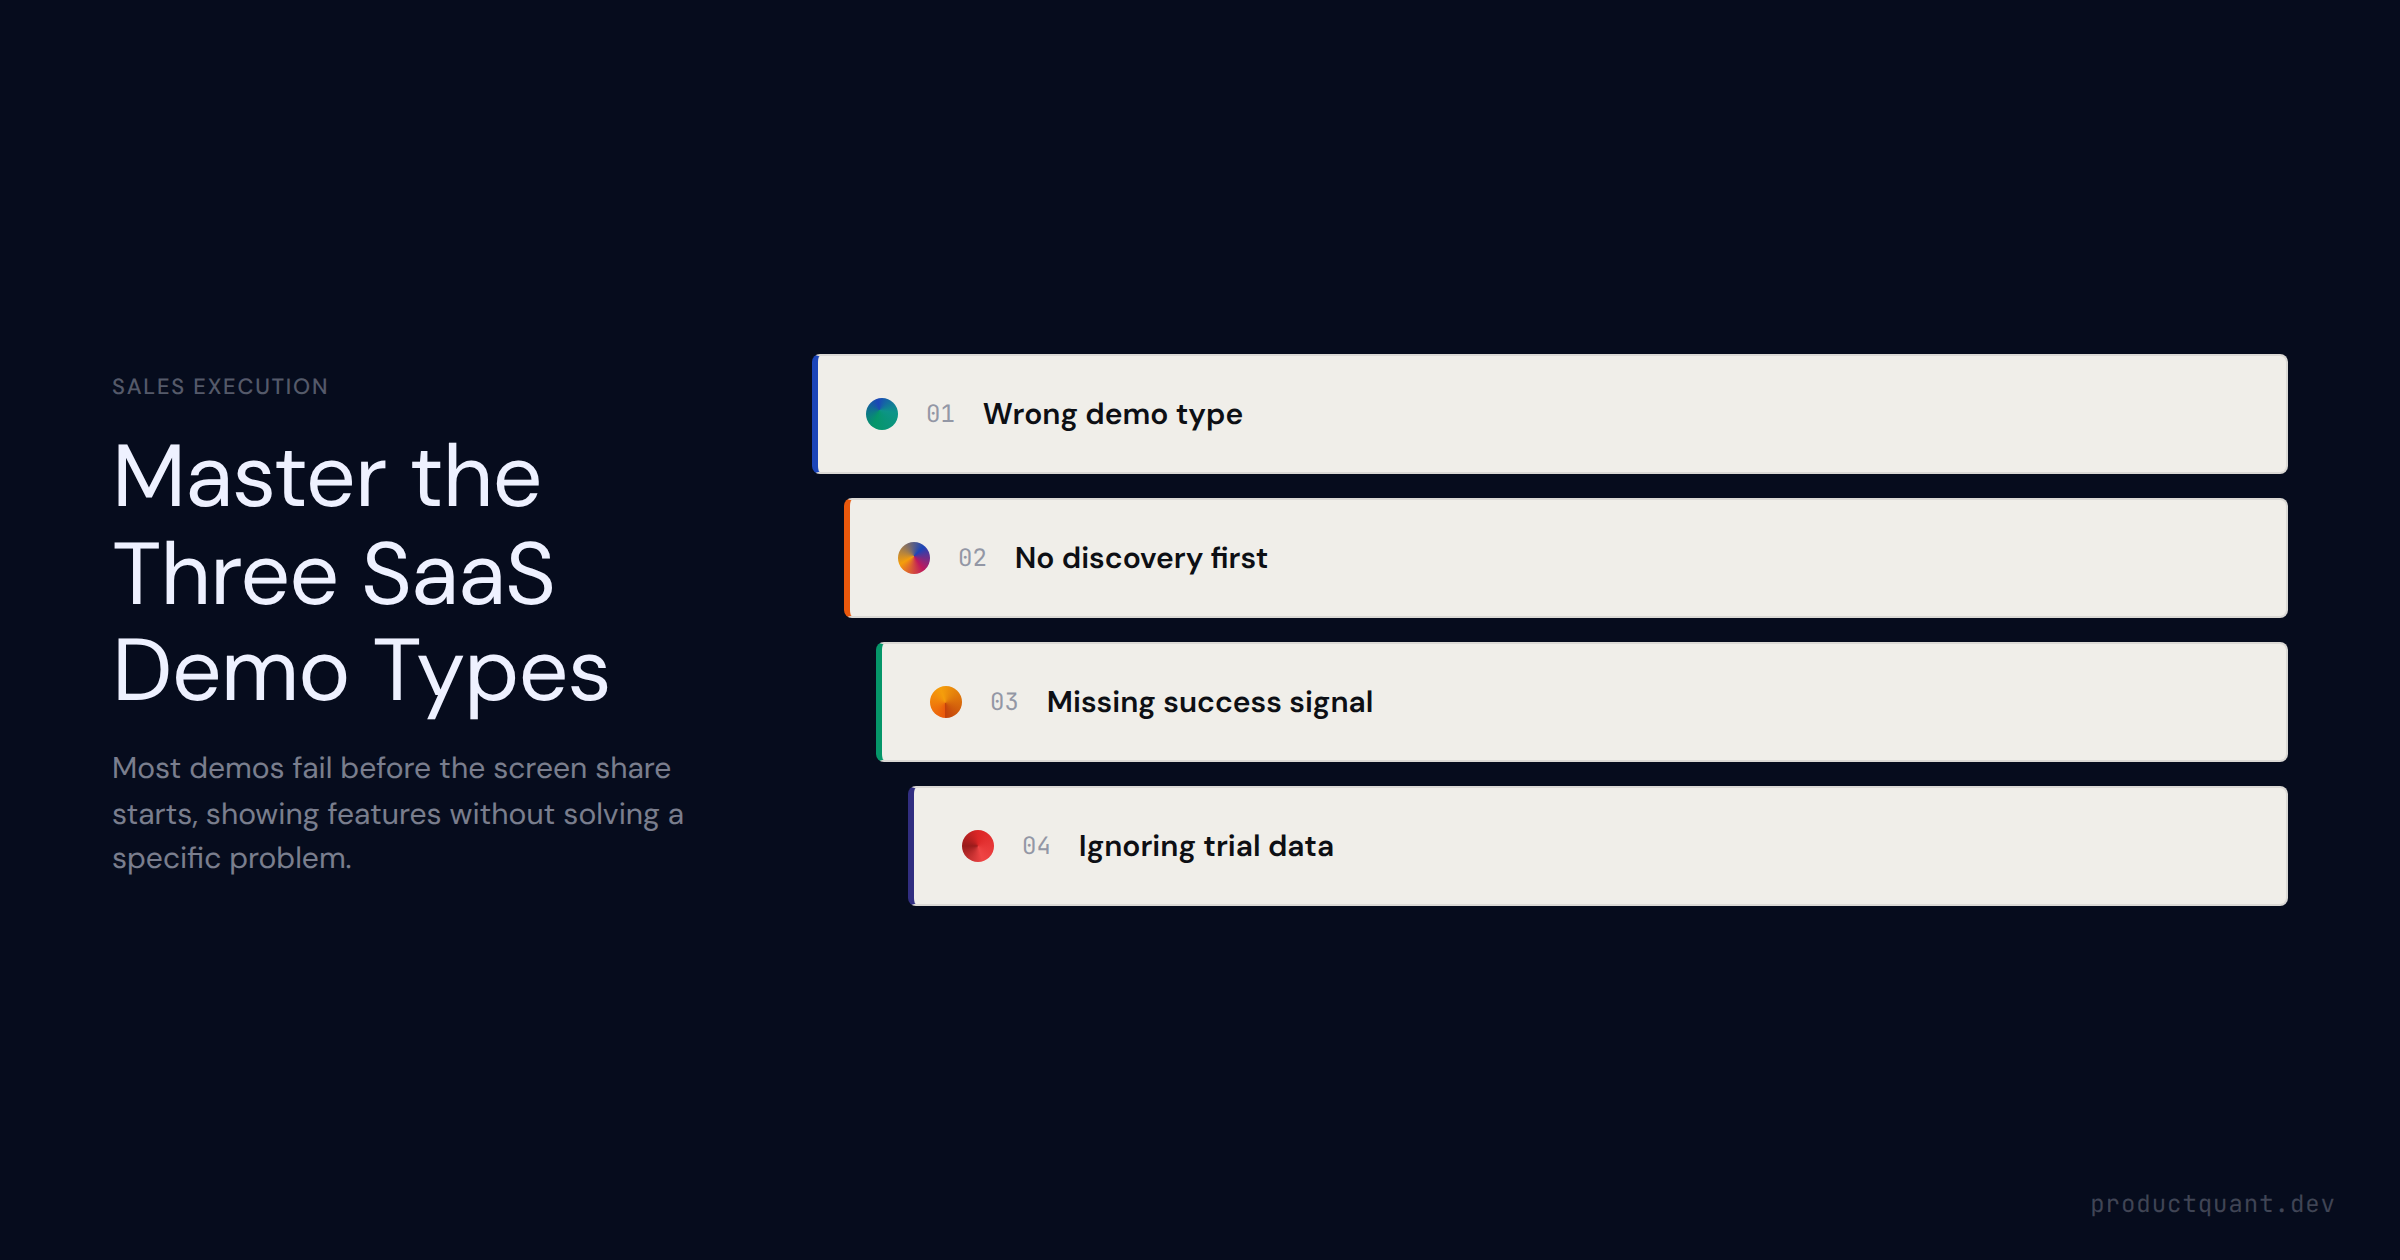
The three SaaS demo types — discovery, technical, and champion — why demos fail when they happen before discovery, the SPIN demo structure, the top 5 demo mistakes, and how to use trial usage data to personalize every de
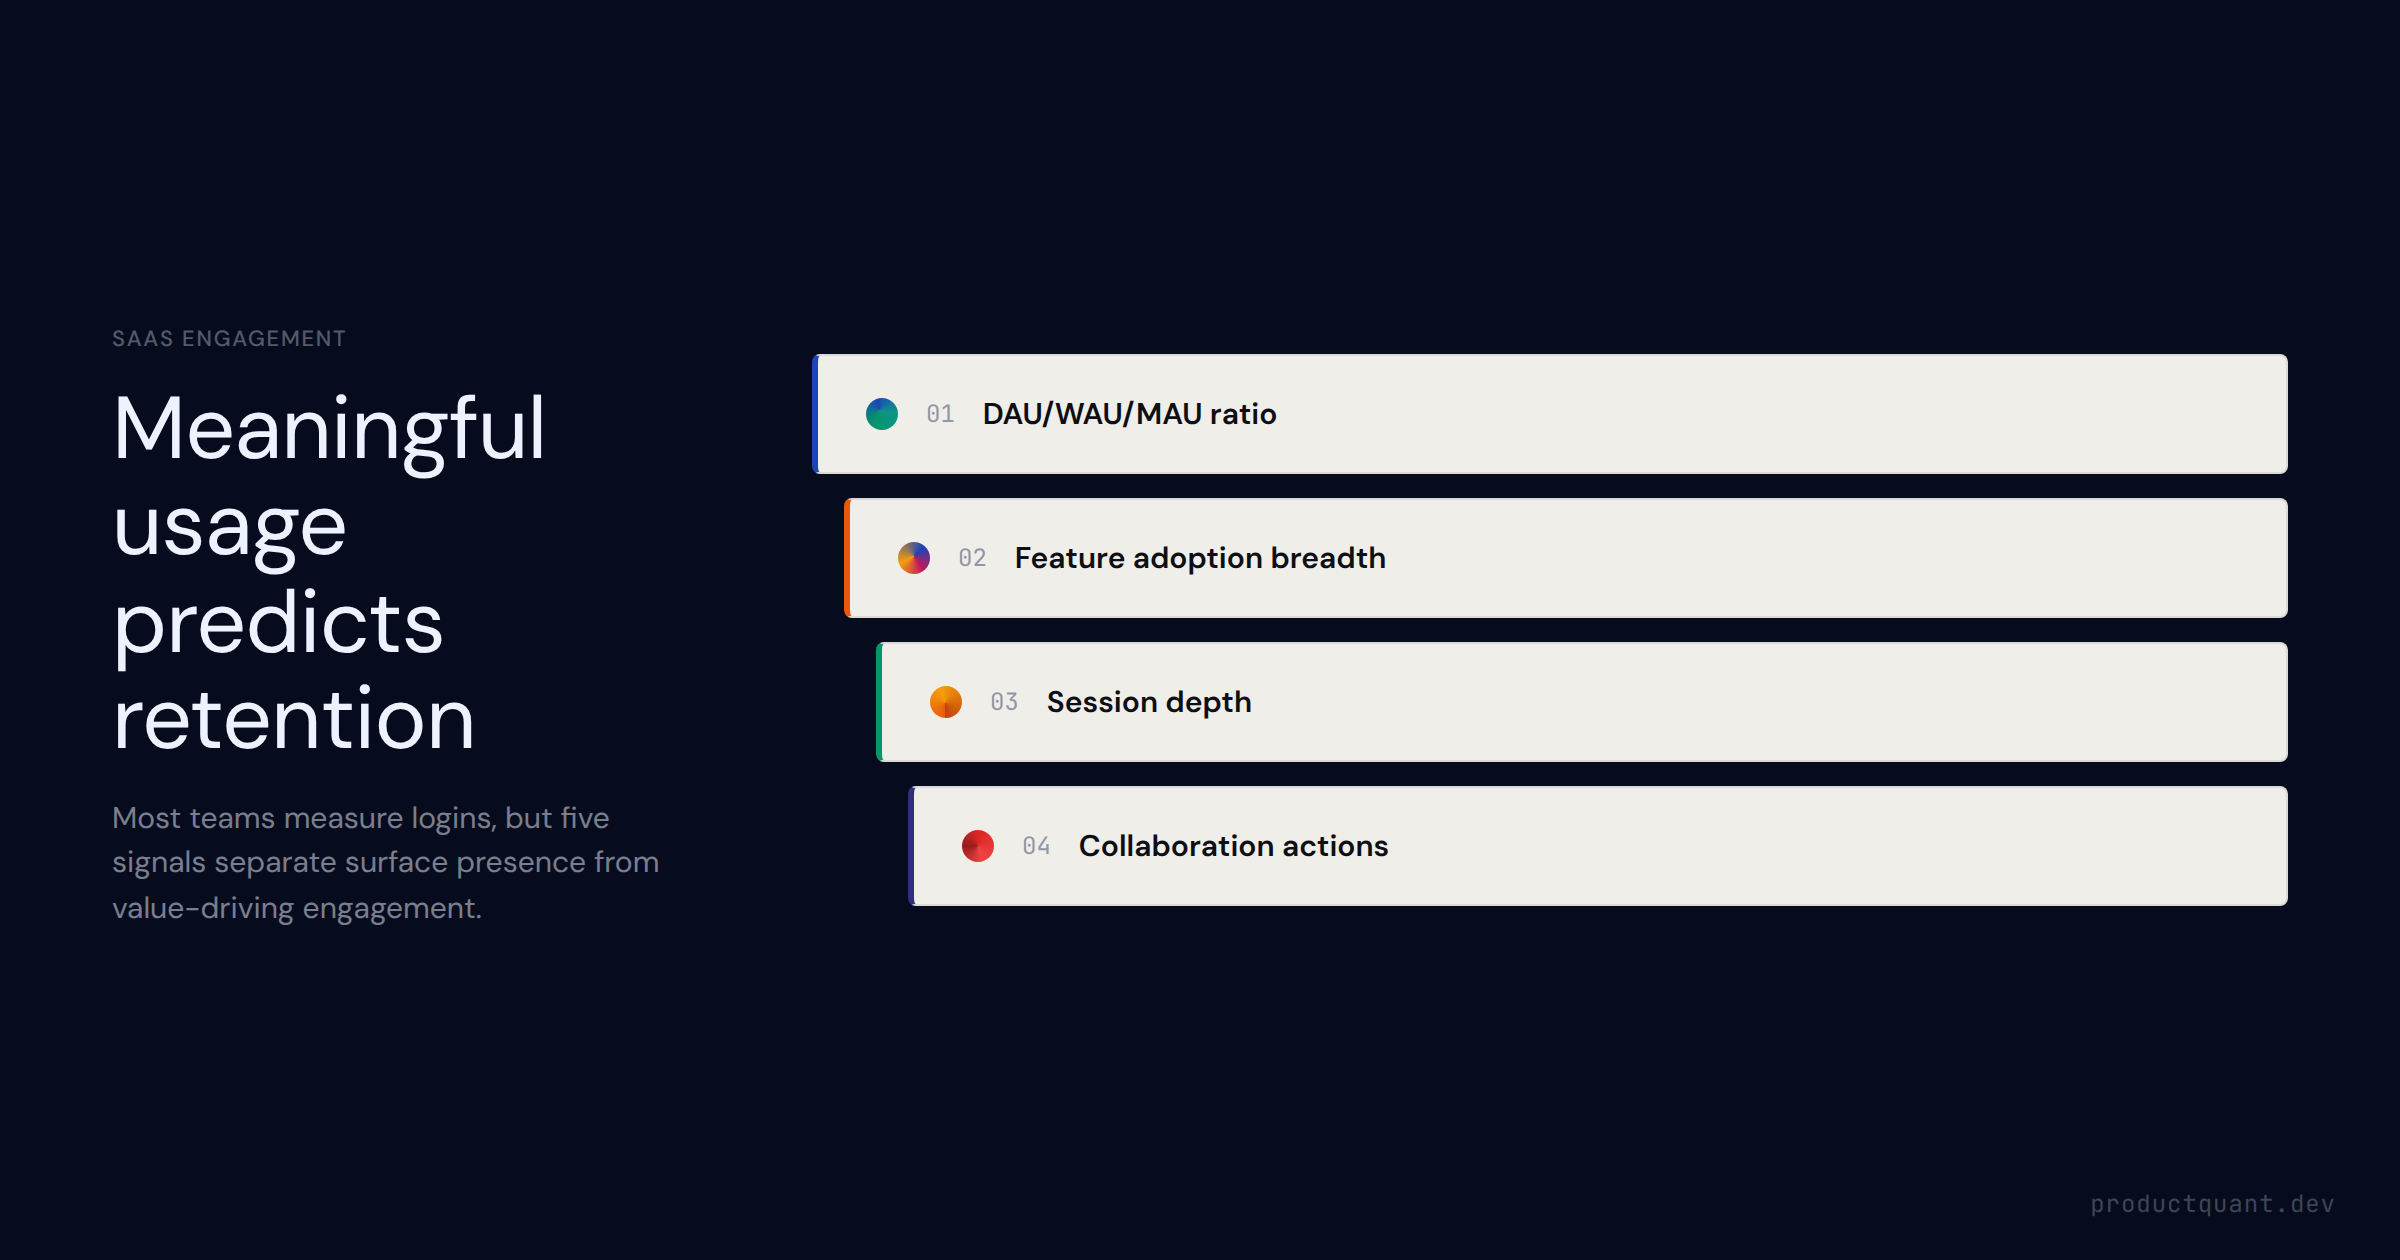
DAU alone is a vanity metric. The 5 engagement signals that separate active usage from meaningful usage — DAU/WAU/MAU ratio, feature adoption breadth, session depth, collaboration actions, and integration usage — and how
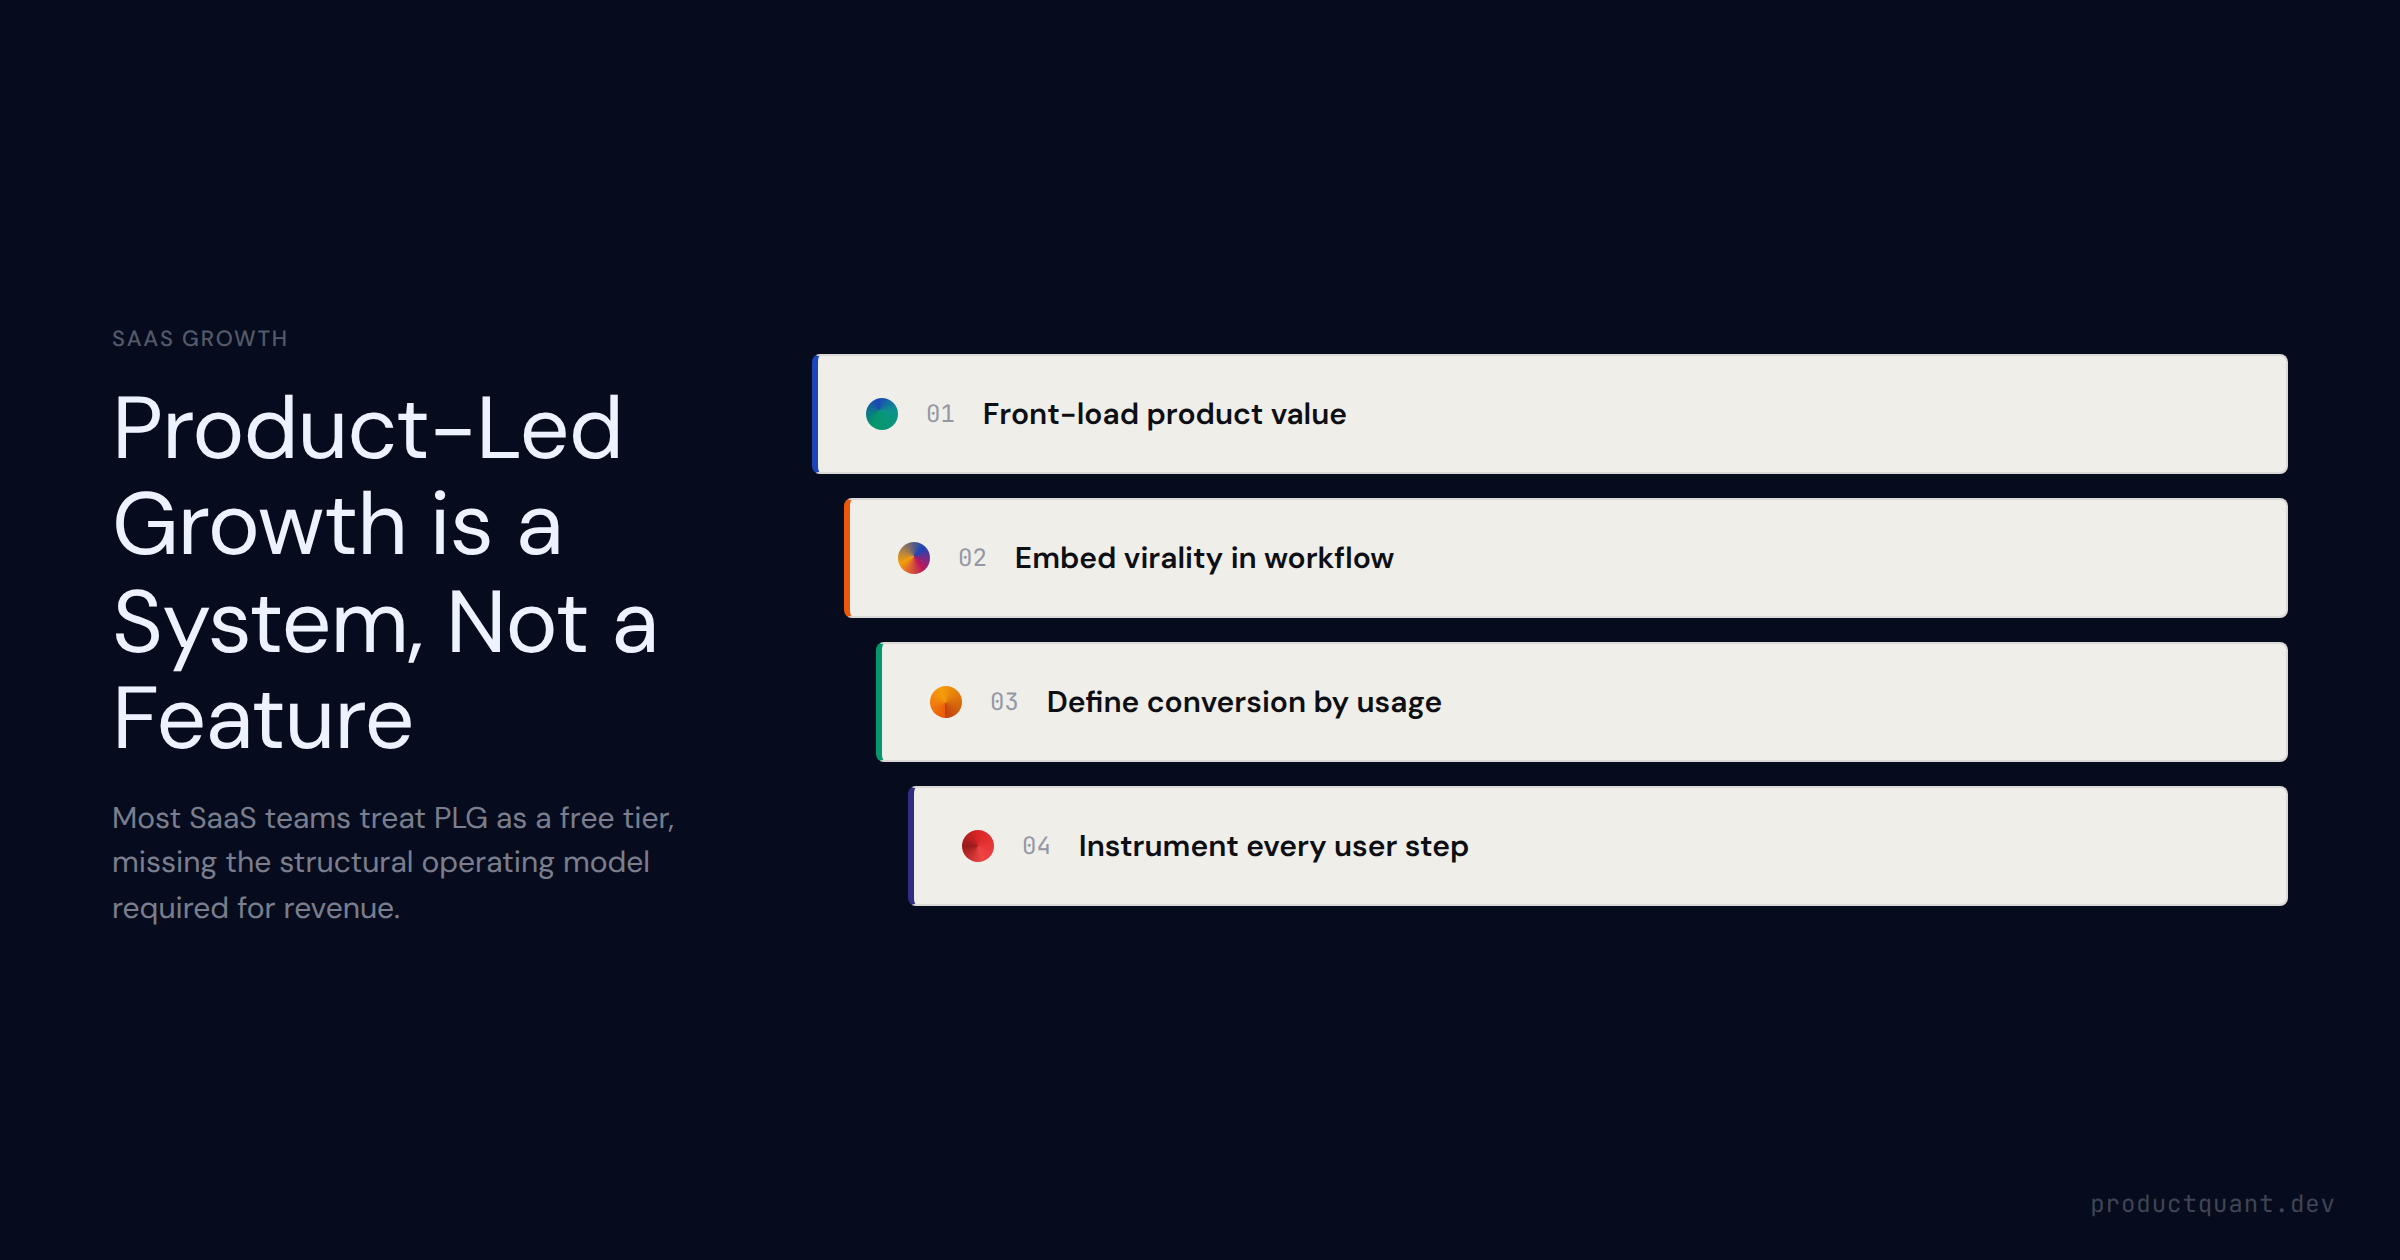
What product-led growth actually looks like in practice — the structural patterns behind PLG companies, the organizational changes PLG requires, and how SaaS teams transition from sales-led to product-led motions.
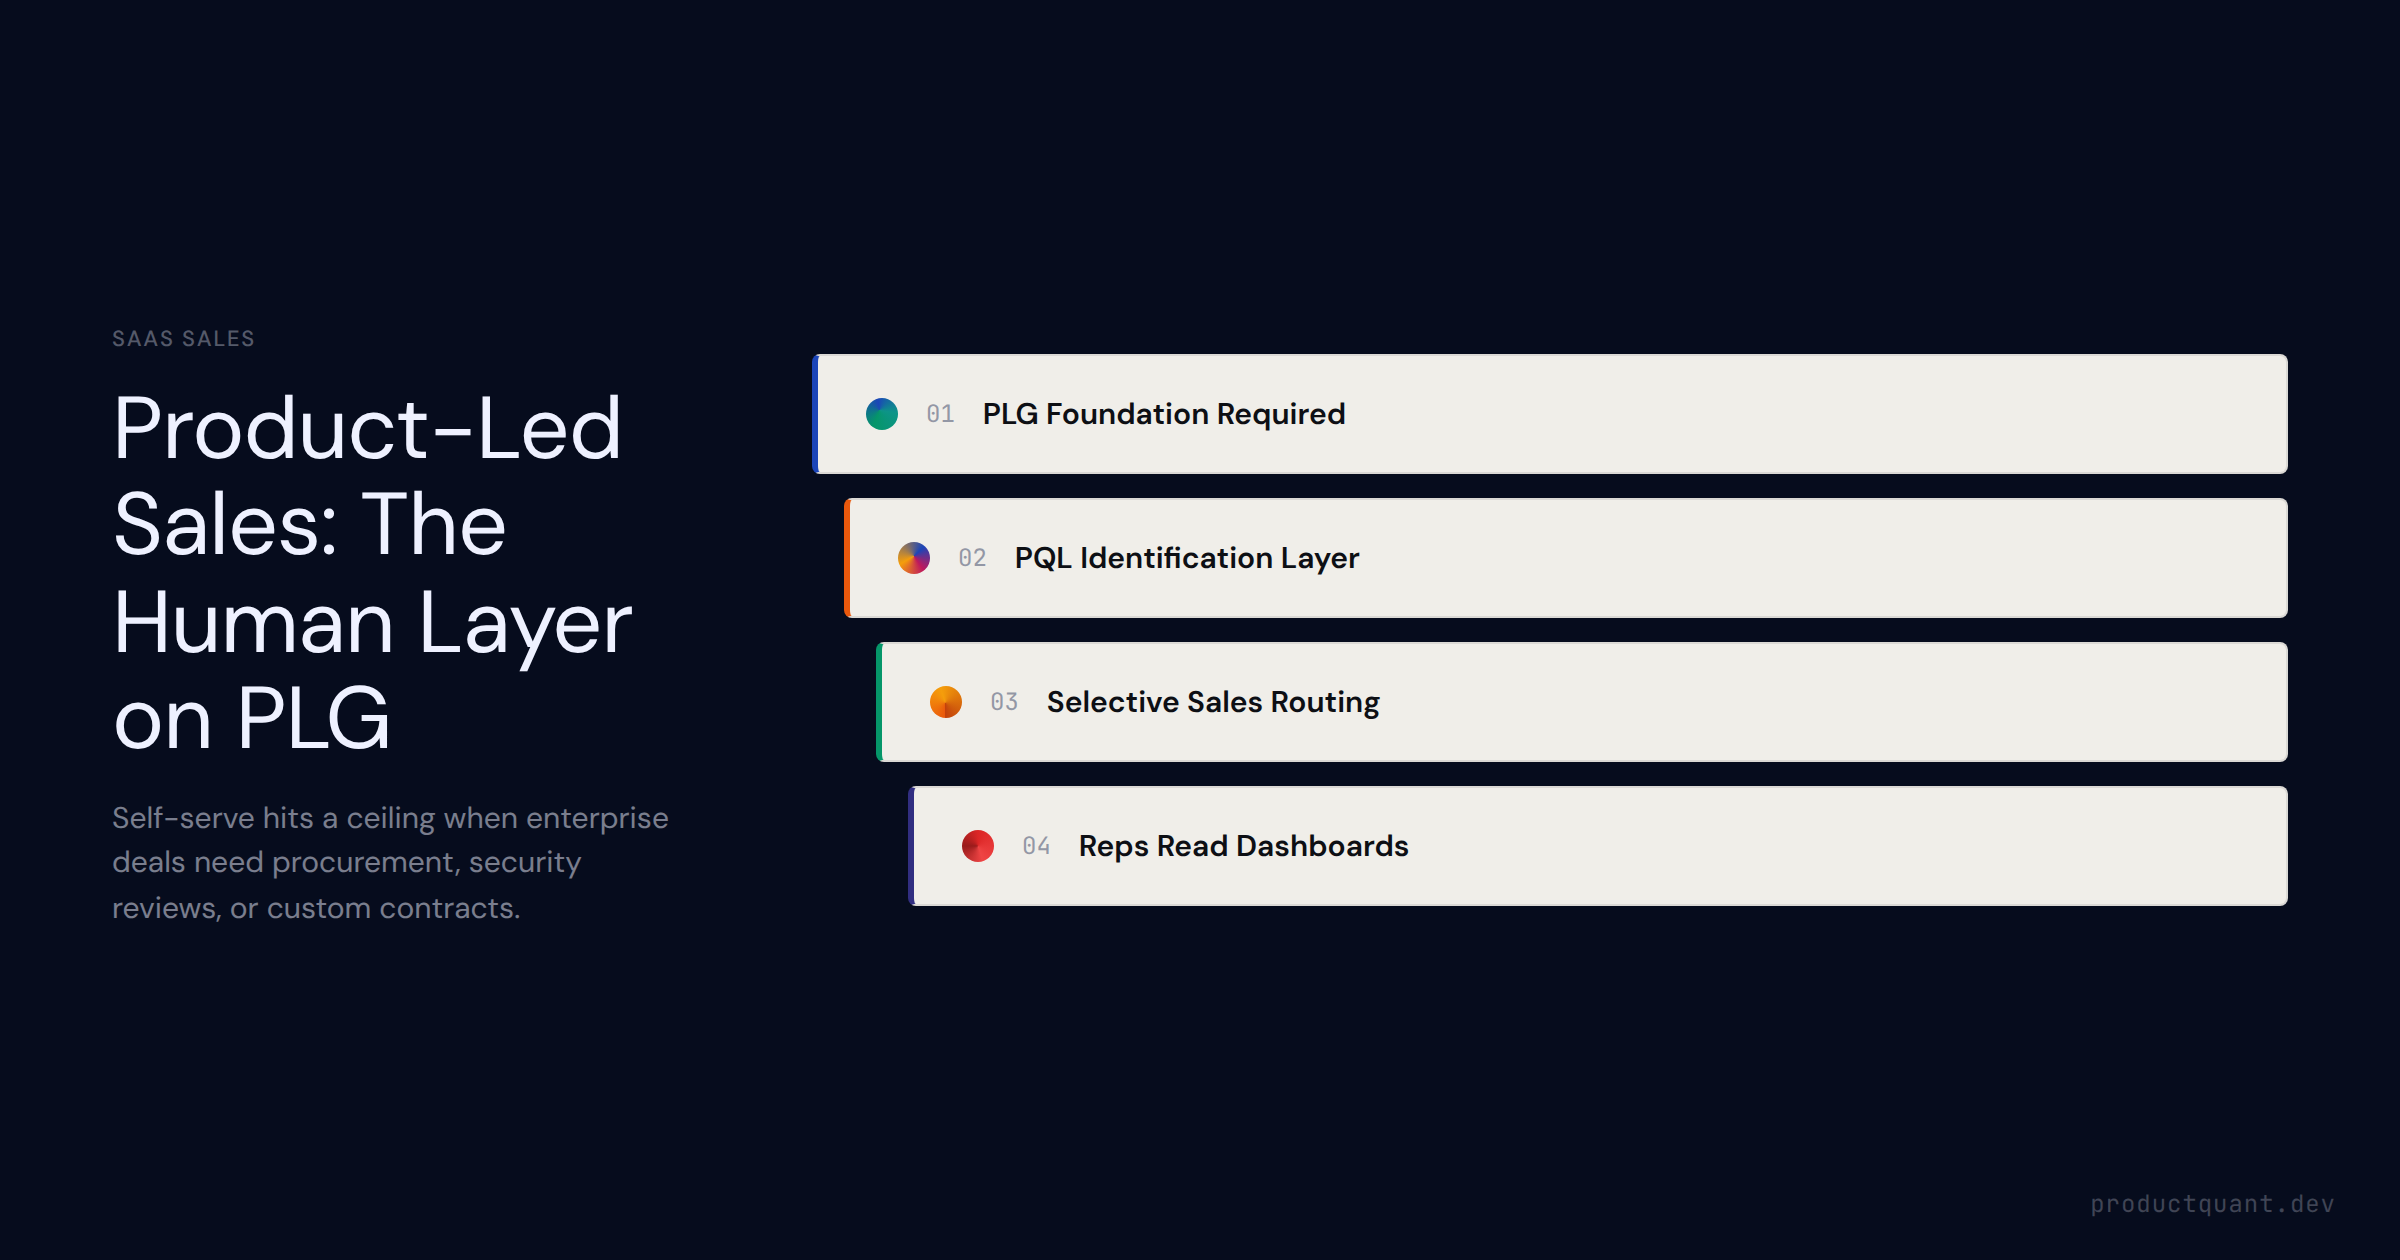
Product-led sales (PLS) overlays a sales motion on top of PLG. Learn how to identify PQLs, decide when to route vs. let self-serve close, and structure your sales team around product signals.
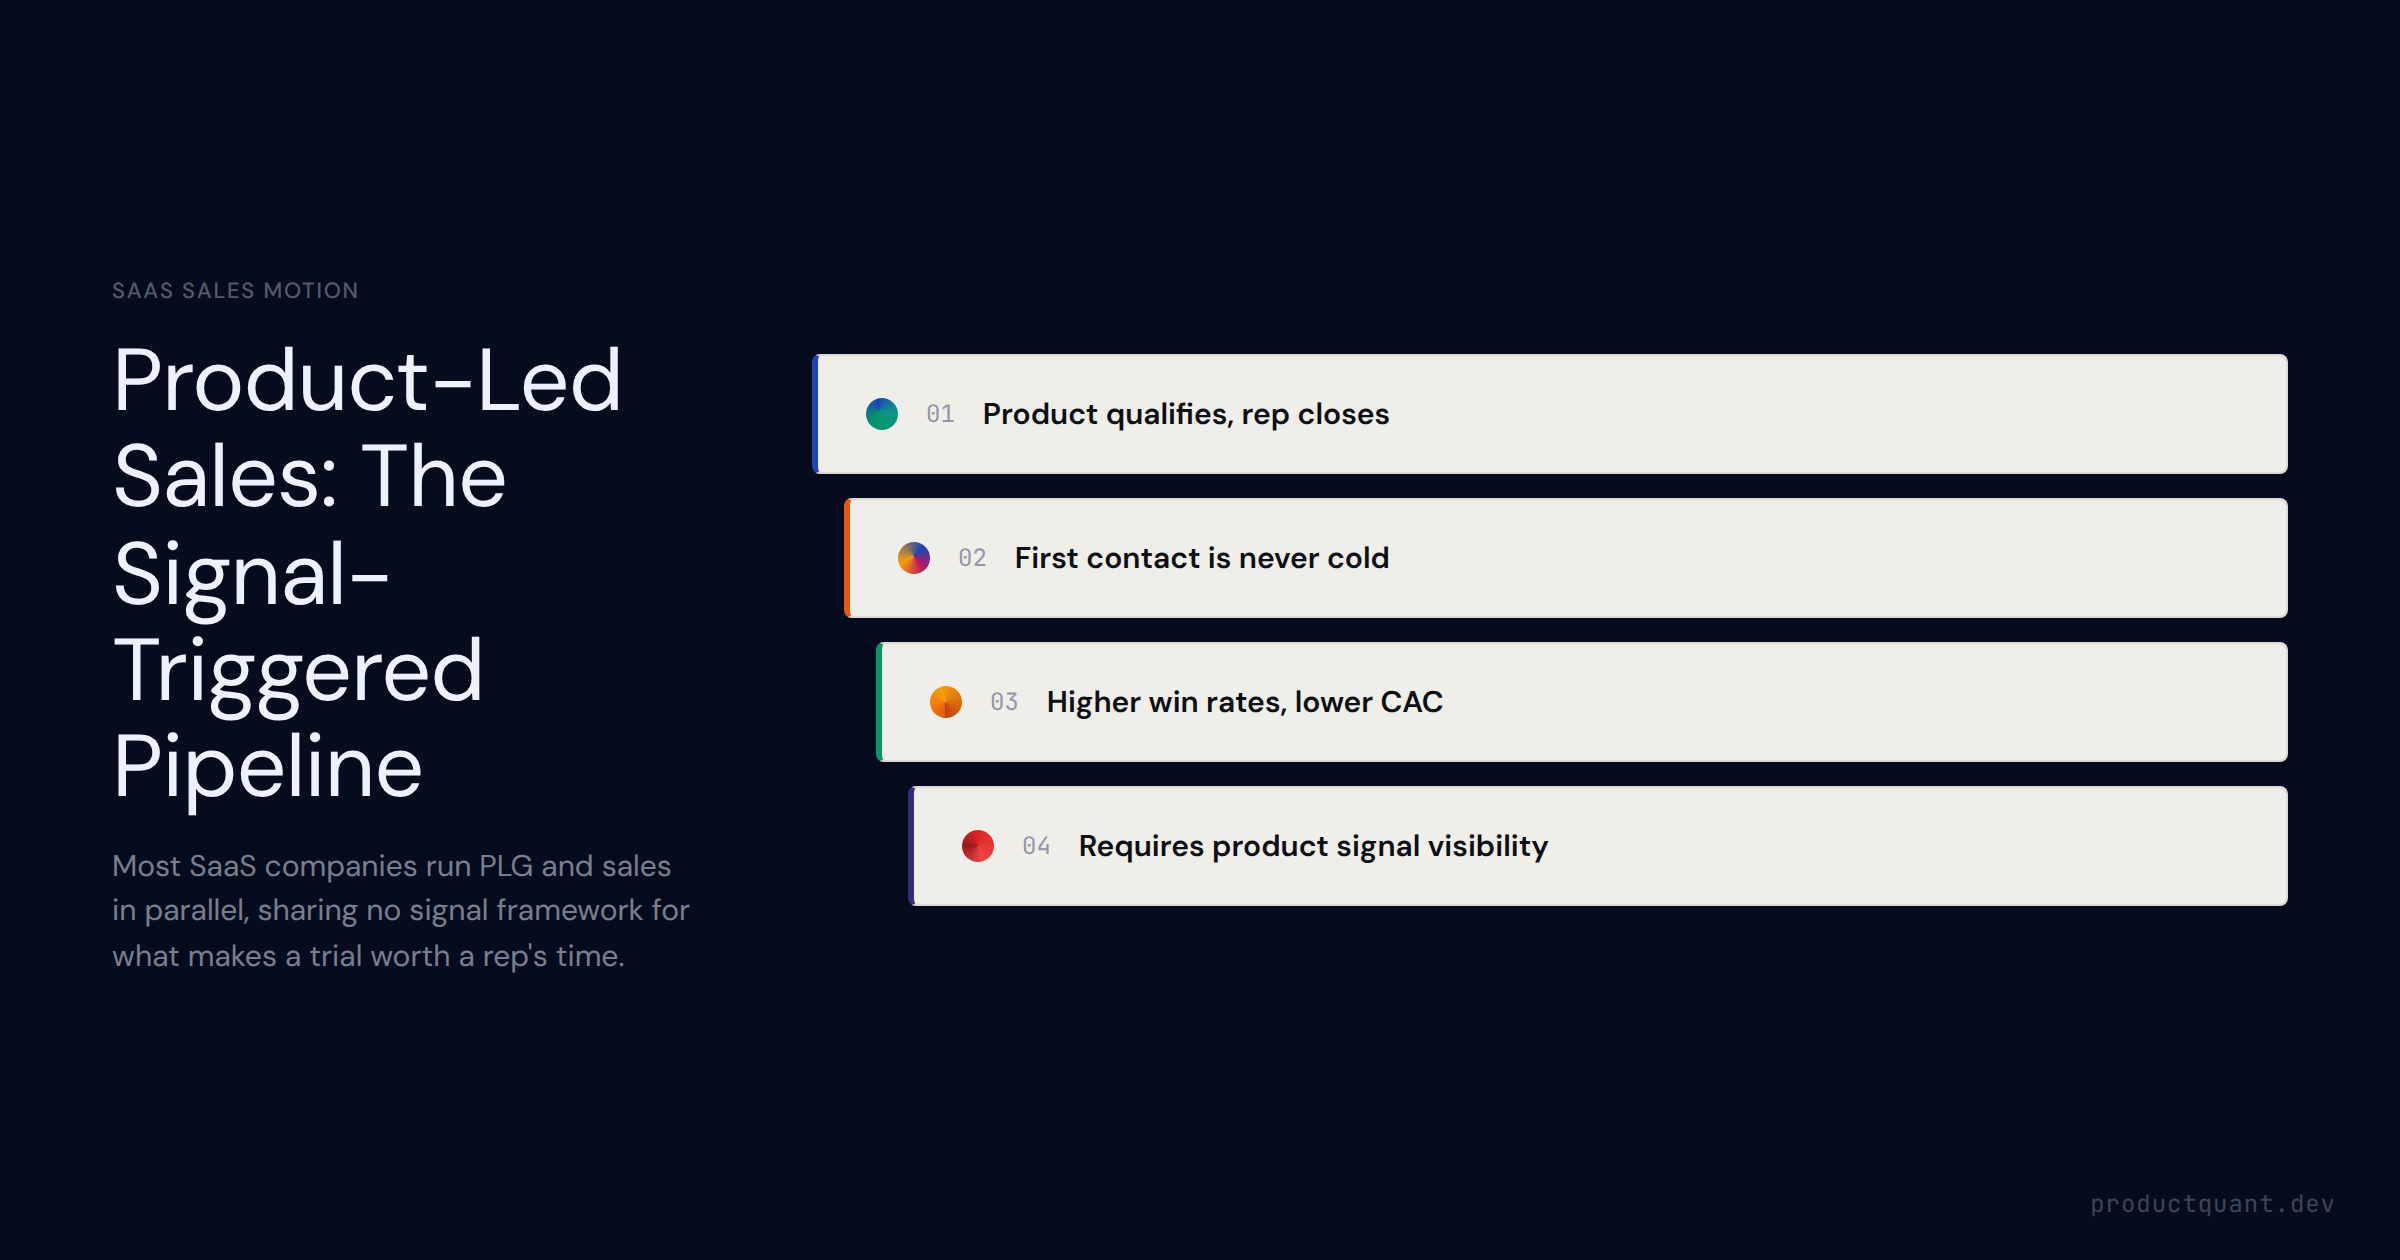
Product-led sales (PLS) is not PLG with a sales team bolted on. It is a distinct motion where the product generates qualified pipeline that reps close — without cold outreach or calendar-based sequences.

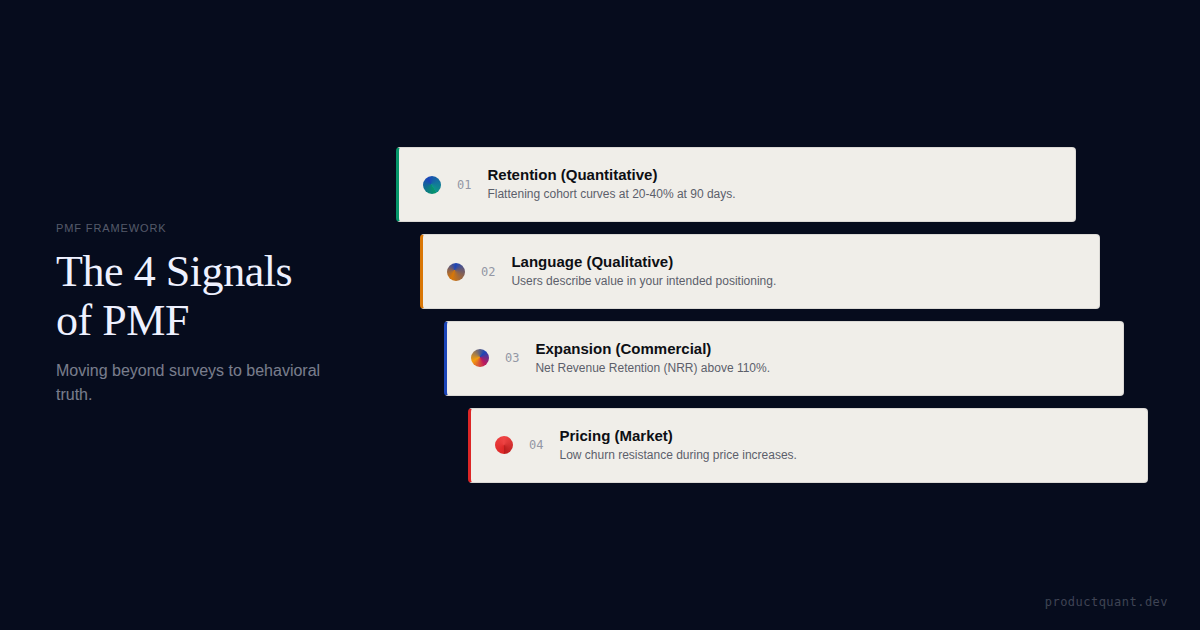
What product-market fit actually means in SaaS, the four quantitative signals that confirm it (the 40% rule, retention curve flattening, CAC payback, NPS), what weak PMF looks like in the data, and why revenue is not PMF
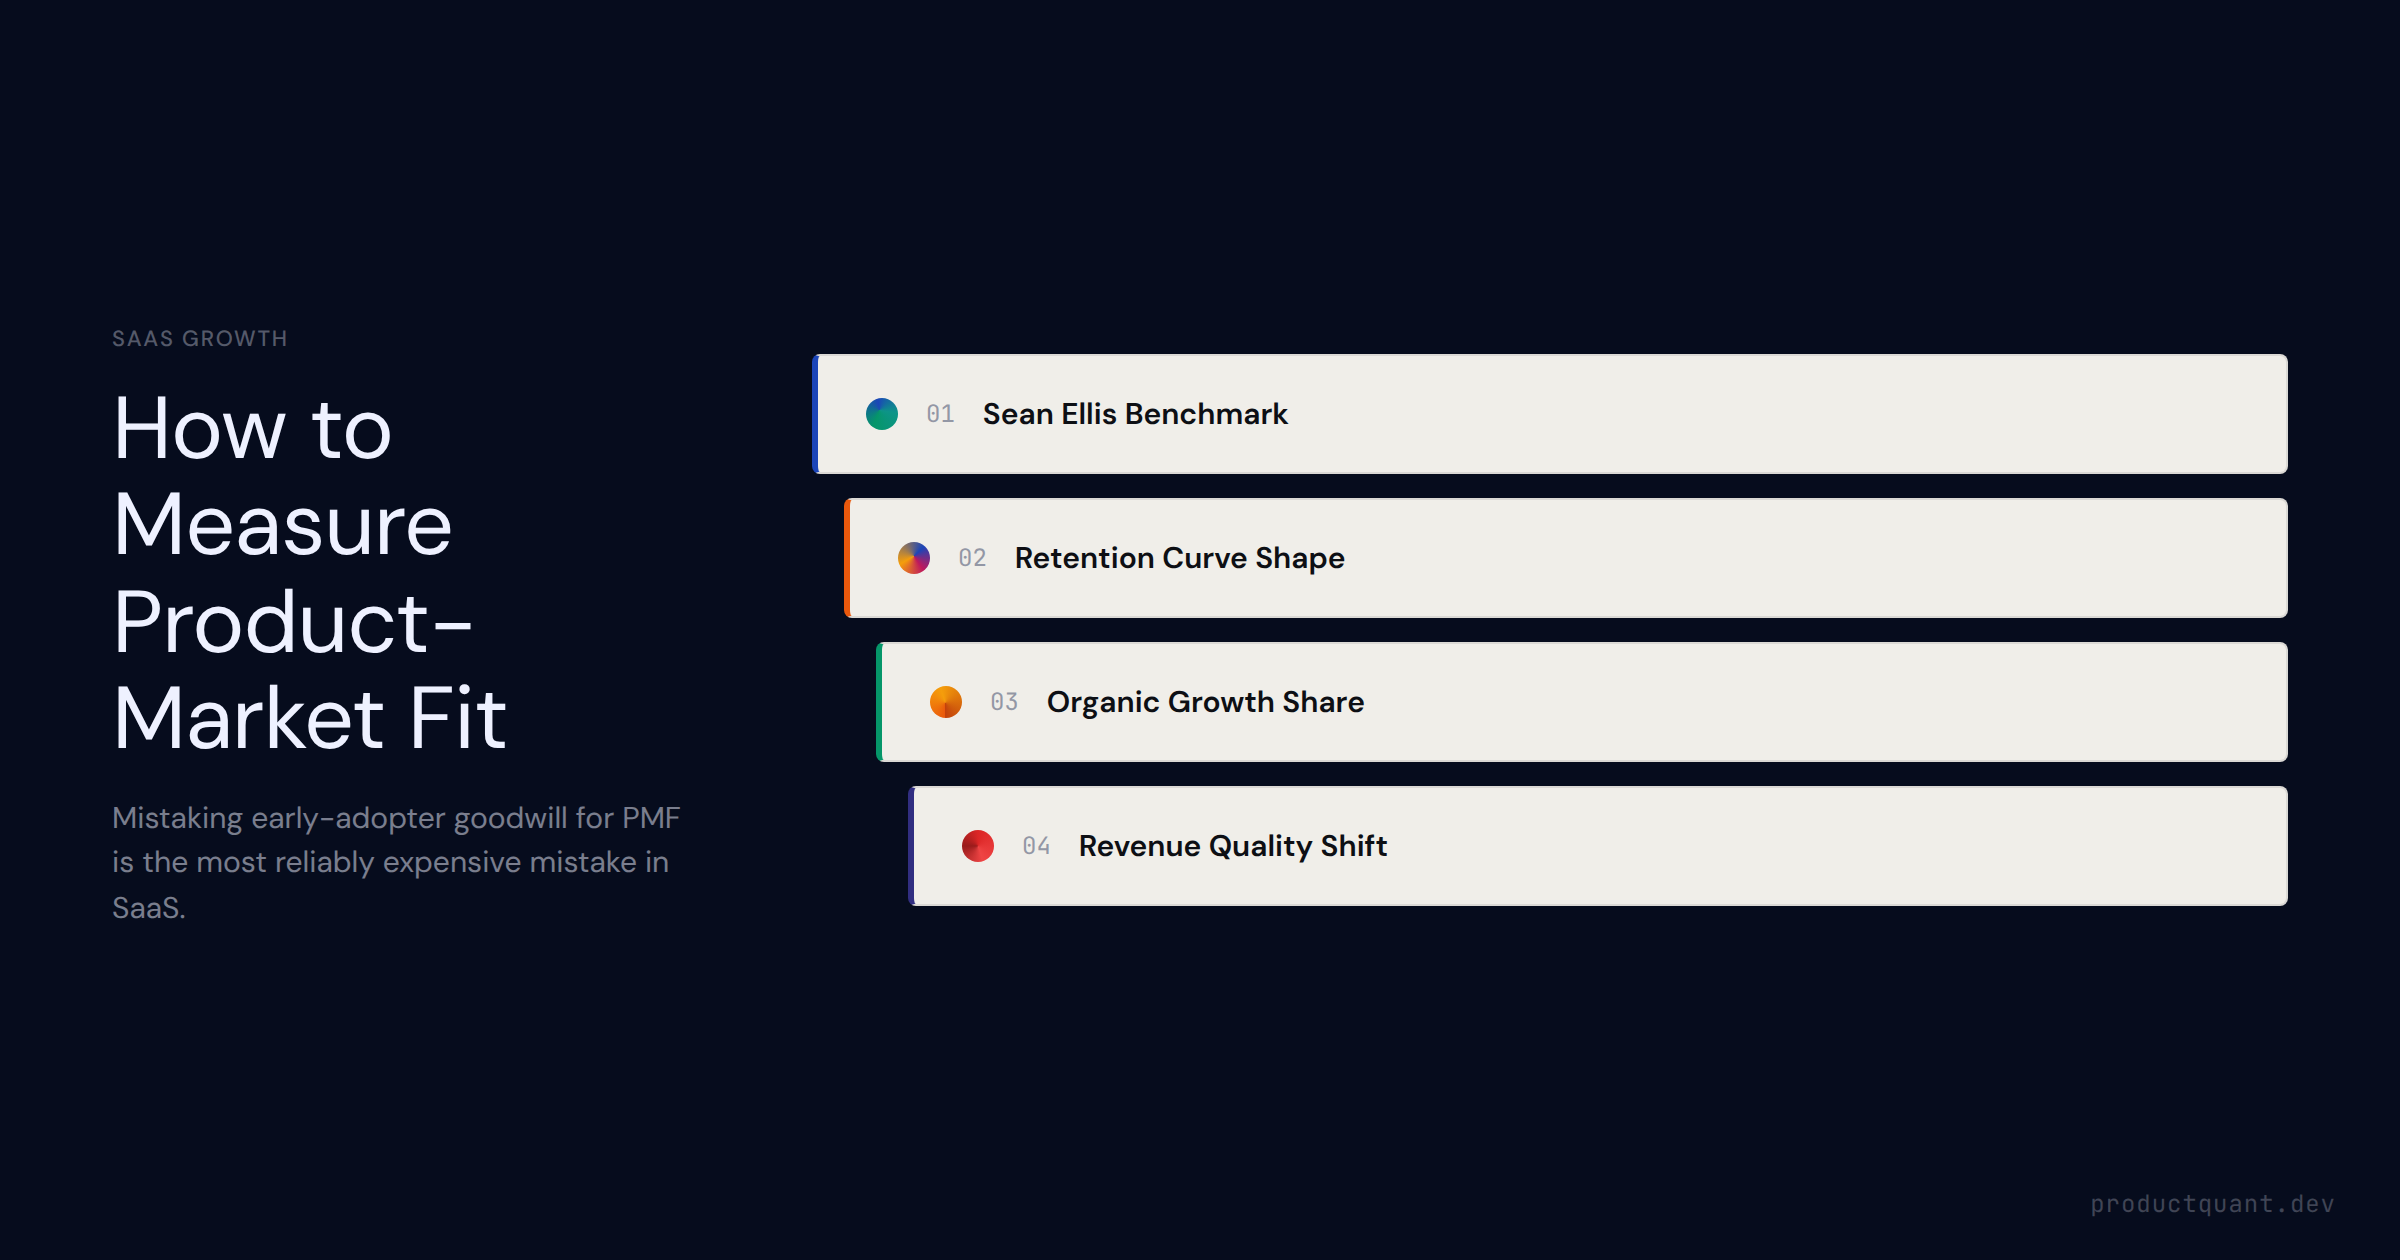
The Sean Ellis test, retention curve shape, NPS thresholds, and behavioral signals that separate genuine PMF from polite early adopters. A practical framework for SaaS founders and growth teams.
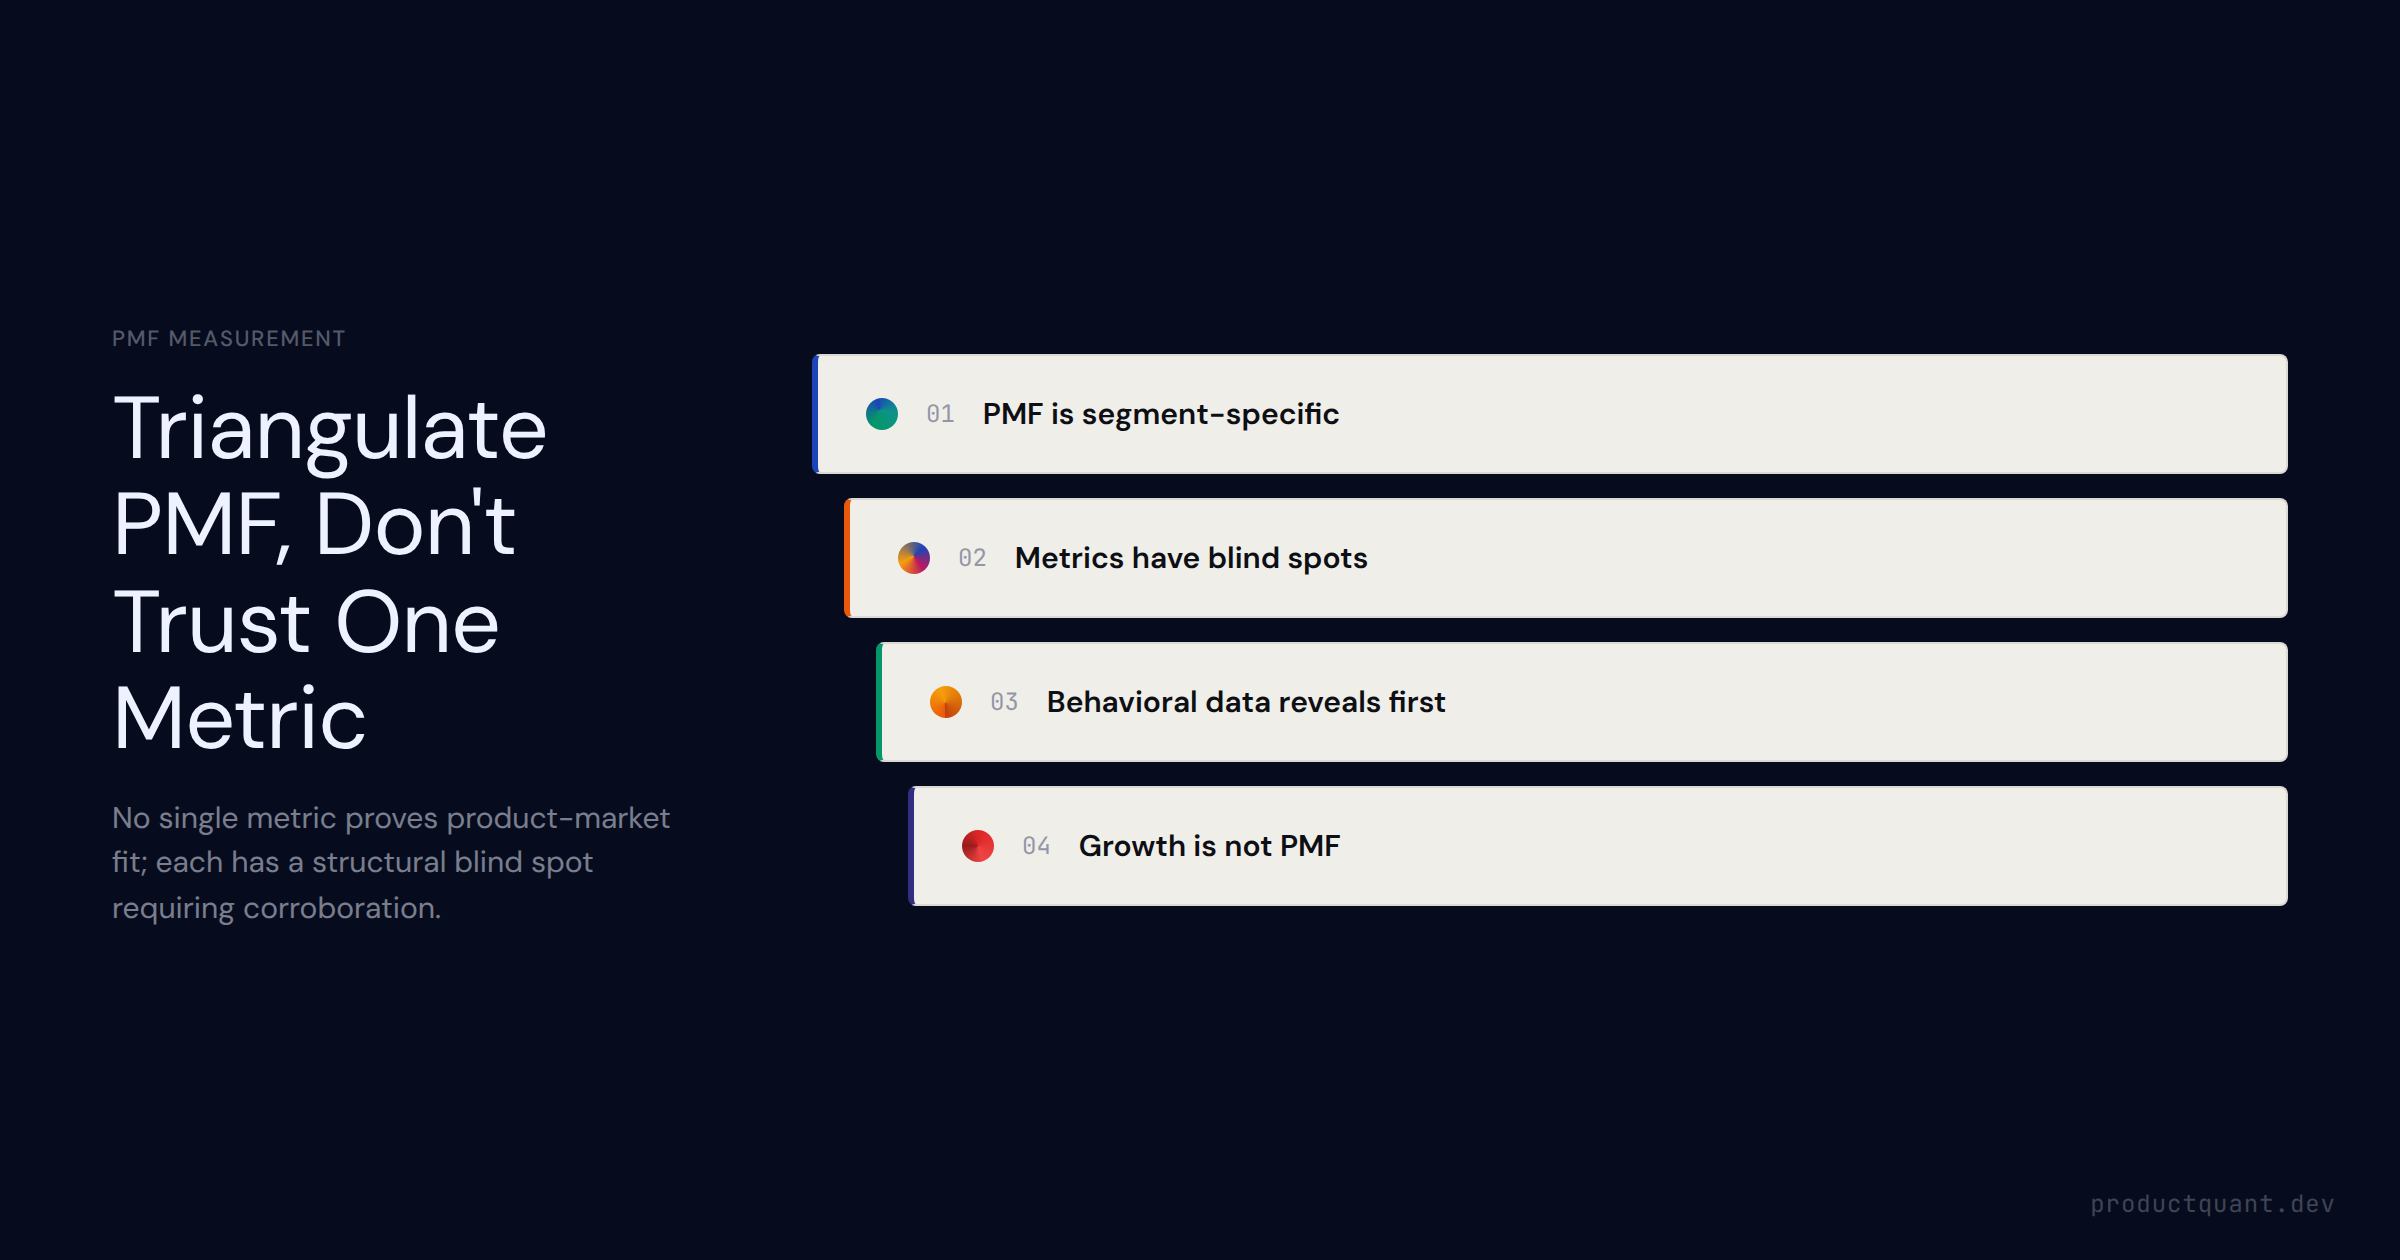
The 5 PMF measurement methods in B2B SaaS — Sean Ellis 40% test, NPS, retention curves, expansion NRR, DAU:MAU — each one
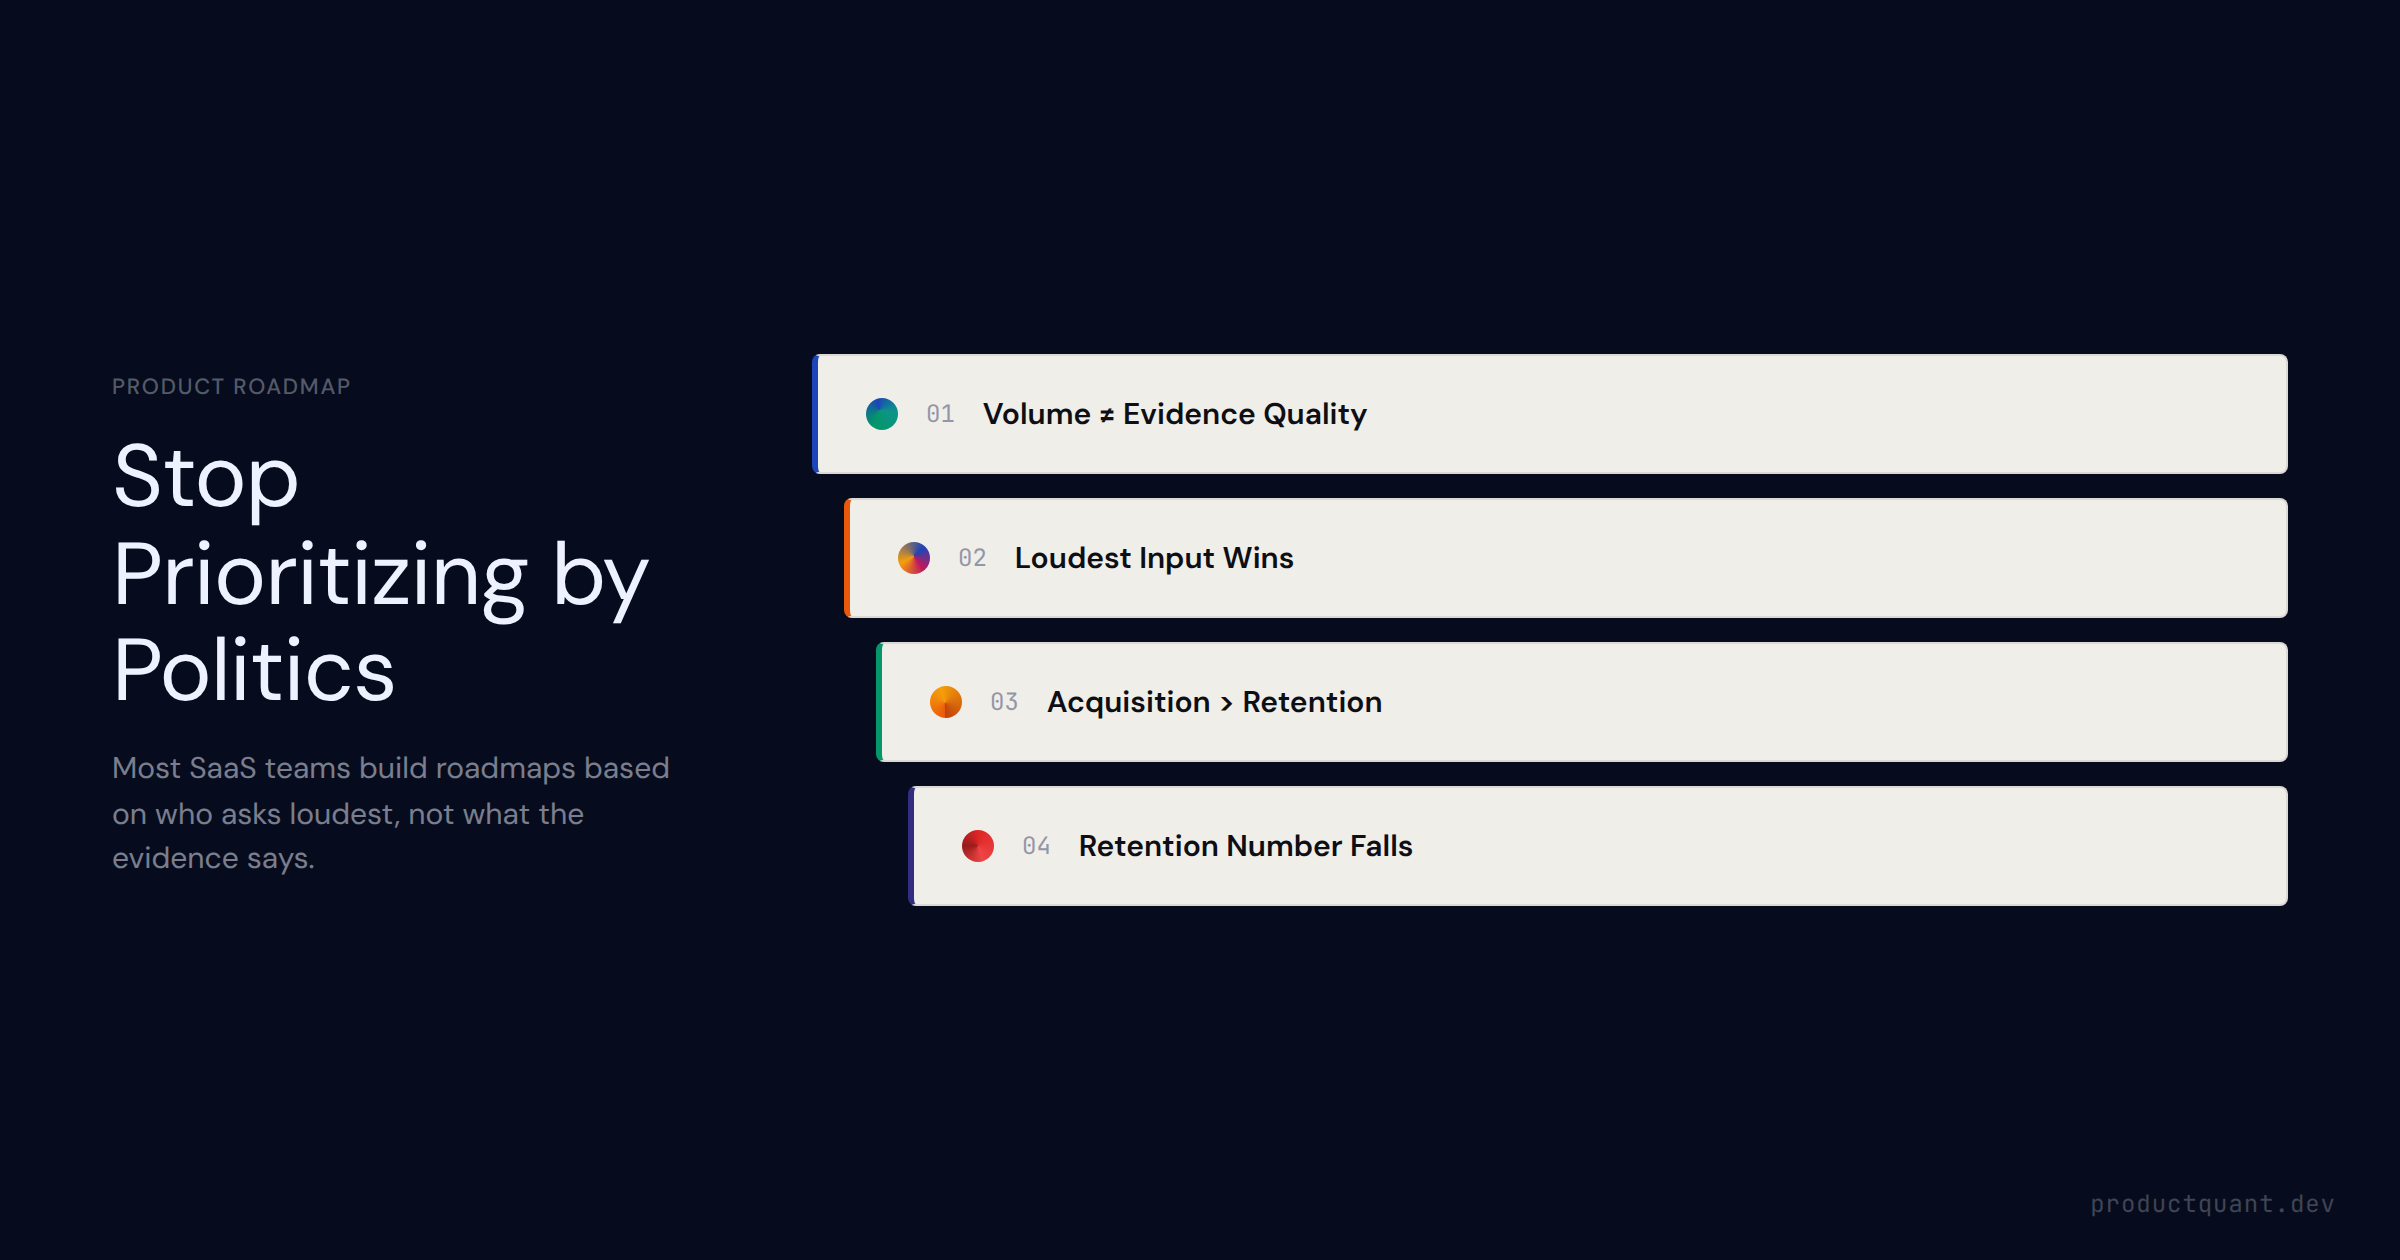
The tactical guide to SaaS product roadmap prioritization — WSJF and RICE scoring mechanics, the customer evidence hierarchy, how to handle competing stakeholder requests, and what a prioritization meeting should actuall
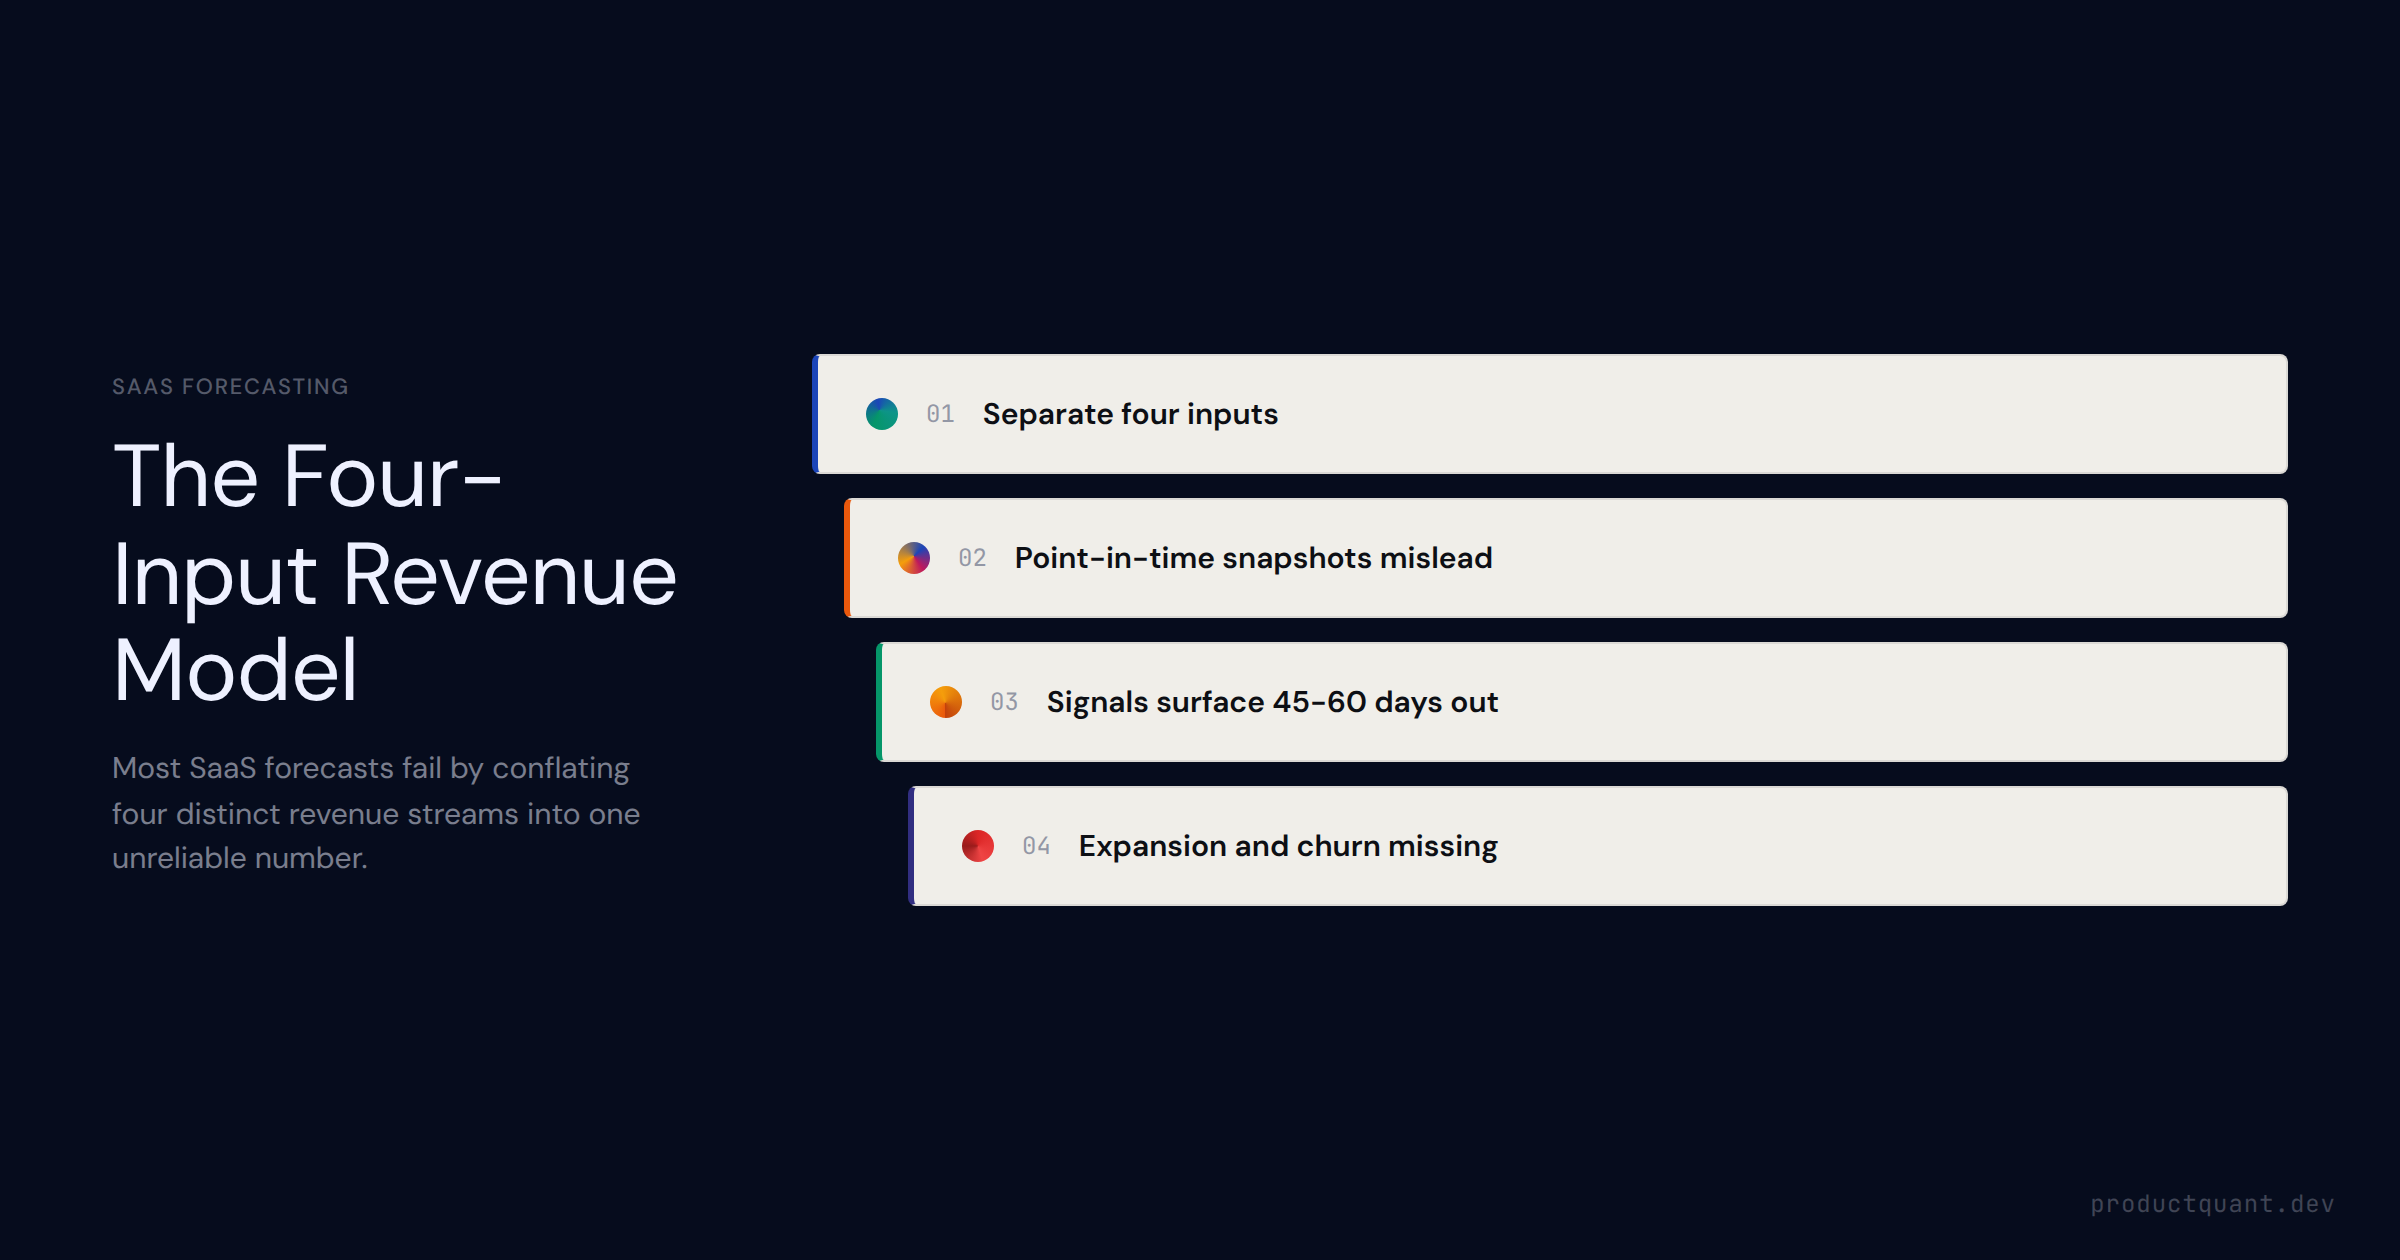
SaaS revenue forecasting done right uses bottom-up pipeline data, cohort conversion rates, and product usage signals — not rep-submitted estimates. Here is the framework.
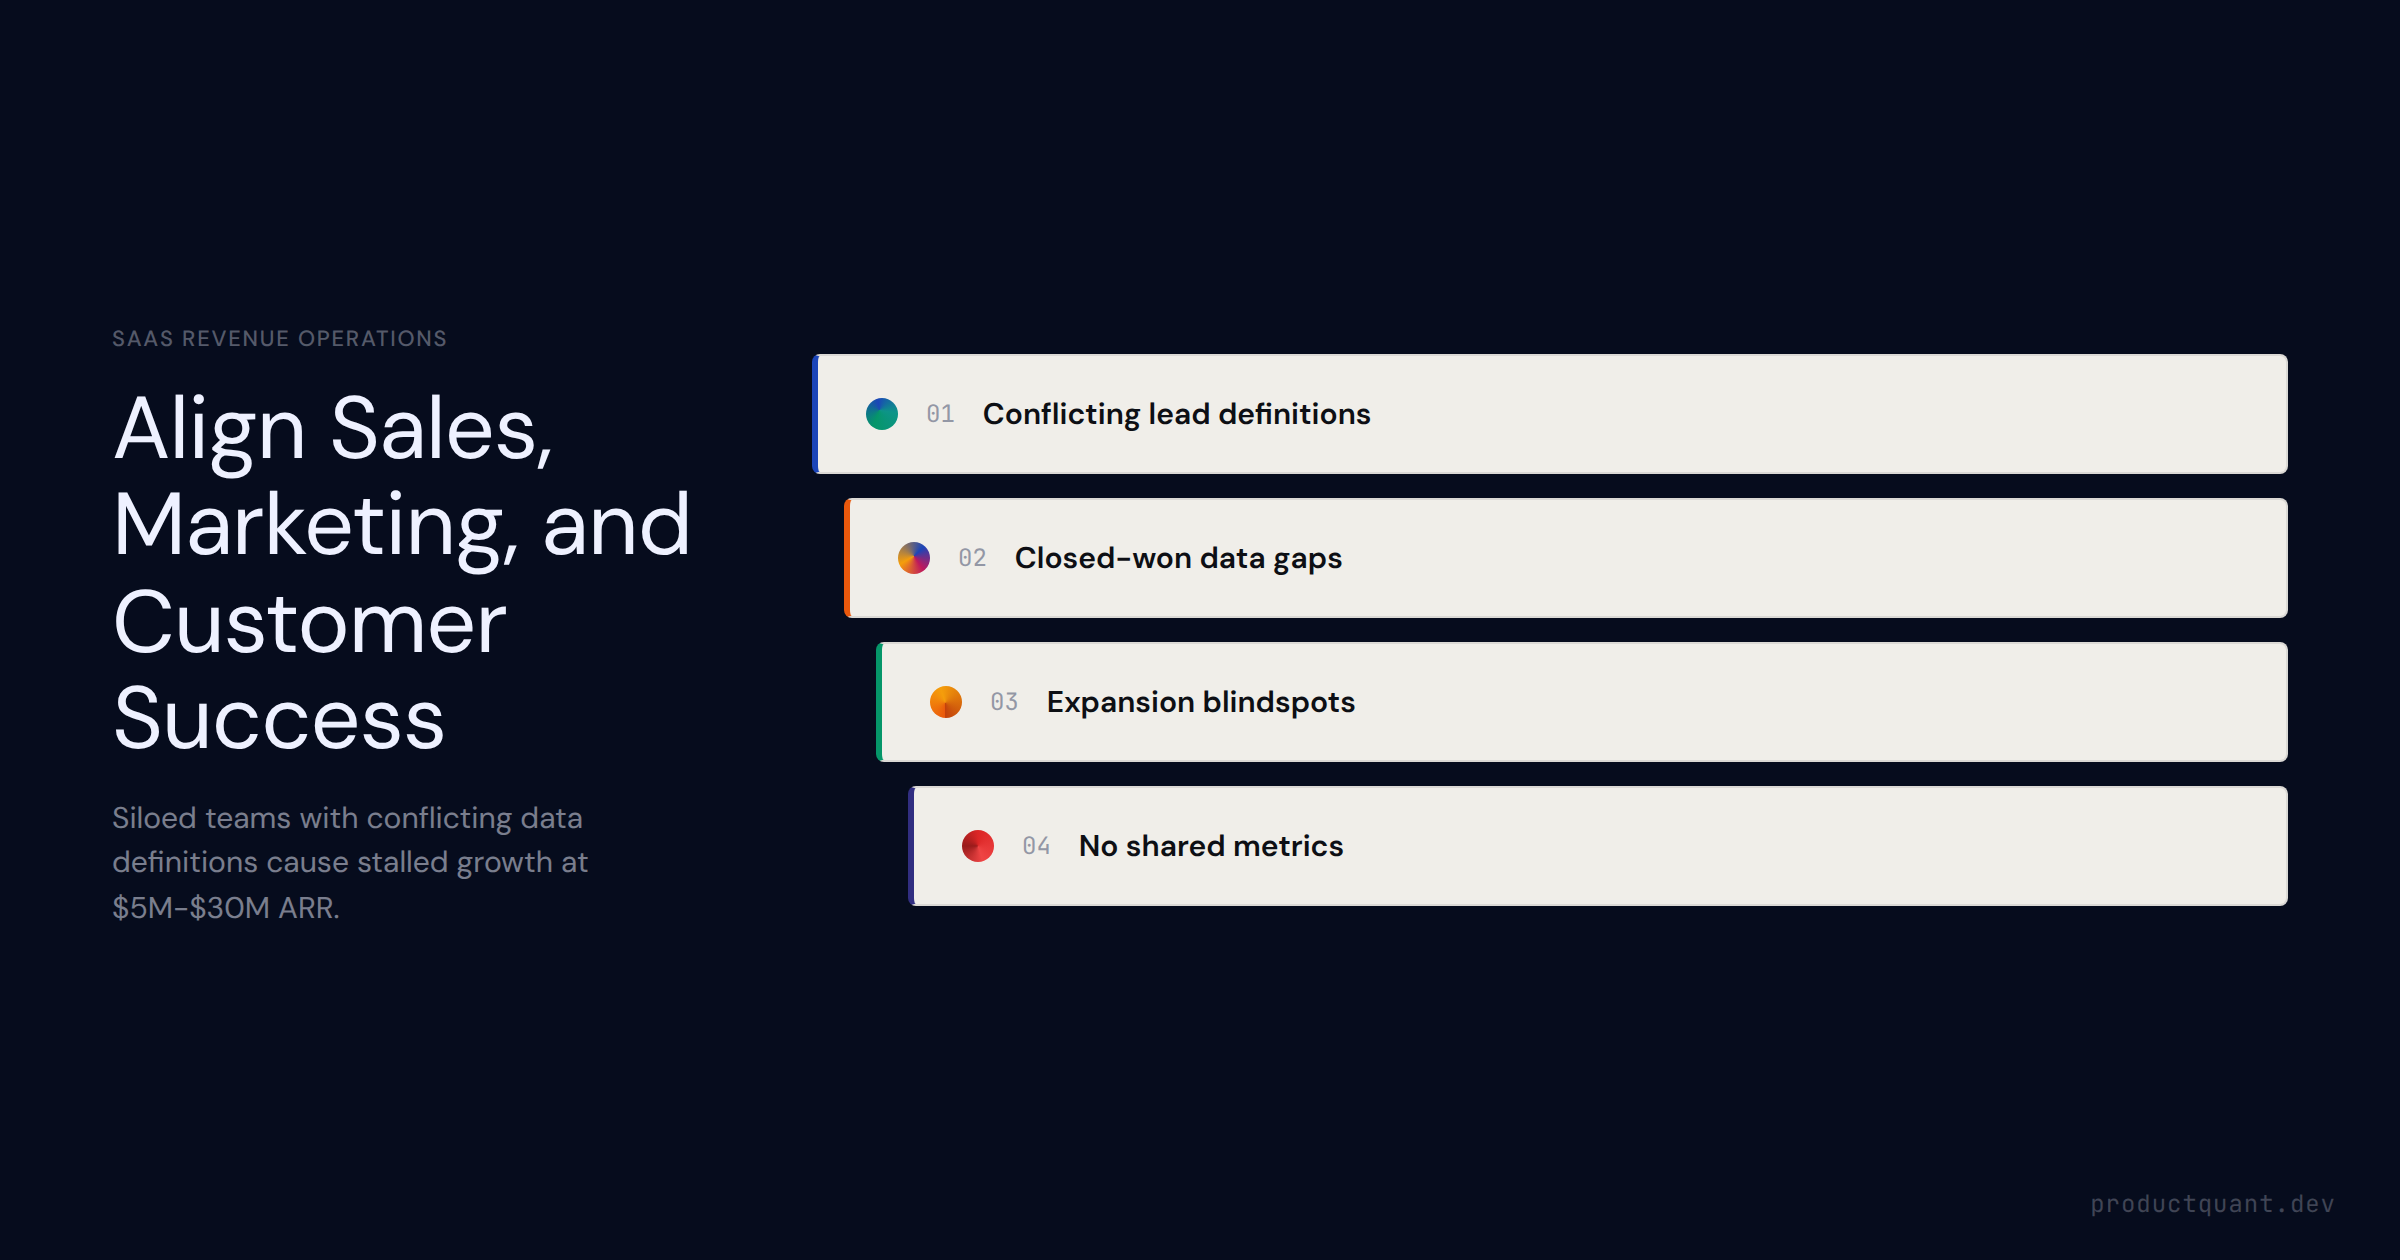
What Revenue Operations actually is in B2B SaaS — the sales/marketing/CS alignment problem, what RevOps owns, the data infrastructure it requires, team structures by company size, and why shared metrics are the only cure
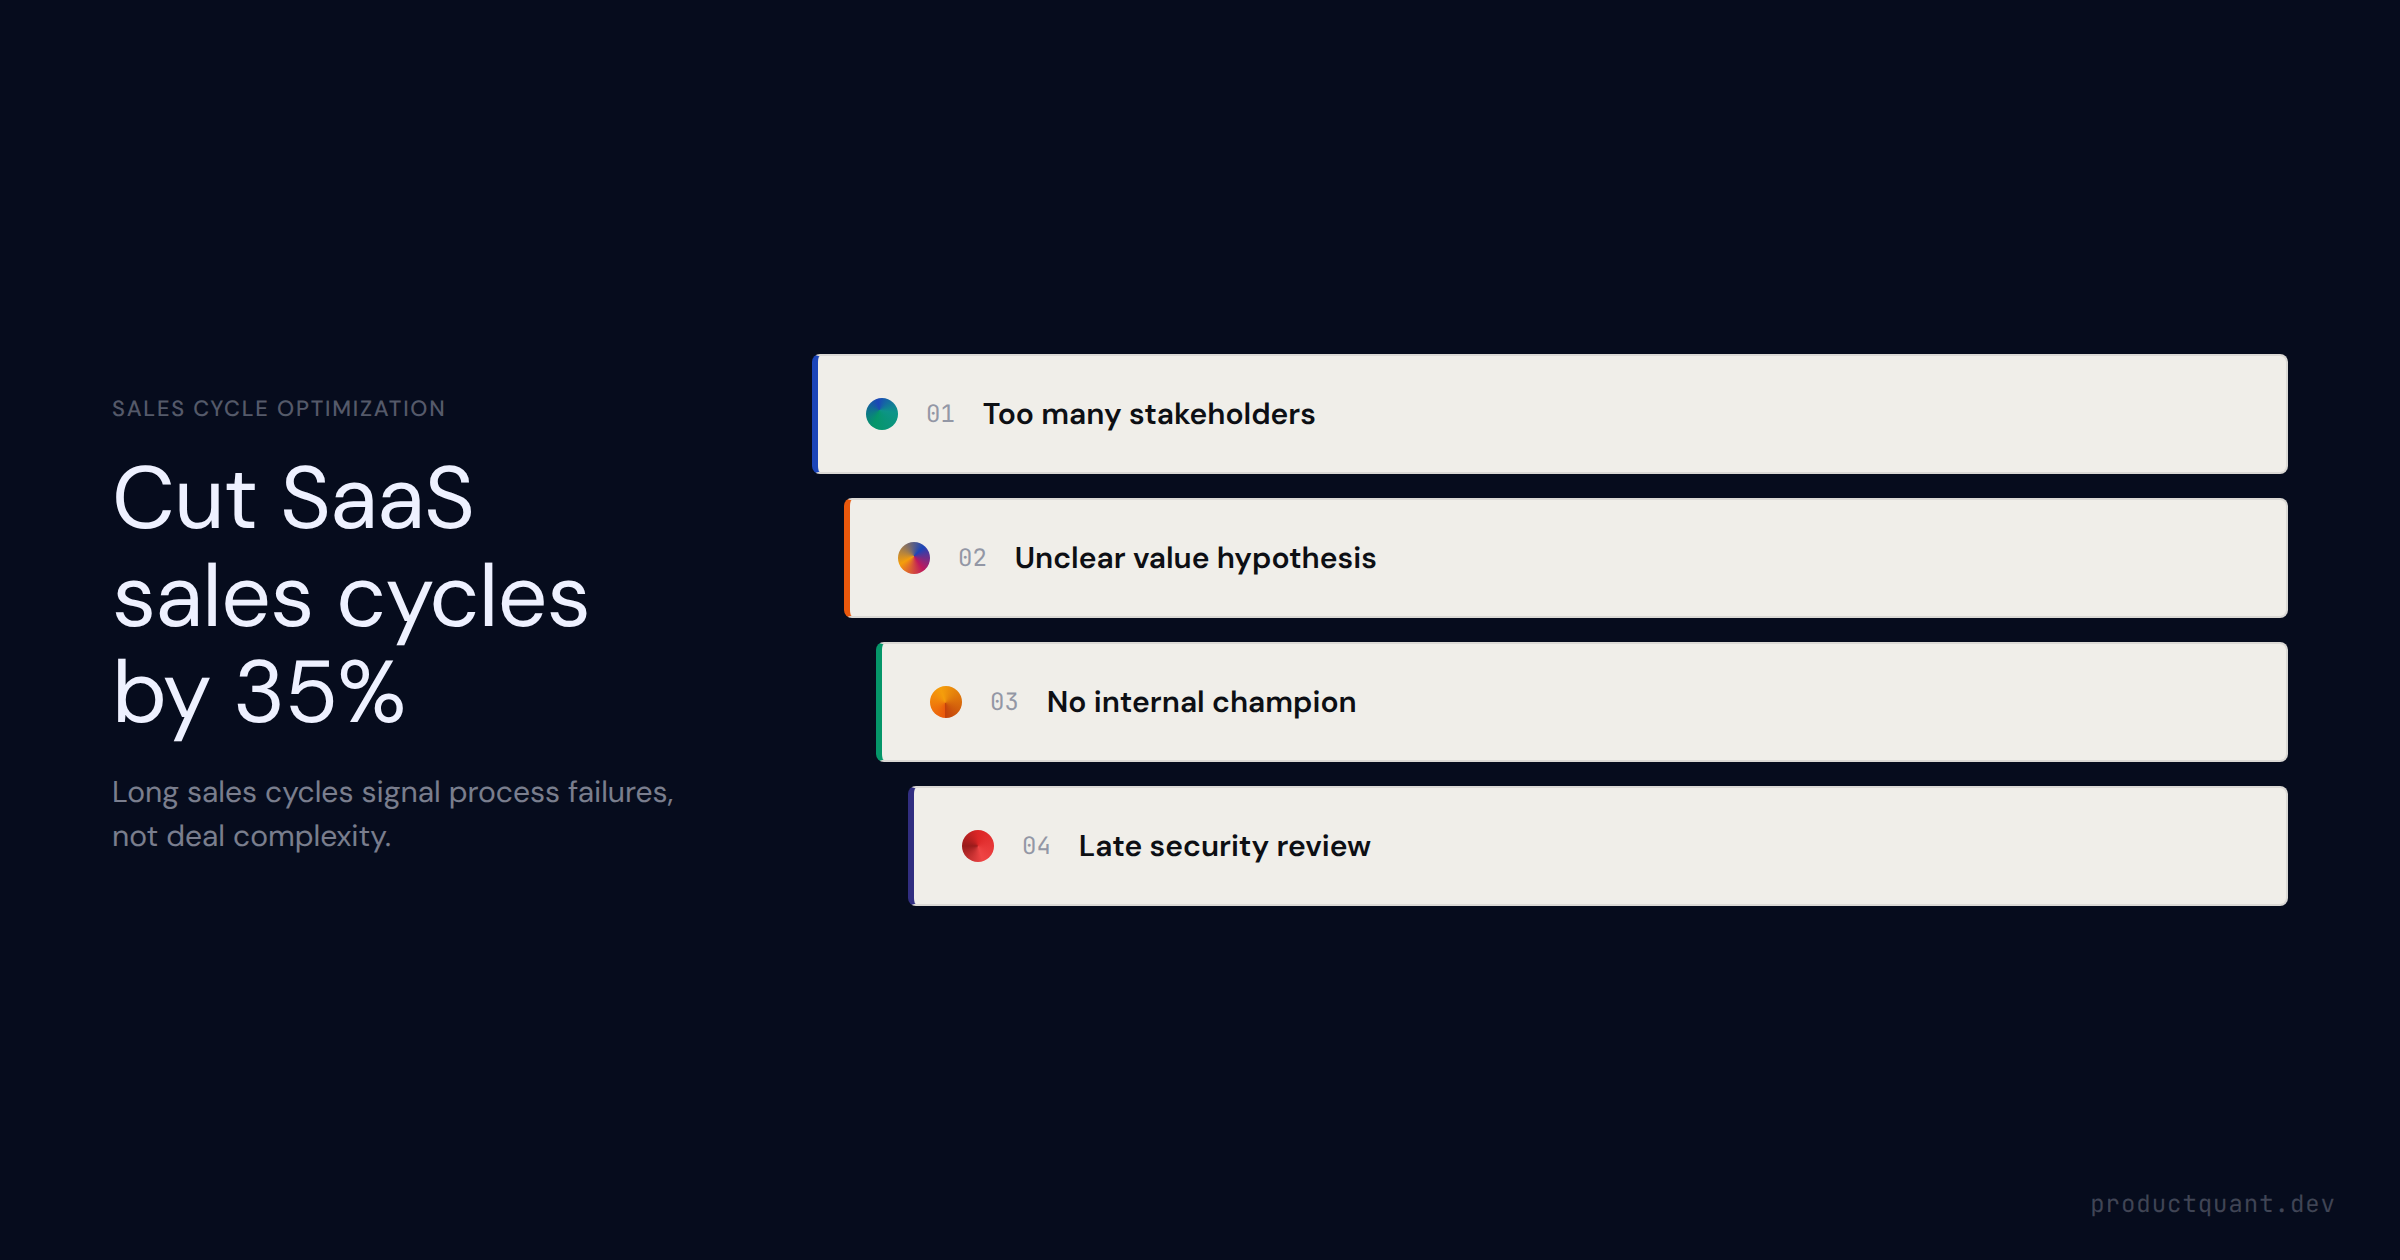
The 5 root causes of long SaaS sales cycles — too many stakeholders, unclear value hypothesis, no champion, late security review, unclear next steps — and the 3-stage cycle audit that surfaces exactly where your deals st

B2B SaaS sales cycles stall at five predictable stages. This guide maps the specific interventions that compress each one — and why evaluation is the single highest-leverage stage to fix first.
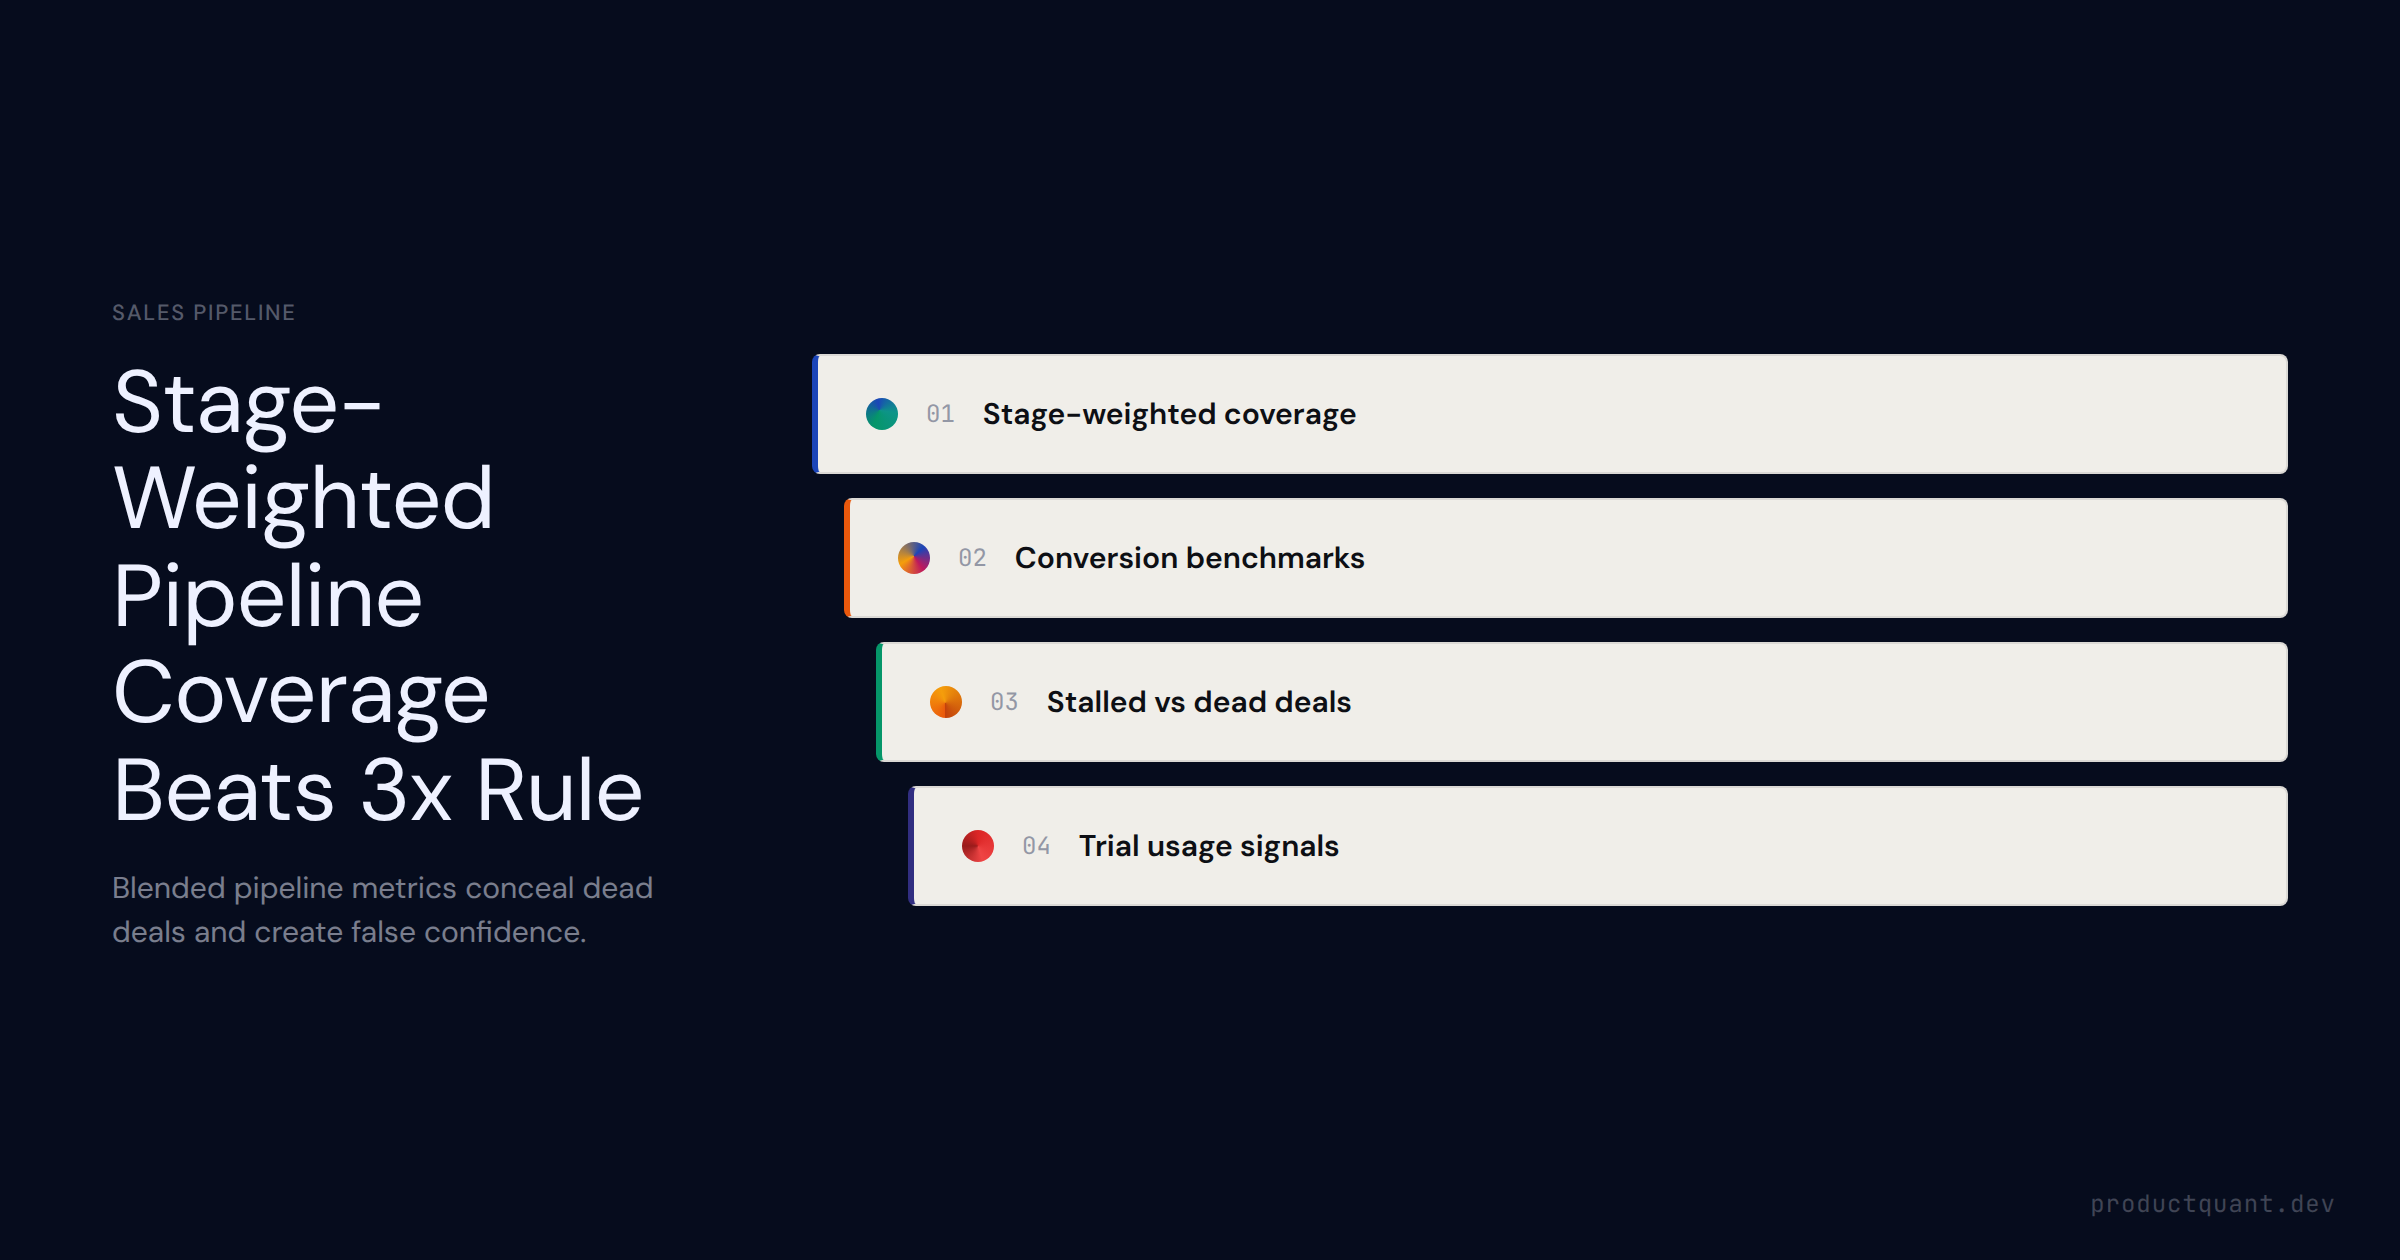
How to manage a SaaS sales pipeline that actually reflects deal reality — pipeline coverage ratios, stage-by-stage conversion benchmarks, stalled vs. dead deal diagnosis, review cadence design, and how product trial usag
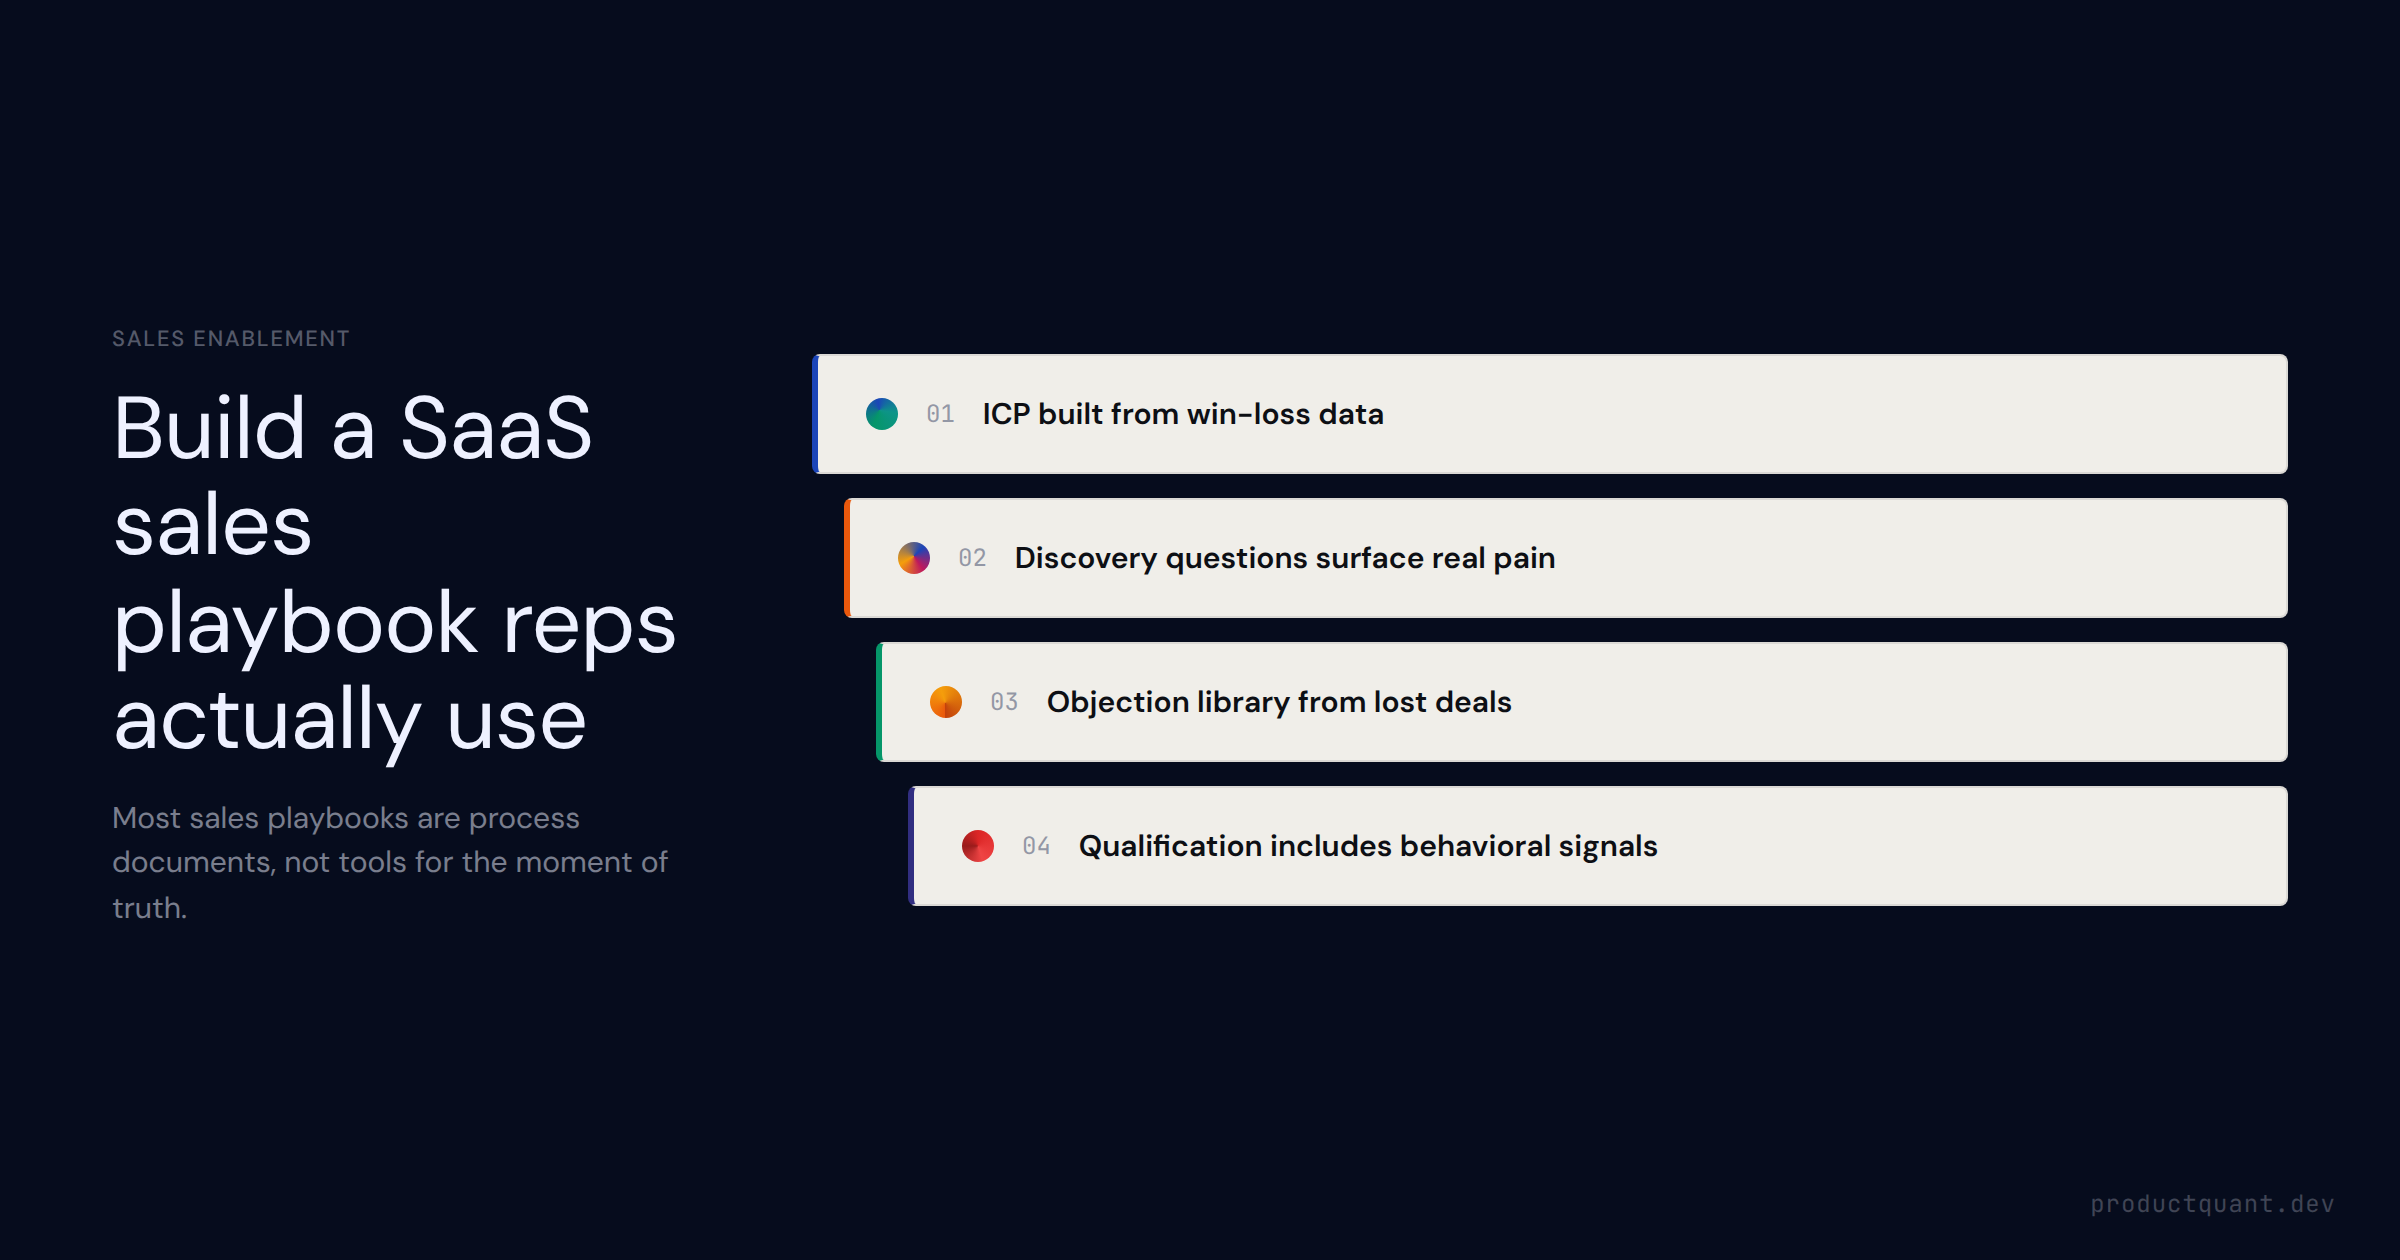
A SaaS sales playbook is not a process document — it is what reps do on calls. Learn the 4 core components: ICP definition, discovery script, objection library, and qualification criteria, including how trial usage data
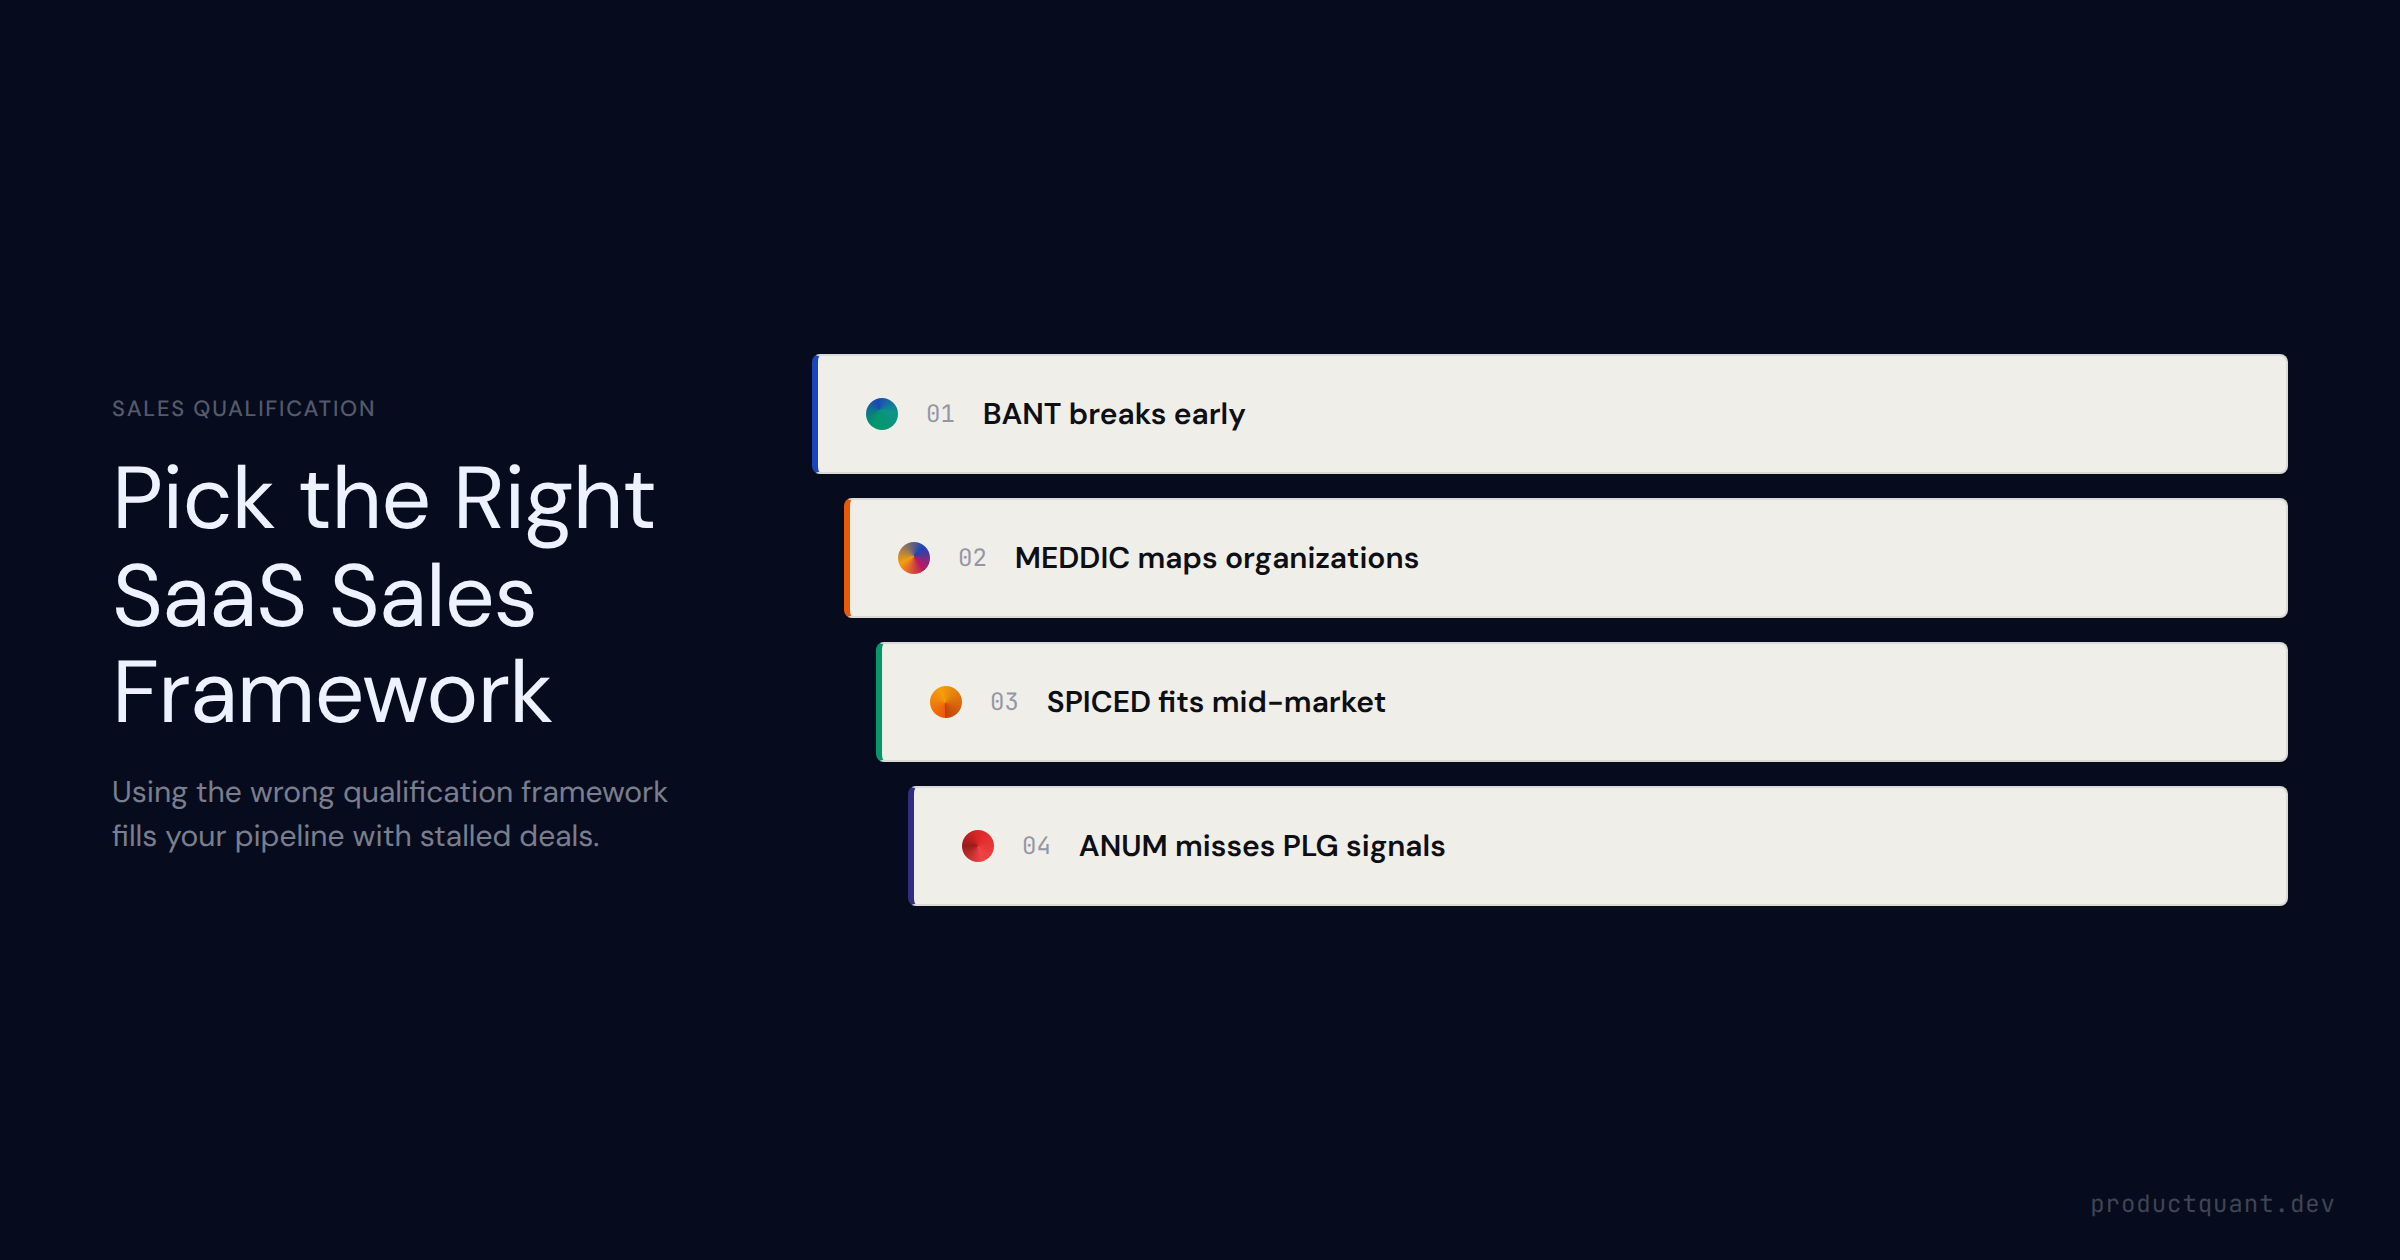
The four major SaaS sales qualification frameworks compared: BANT, MEDDIC, SPICED, and ANUM. When each applies, where each breaks down, and how to build a hybrid model that combines framework criteria with product behavi

The sales velocity equation — opportunities × deal value × win rate ÷ sales cycle — is a diagnostic, not just a metric. Learn which lever is your actual constraint and what moving each one by 10% does to your output.
Most SaaS teams track onboarding completion as their activation metric. This is a comfortable mistake. Onboarding completion tells you whether users finish
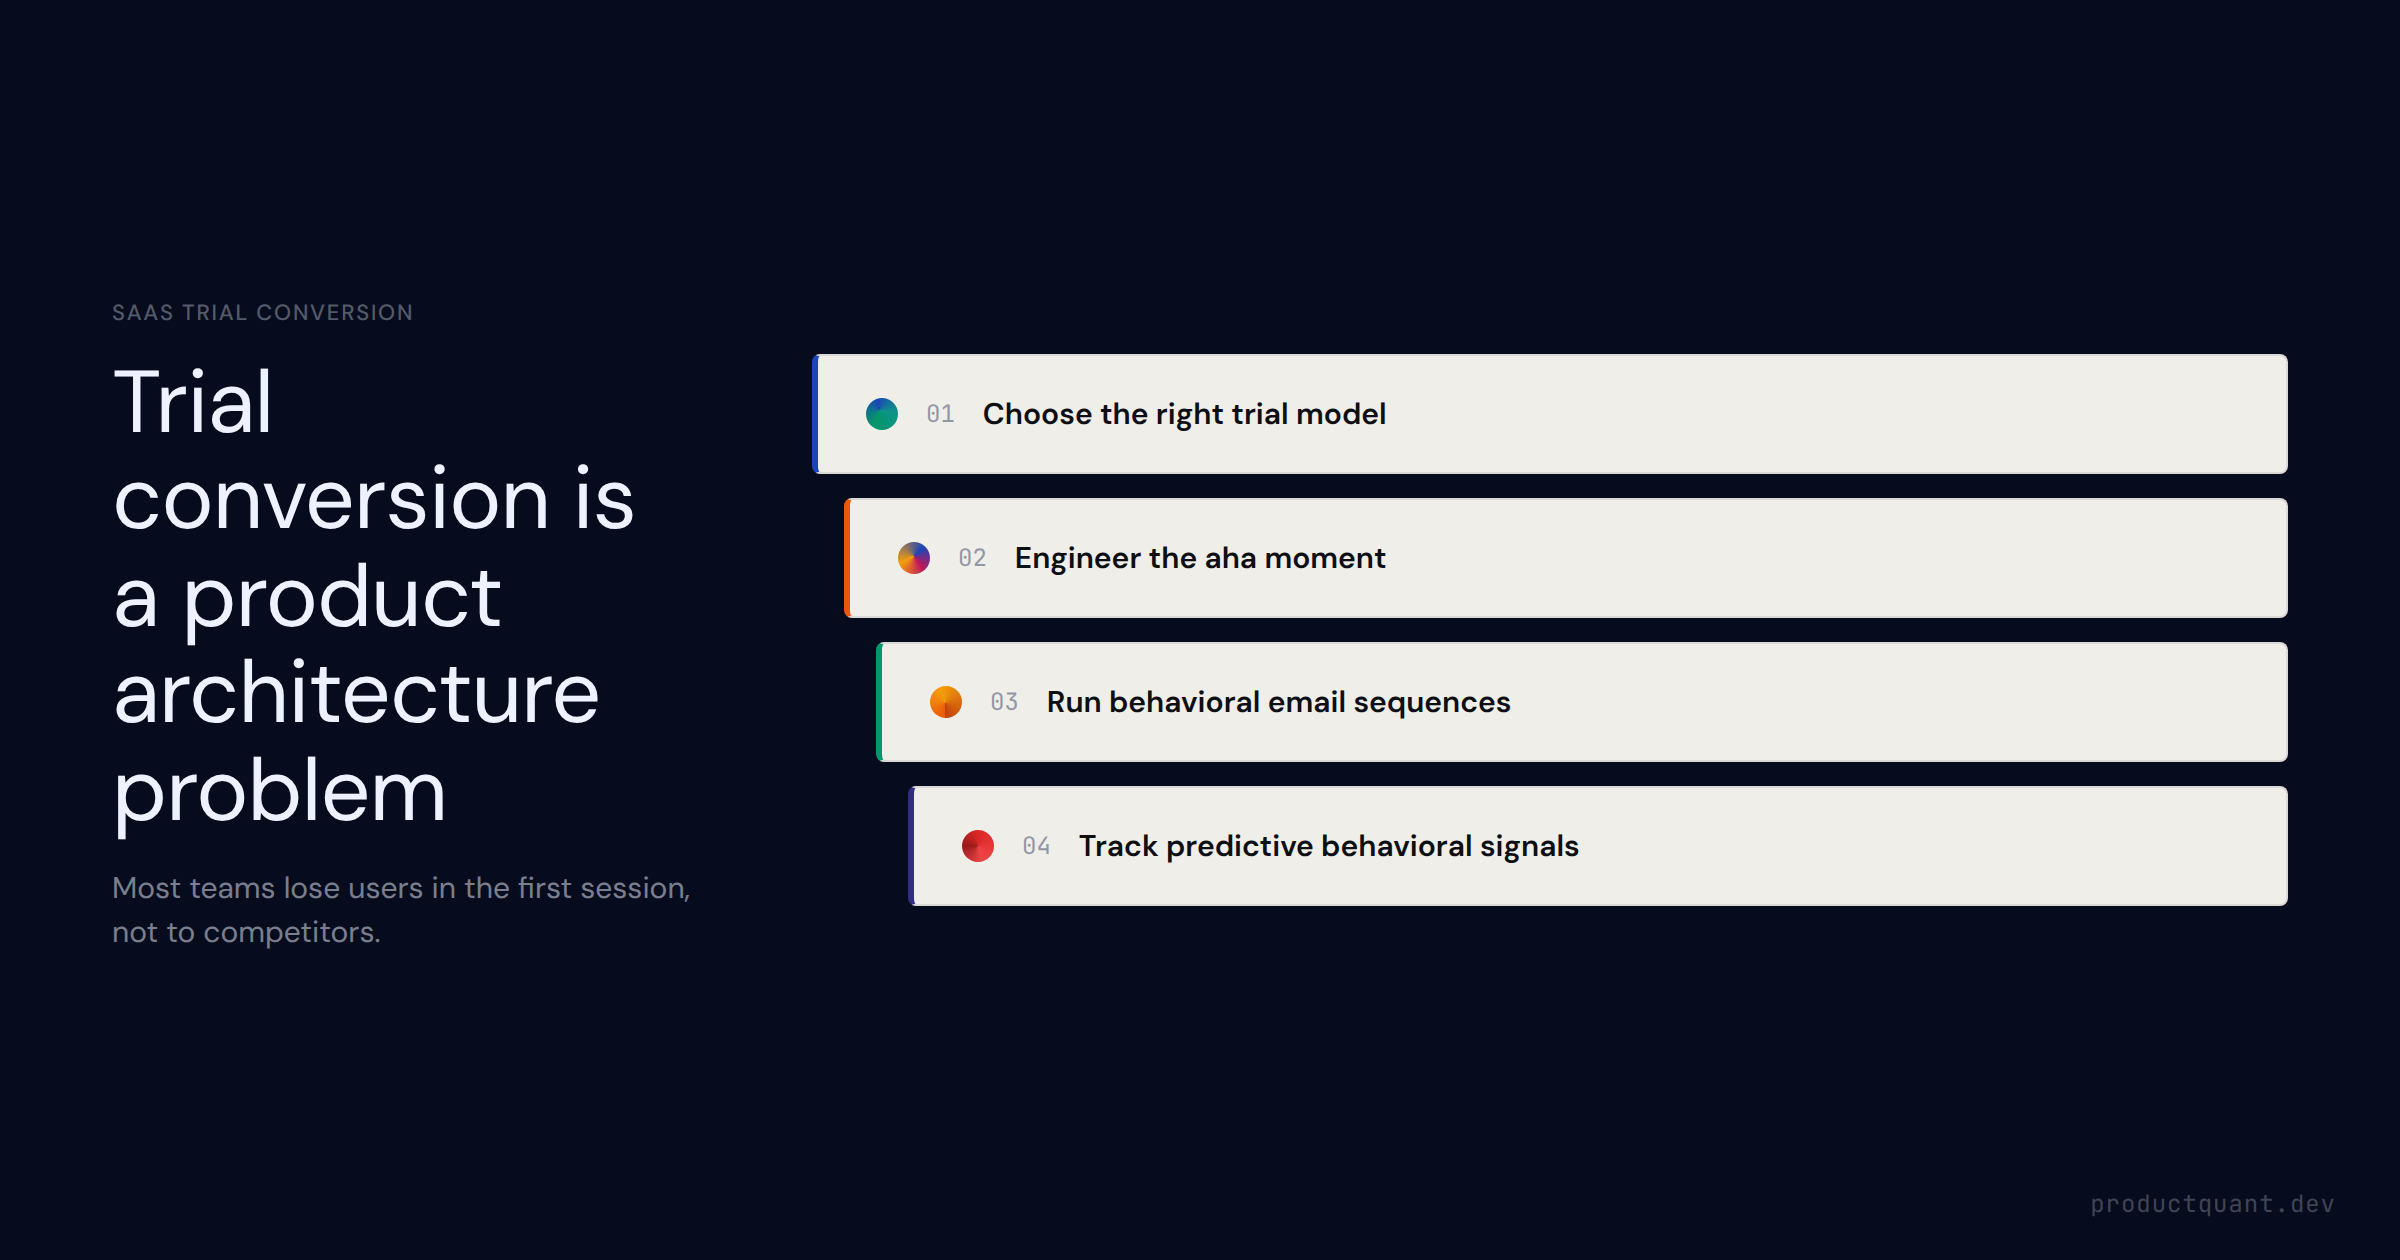
How SaaS companies convert free trial users into paying customers. Trial model decision matrix, aha-moment engineering, email sequences, and the behavioral signals that predict conversion.
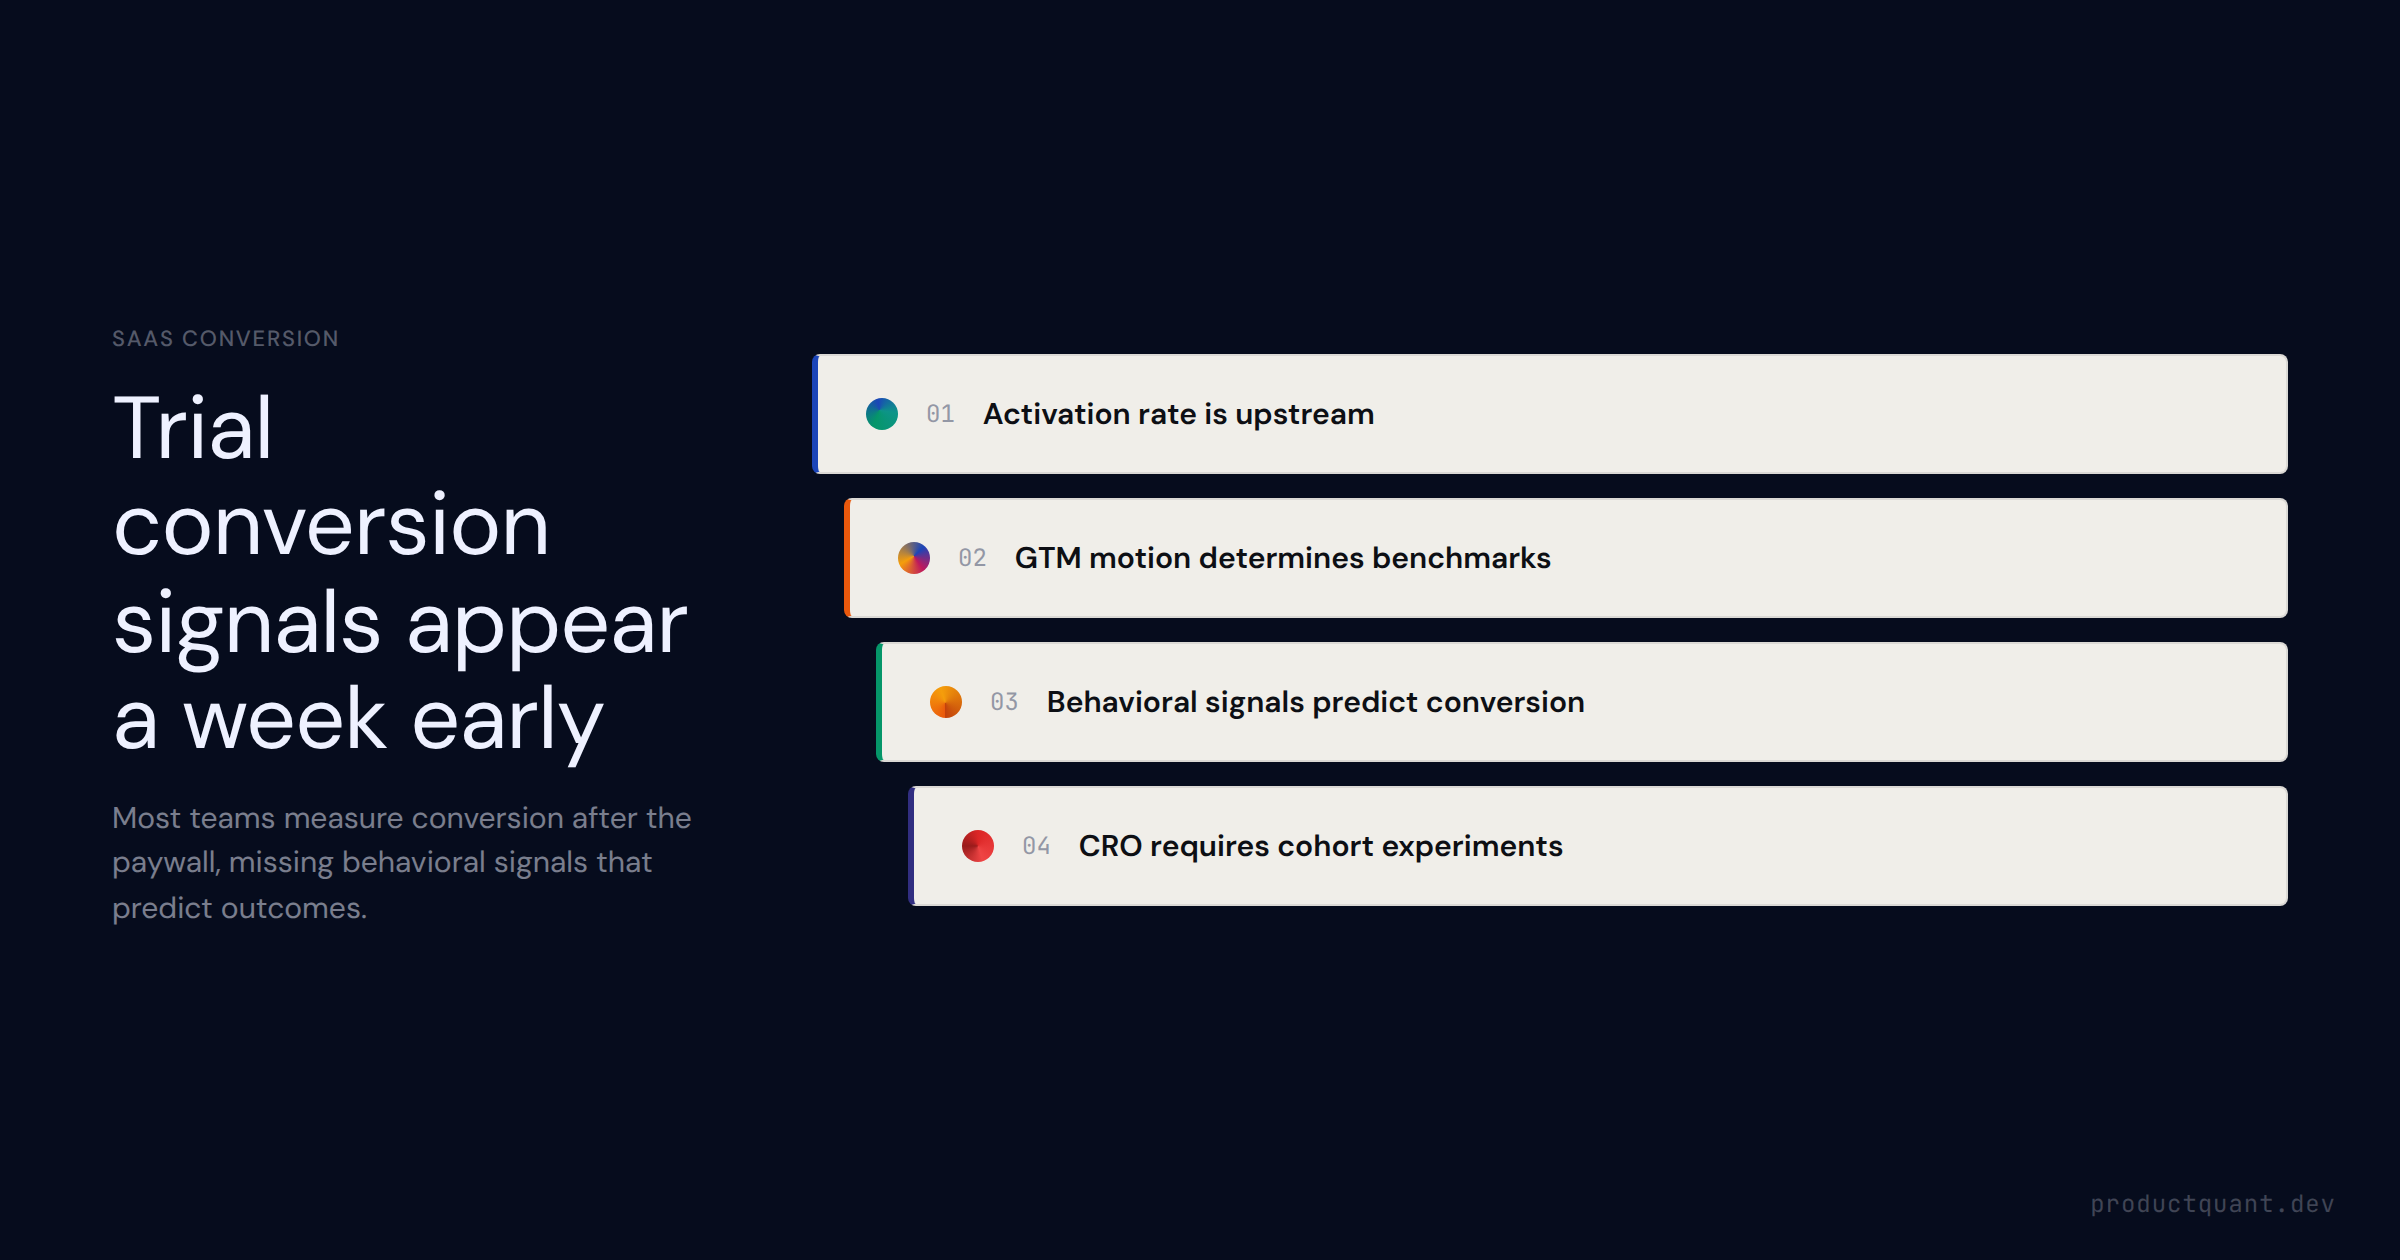
Industry benchmarks by GTM motion (PLG 2–5%, sales-assisted 15–30%), the 5 conversion levers, and the leading behavioral signals that predict who converts 7+ days before the paywall appears.
What drives user activation in B2B SaaS — the activation moment definition, how to distinguish activation rate from aha moment depth, 6 intervention types, and how to build an experiment system that finds the leverage po
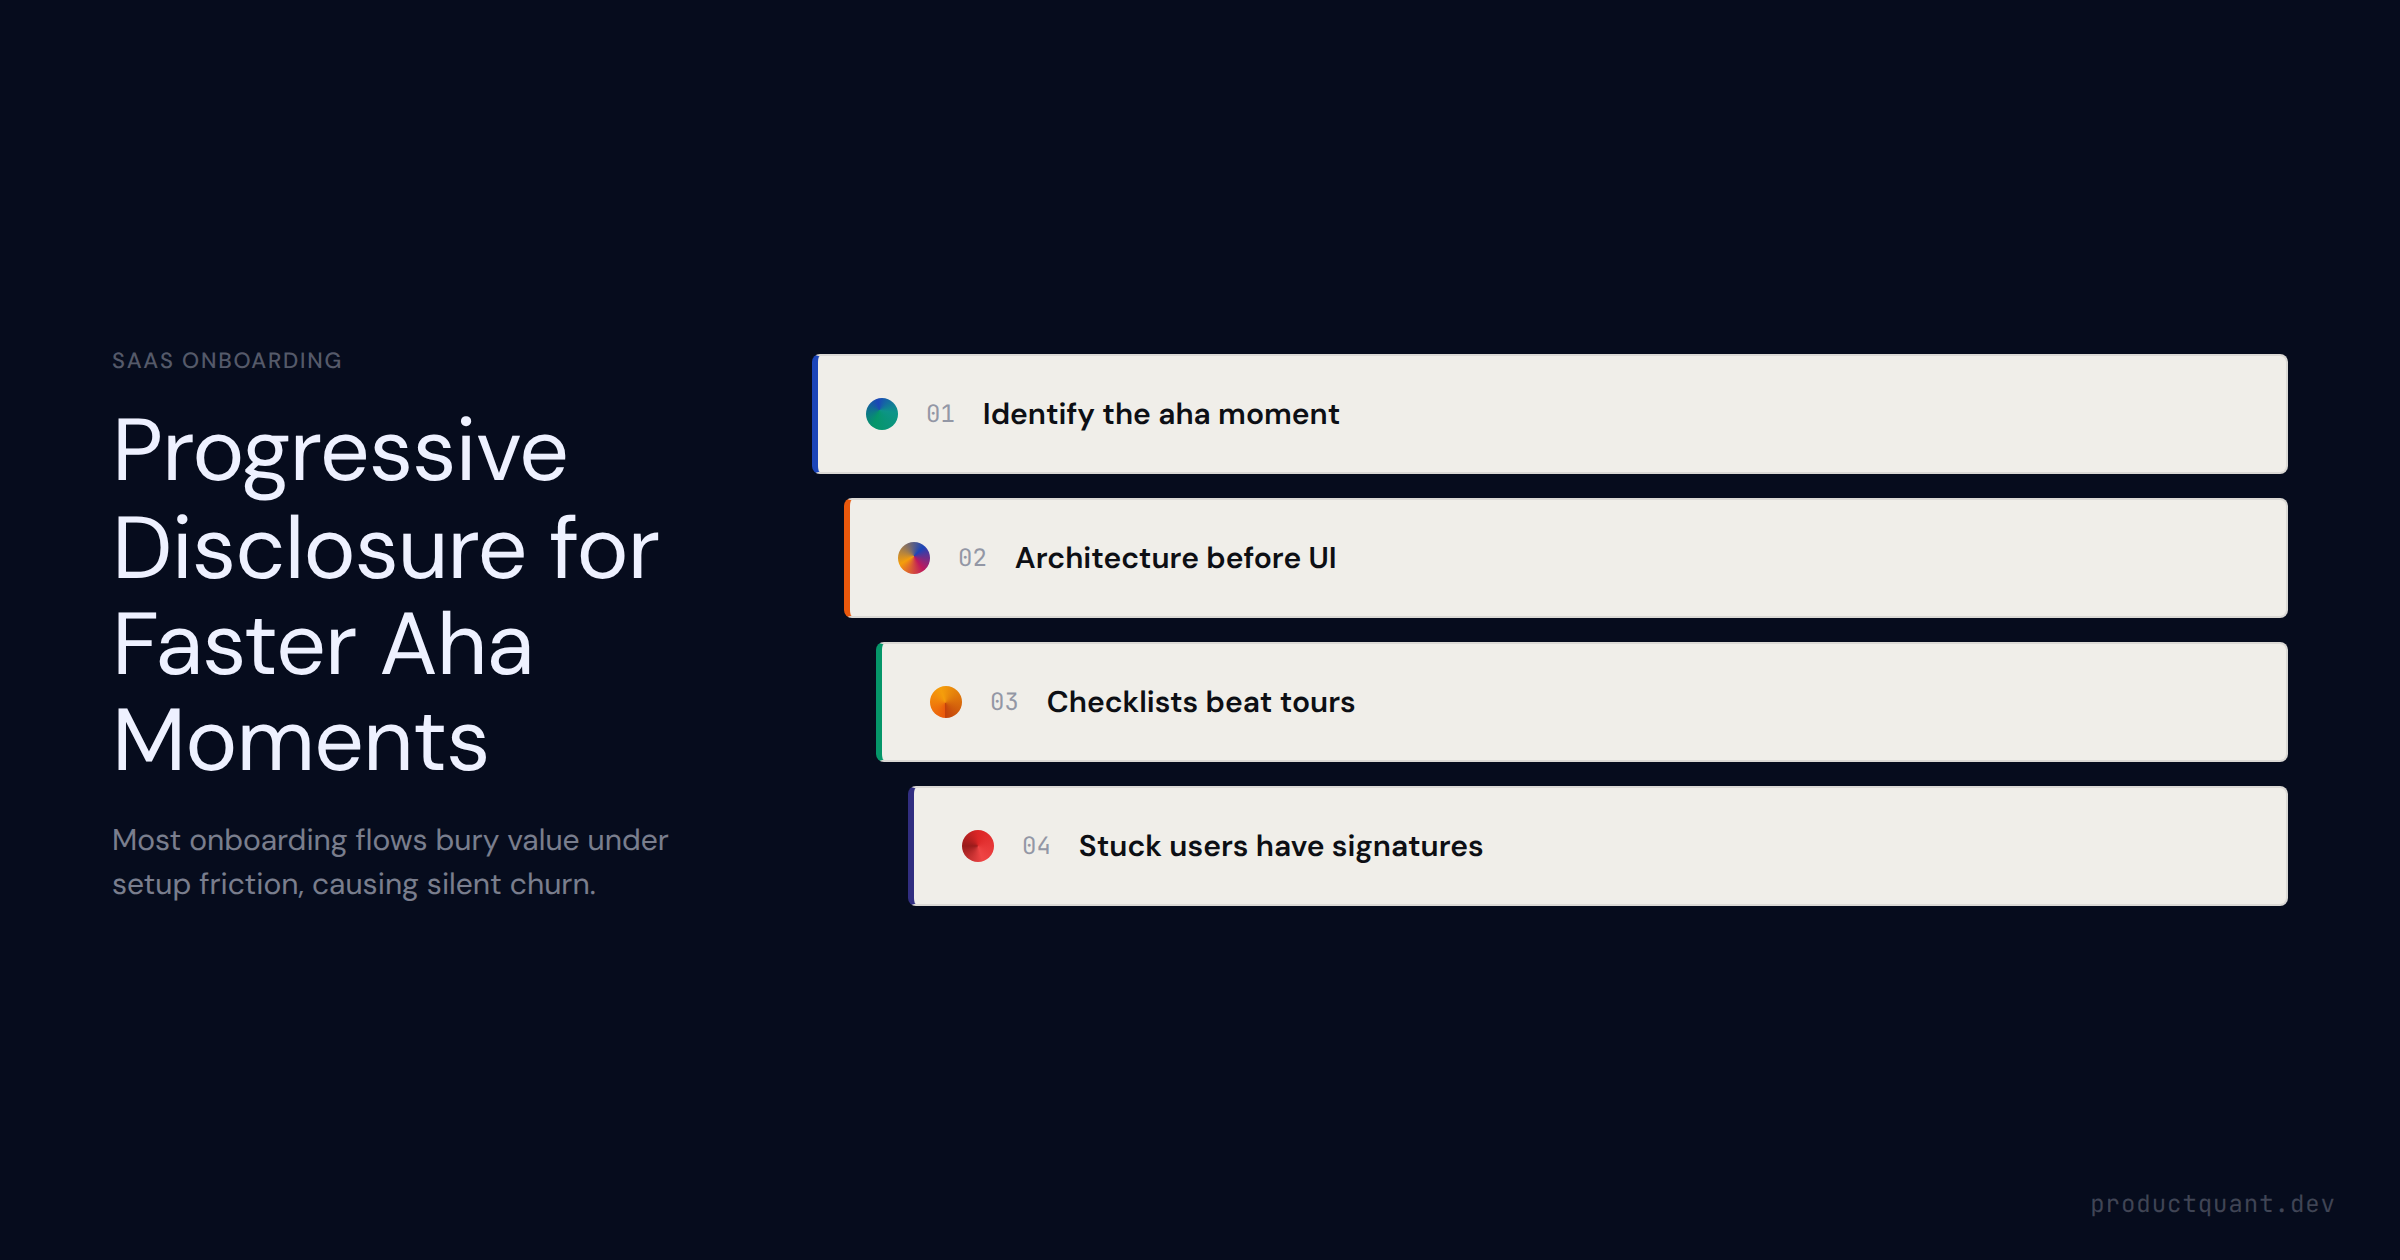
How to design a SaaS user onboarding flow that converts — covering the three in-app guidance mechanisms, progressive disclosure vs. front-loading, the first 5 minutes, email drip as a recovery channel, and the specific a
Firmographic segmentation describes your customers. Behavioral and lifecycle segmentation predicts what they will do next. This guide covers all three dimensions — and how to act on each one.
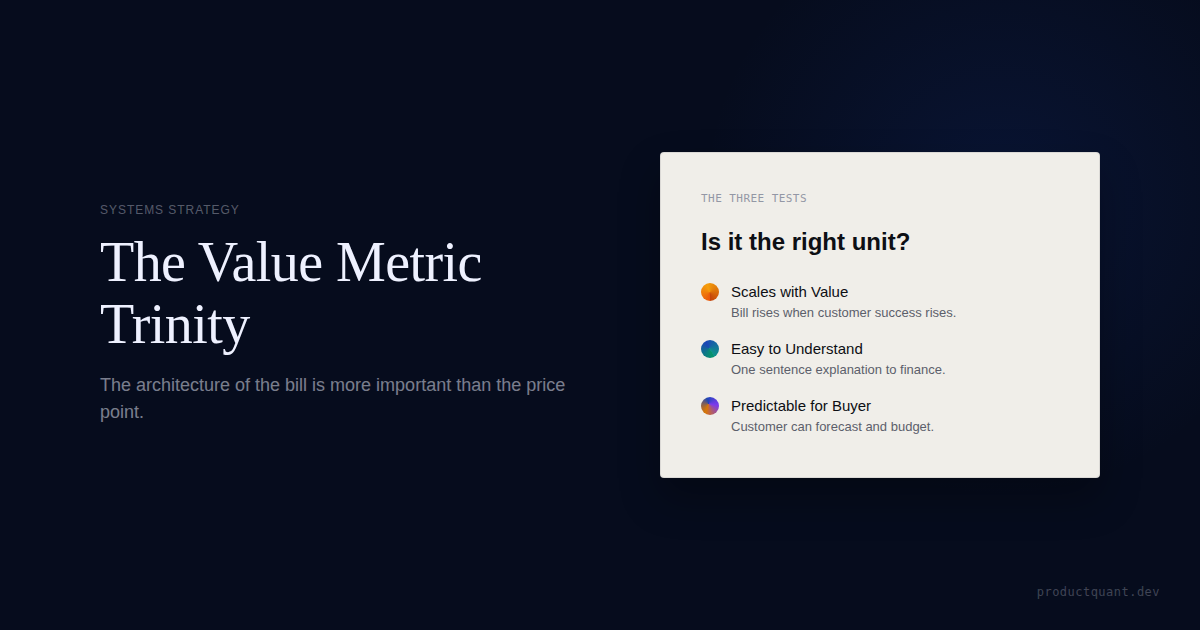
Choose the SaaS value metric that scales with customer value, stays understandable to buyers, and does not undermine adoption or expansion.
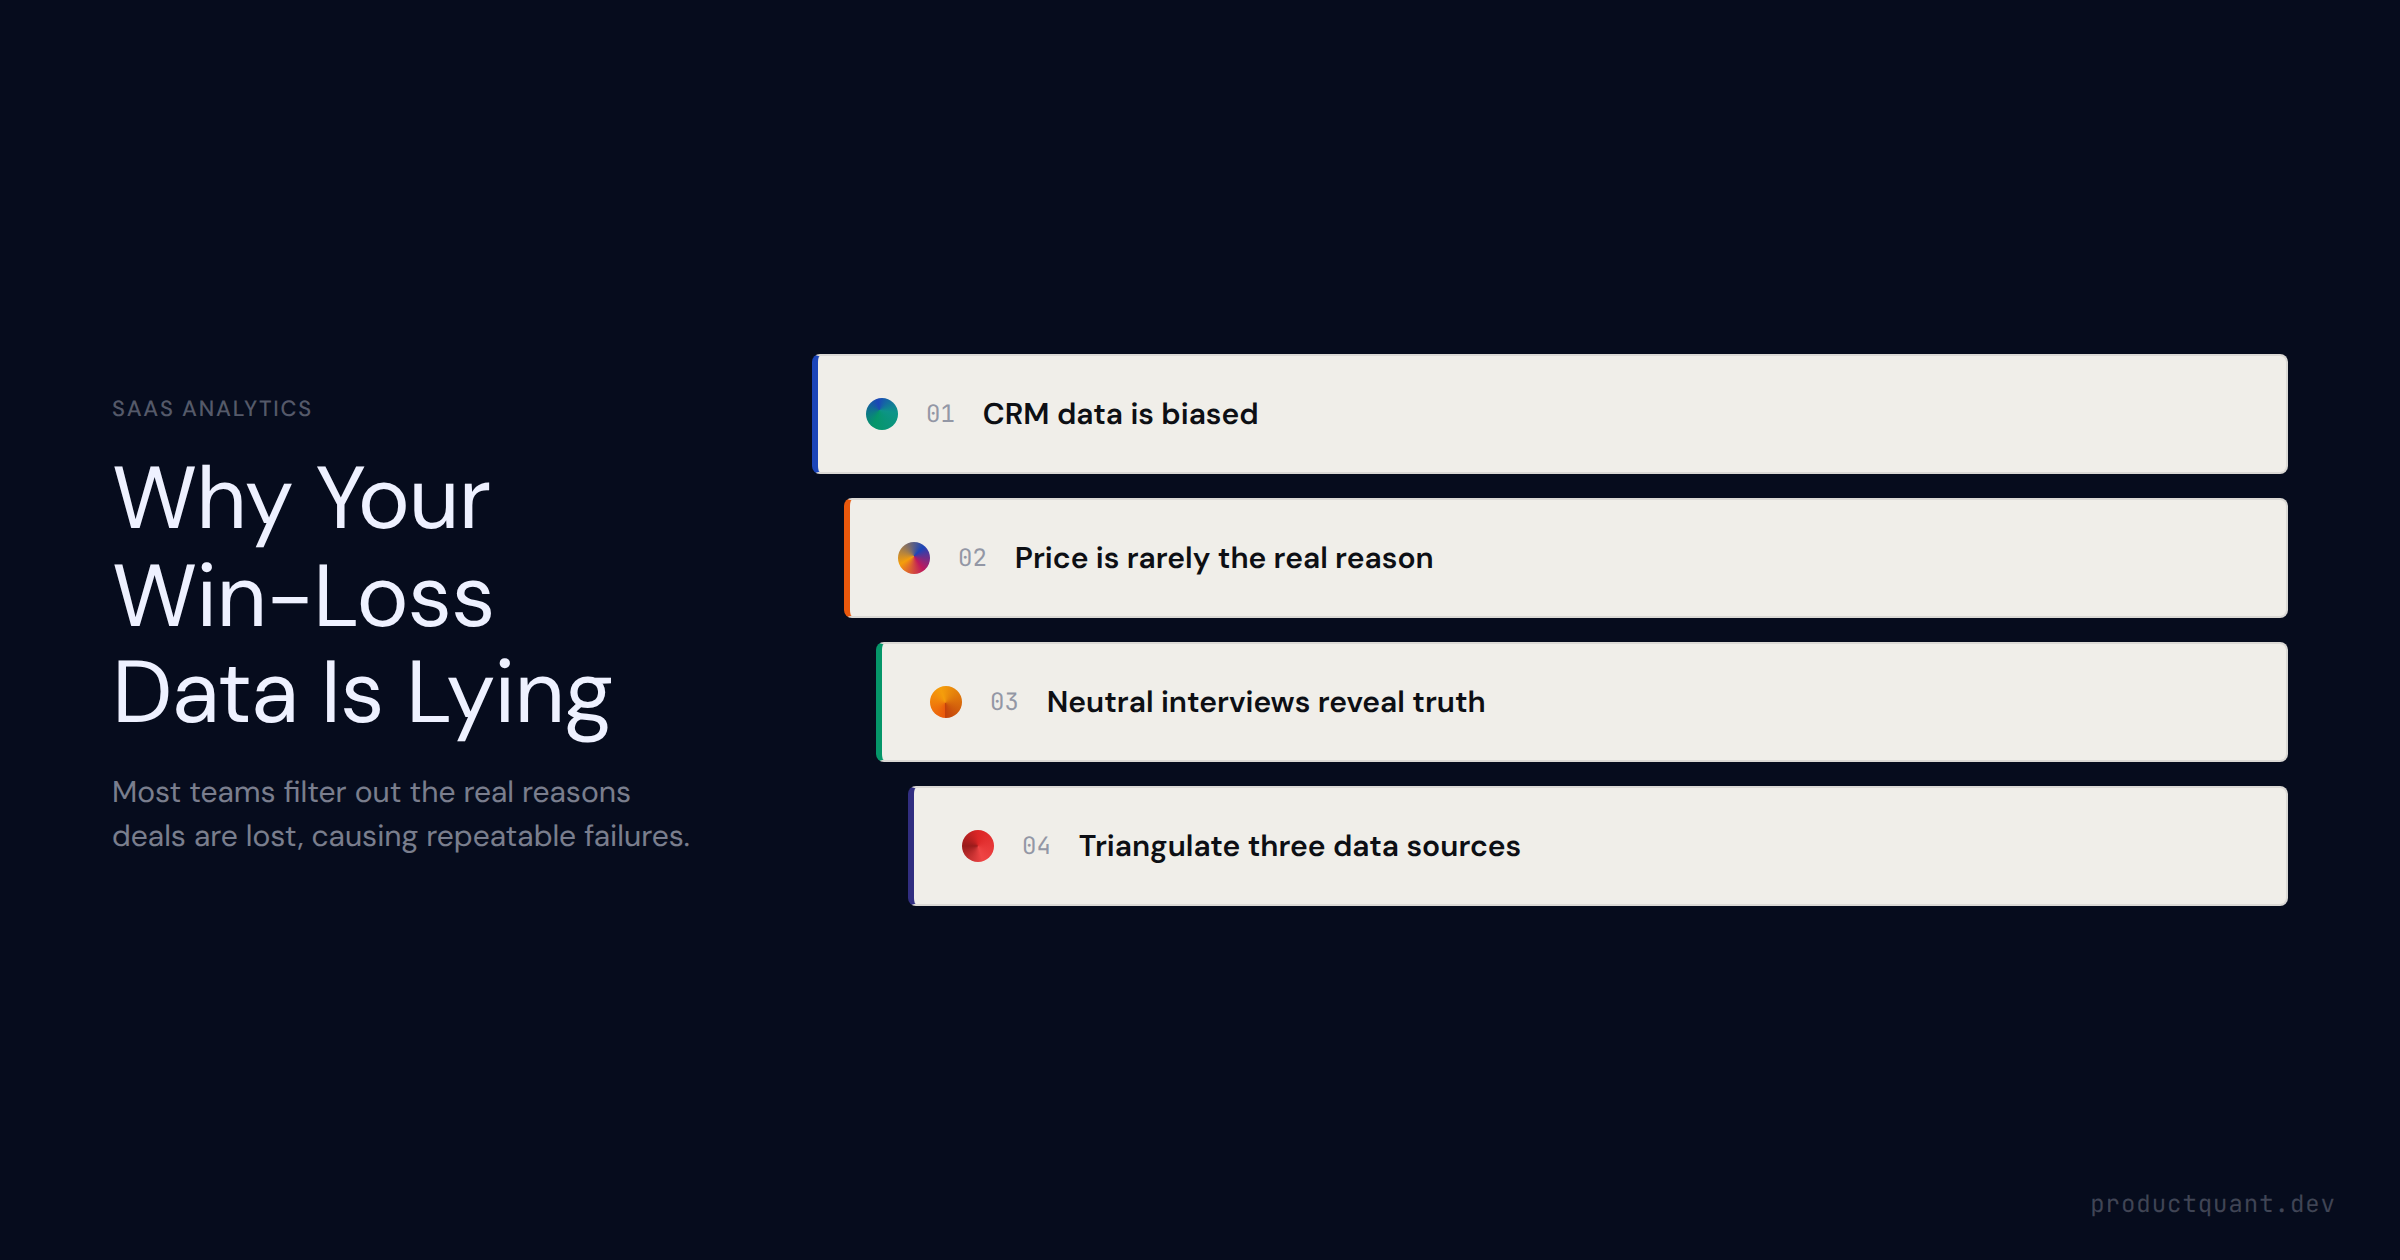
SaaS win-loss analysis relies on four data sources — exit interviews, CRM dispositions, trial behavior, and competitive intel — but only one is truly objective. This guide covers signal quality, rep attribution bias, the
Analysis of how major sales intelligence platforms structure their YouTube and blog content for seed-to-Series-A audiences. Based on deep research of their content strategies and what works.

Most PLG transitions fail not from lack of effort but from wrong sequencing. Here
CRM pipeline reports tell you what reps entered — not what is actually happening in the market. The gap between CRM data and real buying activity is where most pipeline forecasts break. Here is how signal-based tracking
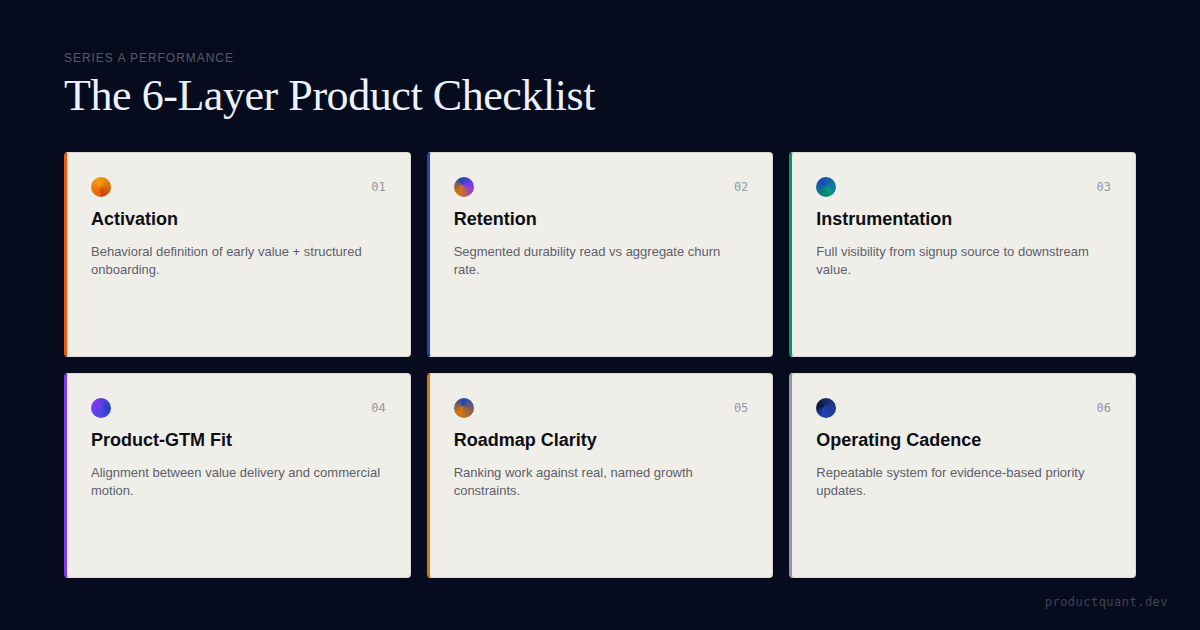
A Series A product checklist for B2B SaaS focused on activation, retention, instrumentation, product-GTM fit, roadmap clarity, and the growth system...

Complete guide to PostHog A/B experiments: SDK setup, statistical discipline, sample size calculation, and decision frameworks.
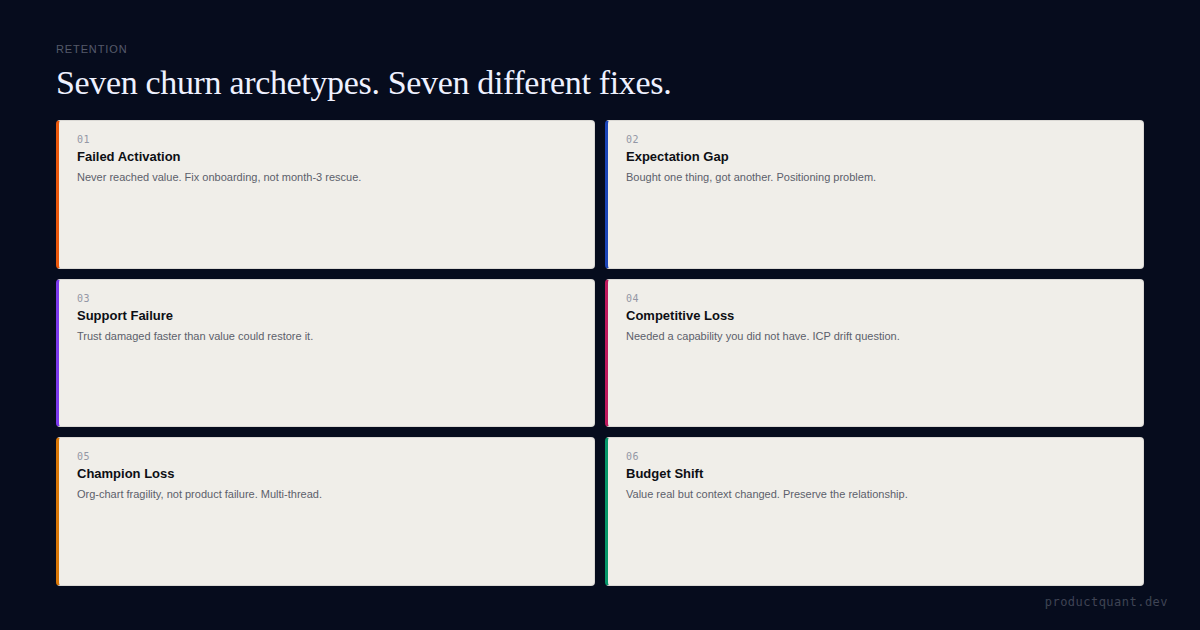
Most churn is not one problem. It is a bundle of different failure modes. Identify which of seven churn archetypes affects your B2B SaaS and fix the root cause before you lose more revenue.
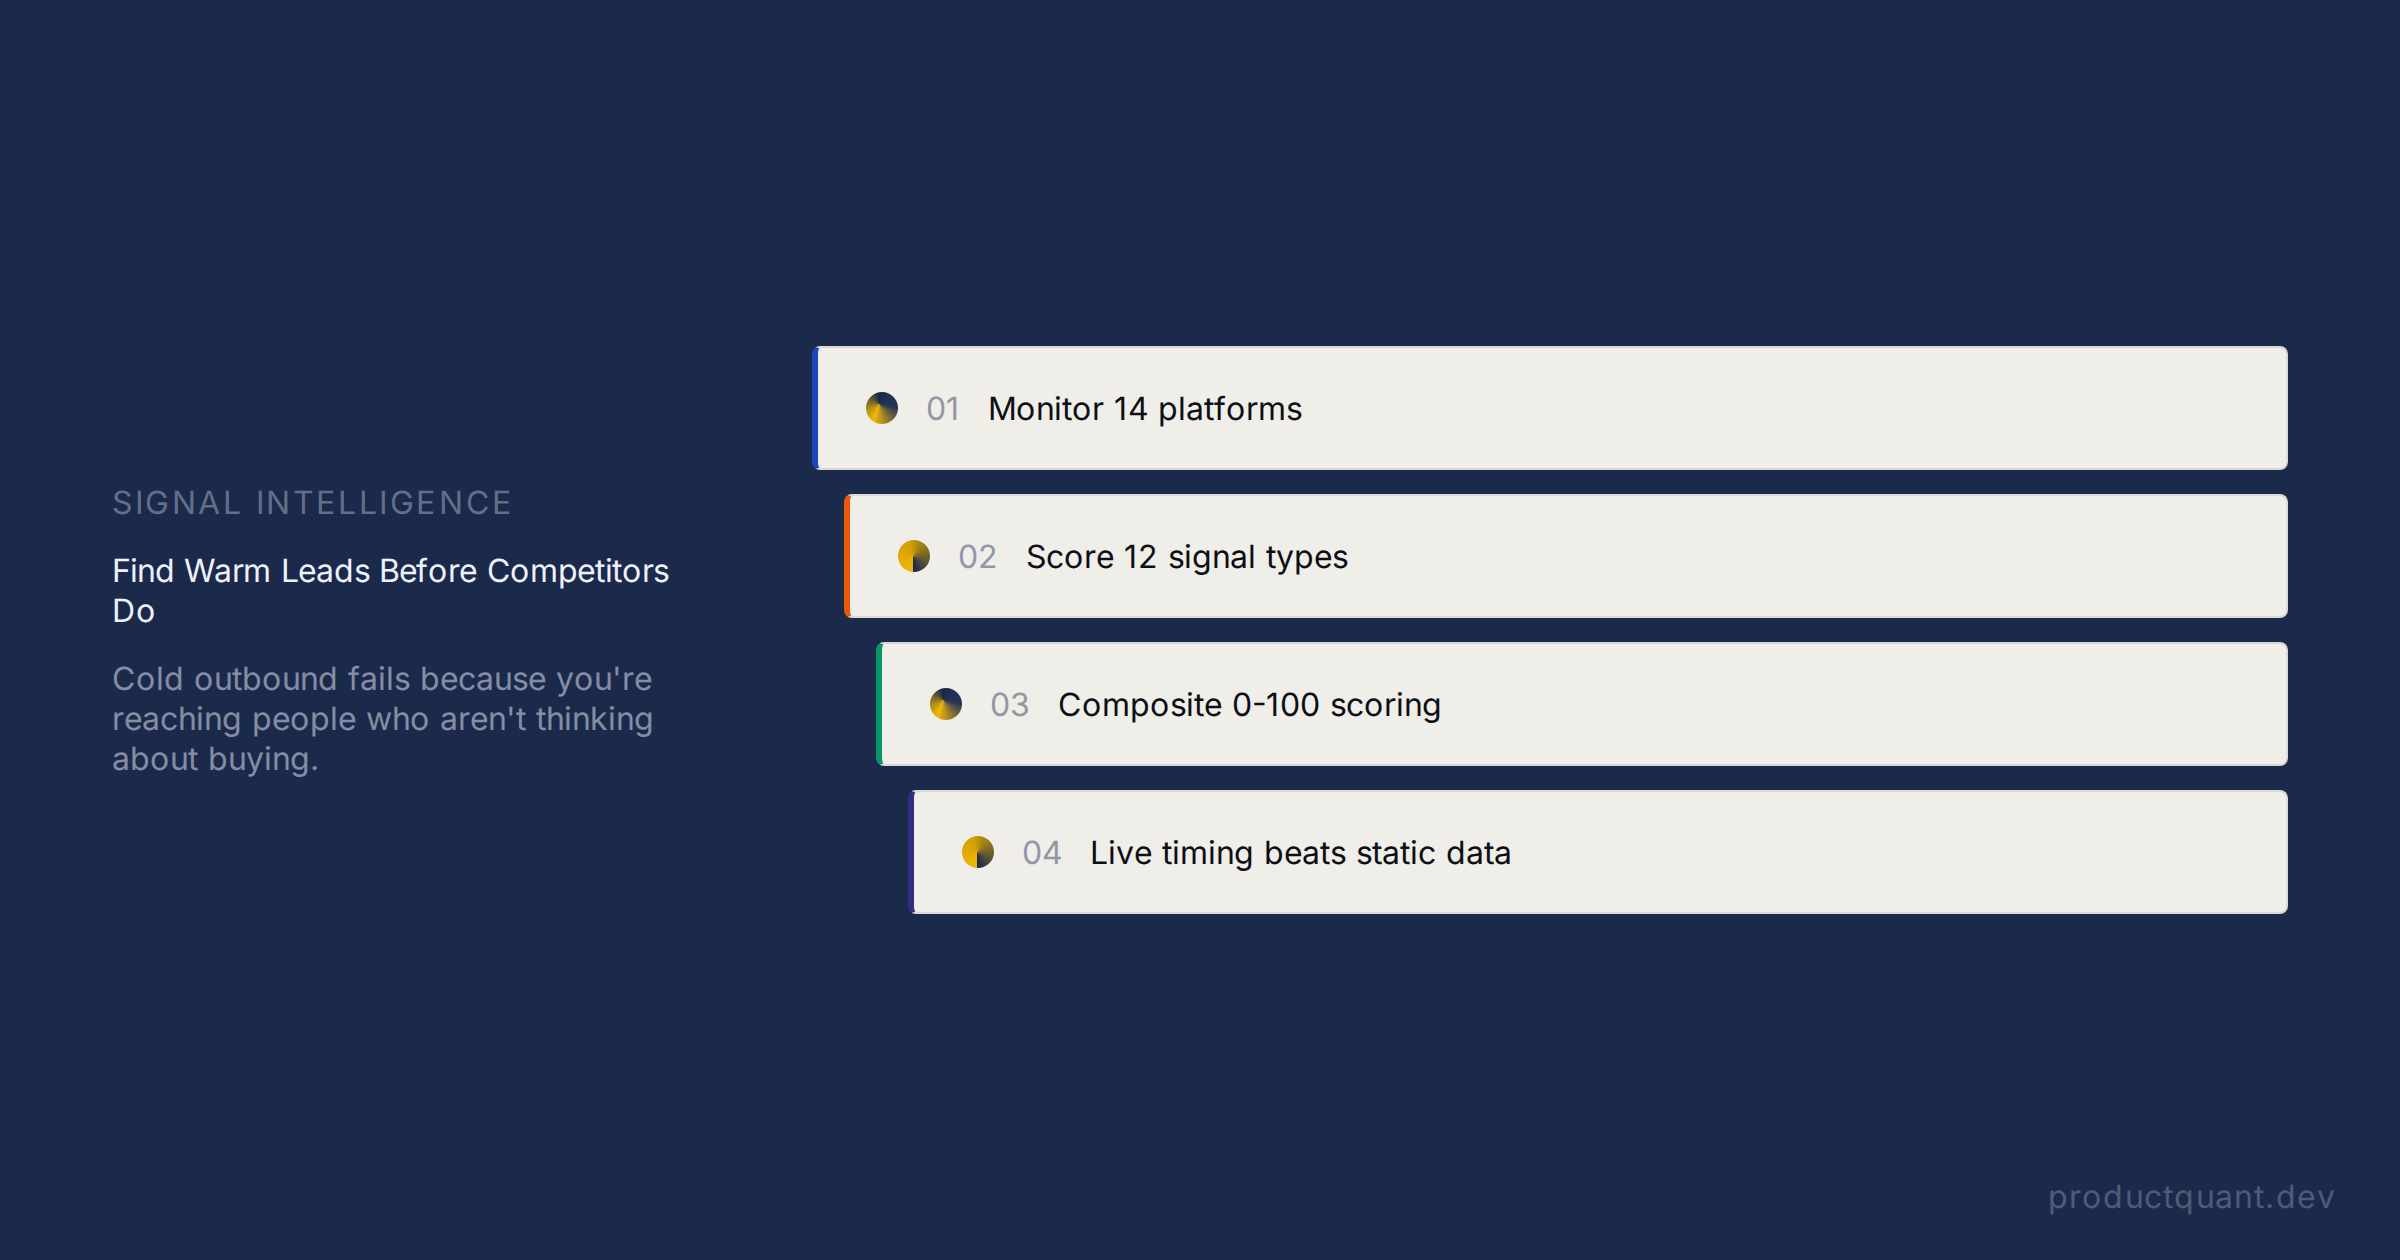
Traditional lead scoring is a rearview mirror. Signal-based prospecting monitors 13+ platforms for real buying intent in real time. This is how the best growth teams build pipeline in 2026.
Contact databases go stale the moment they are refreshed. Signal detection tells you who is actually buying right now. Here is why the B2B teams winning in 2026 prioritize signals over contacts.
Most B2B outreach targets companies already in buying mode with three vendors in the conversation. Signal intelligence finds them 30–90 days earlier — before competitive pressure drives up cost-per-reply.
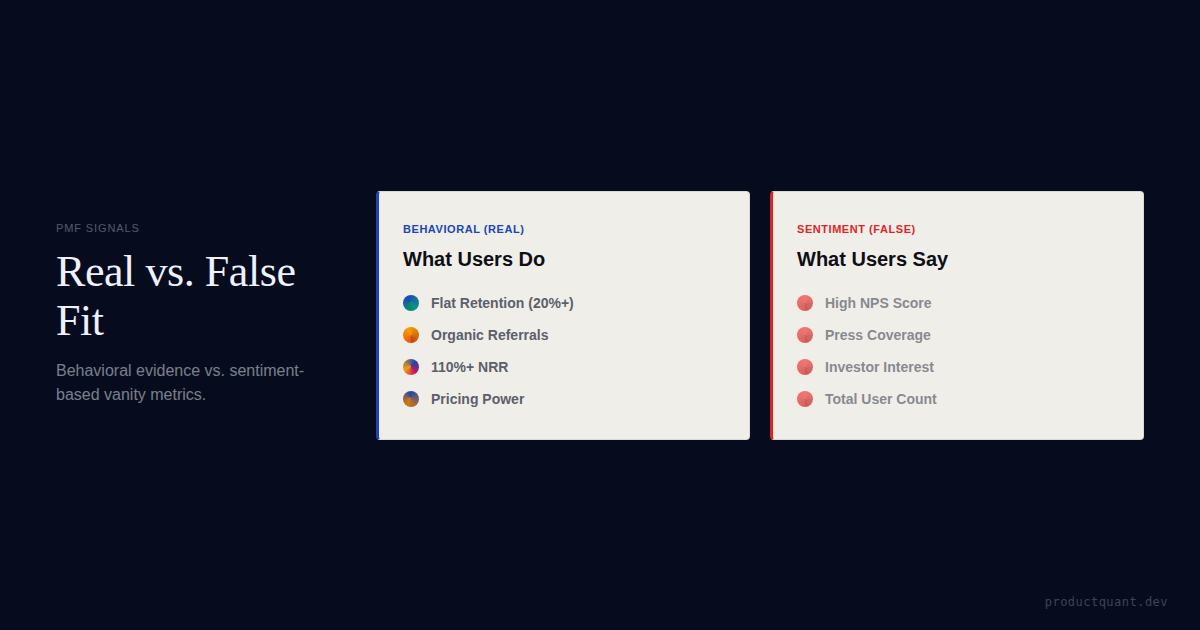
Real PMF signs are behavioral: flat retention, organic referrals, pricing power. False signs are sentiment: high NPS, press coverage, investor enthusiasm.

Running the wrong growth playbook costs 6+ months of momentum. Here are 7 signs your SaaS product

Most churn happens silently. The cancel button gets clicked weeks after the user stopped caring. By then, retention campaigns fail because the customer has
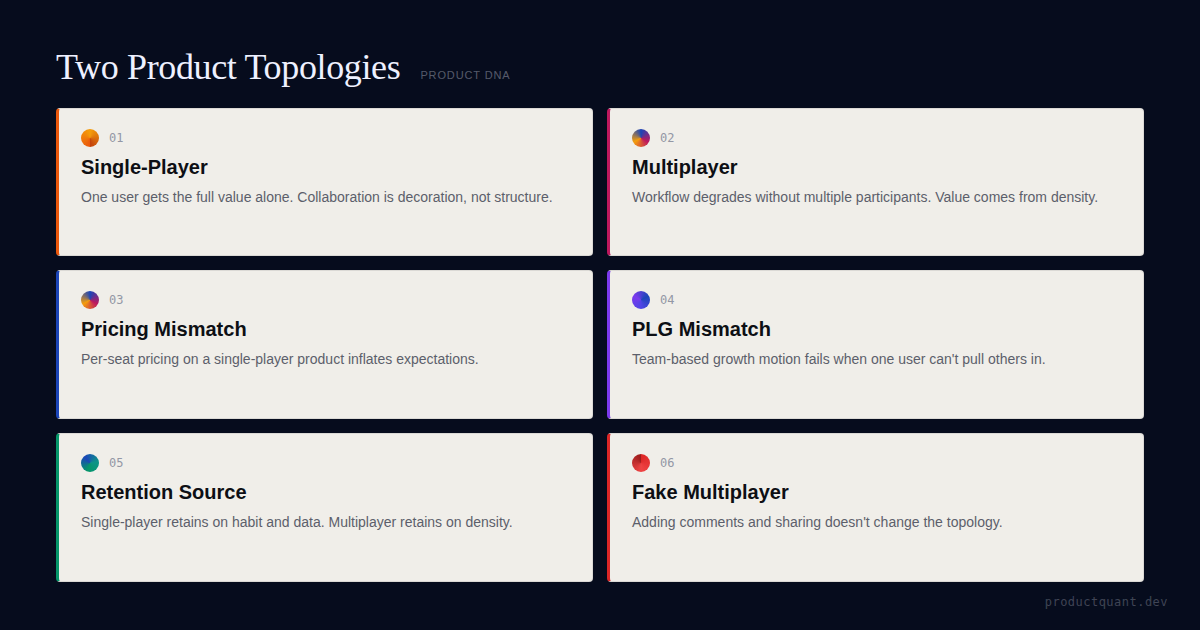
Adding collaboration features does not make a product multiplayer. Real topology shifts change activation, pricing, retention, and growth motion.
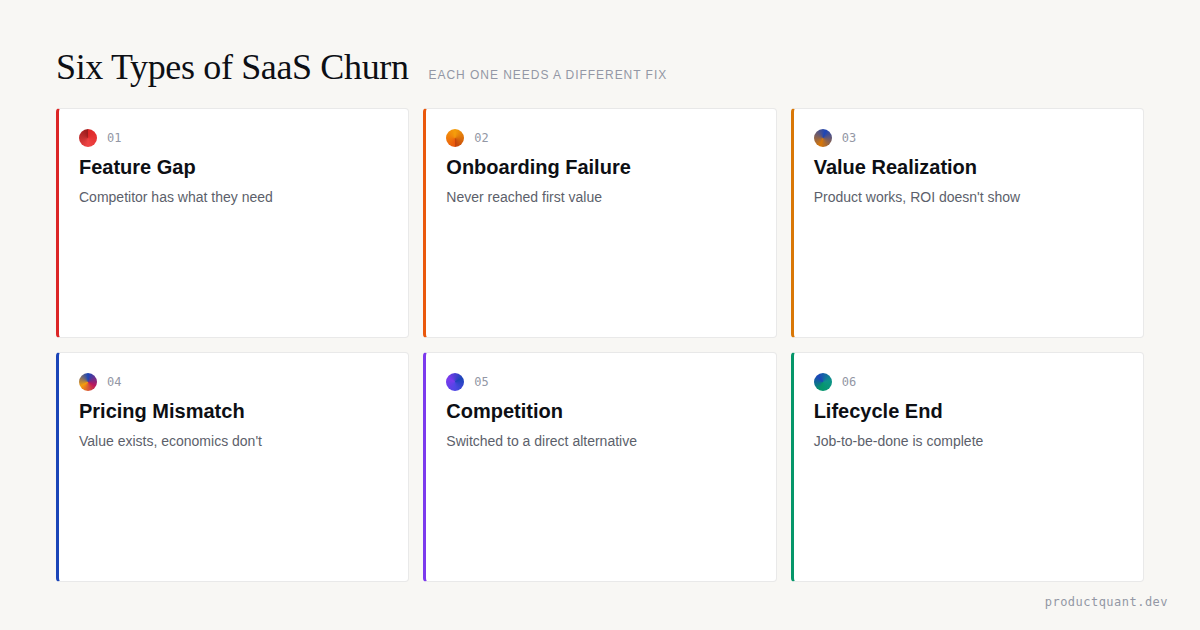
Not all churn has the same cause. Six archetypes, each with a distinct signal in your data and a different intervention. Treating them the same is why retention programs fail.
Analysis of 3,850 real pipeline data points across 14 source batches. What the ProductQuant lead signal pipeline shows about fit, priority, enrichment, and action bottlenecks.
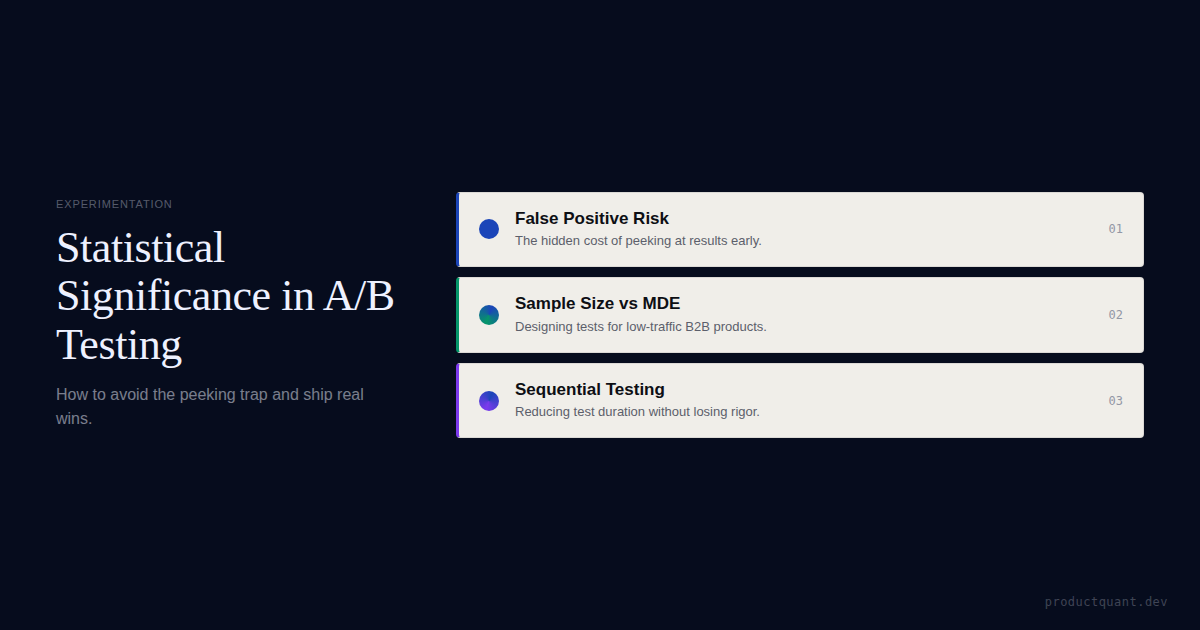
Your A/B test showing a p-value of 0.03 is not what you think it is. Most teams are using statistical significance incorrectly, and it is costing them real
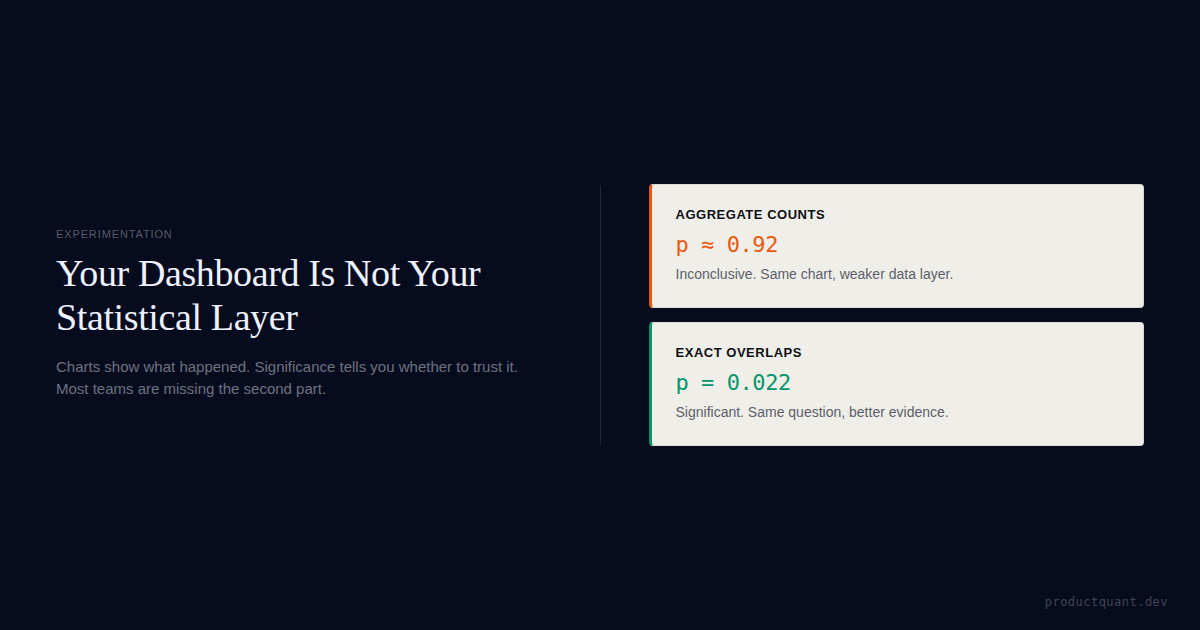
Charts are not statistical confidence. Learn when product analytics tools are enough, when exports are needed, and how to add a validation layer.

Feature factories ship constantly and grow slowly. Learn how Jobs-to-be-Done prioritization and four decision frameworks help SaaS teams build less and matter more.

Separating payment churn from behavioral churn is the difference between a number that looks bad and an action that actually improves retention. This guide
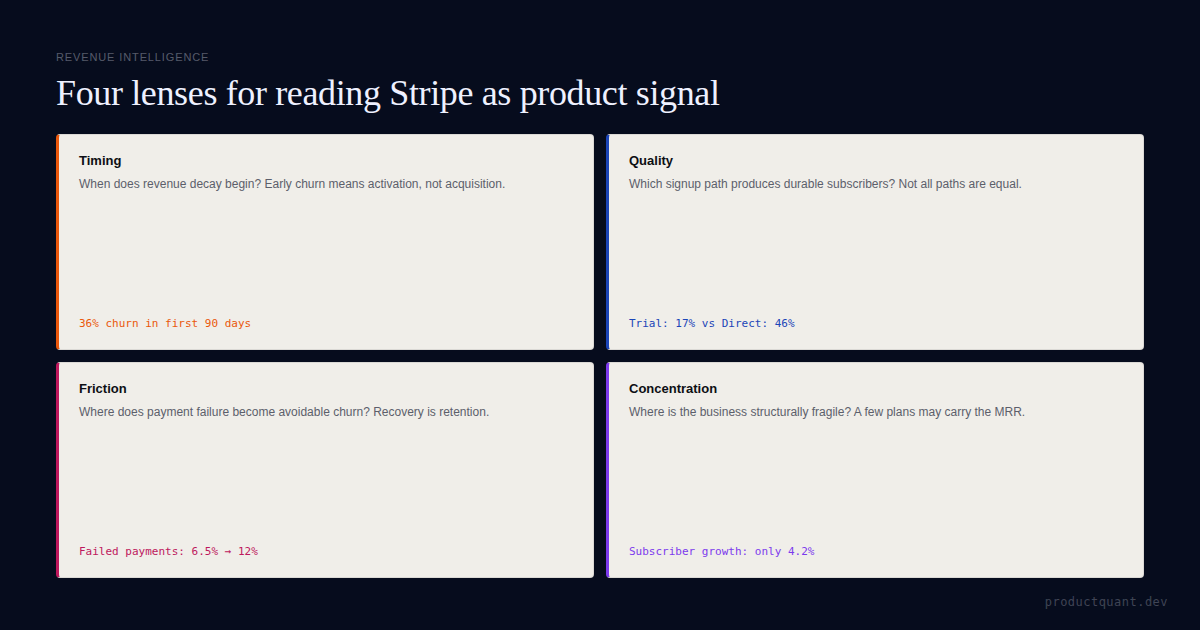
Stripe can reveal churn timing, failed-payment risk, plan-tier health, and activation problems that product analytics alone often miss.

Most B2B SaaS teams calculate TAM to impress investors. But a smaller TAM with a clear beachhead beats a huge TAM with no entry point.
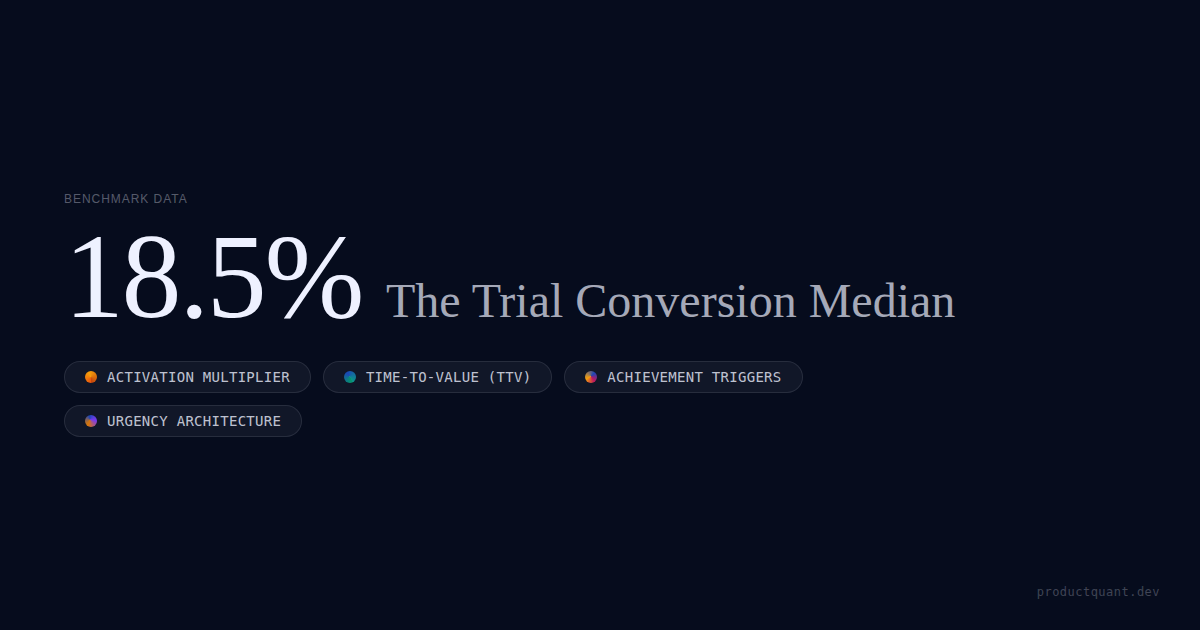
The median B2B SaaS trial converts at 18.5%. Elite products hit 60%+. The gap is not your UI — it is your instrumentation. This is the technical guide.
Most churn prediction models fail because they treat cancellation as an event. It is not. Churn is a process that begins 45 days before a customer leaves,
Most founders send the same cold email to 500 prospects and wonder why three people replied. The ones getting 15% reply rates aren
I haven
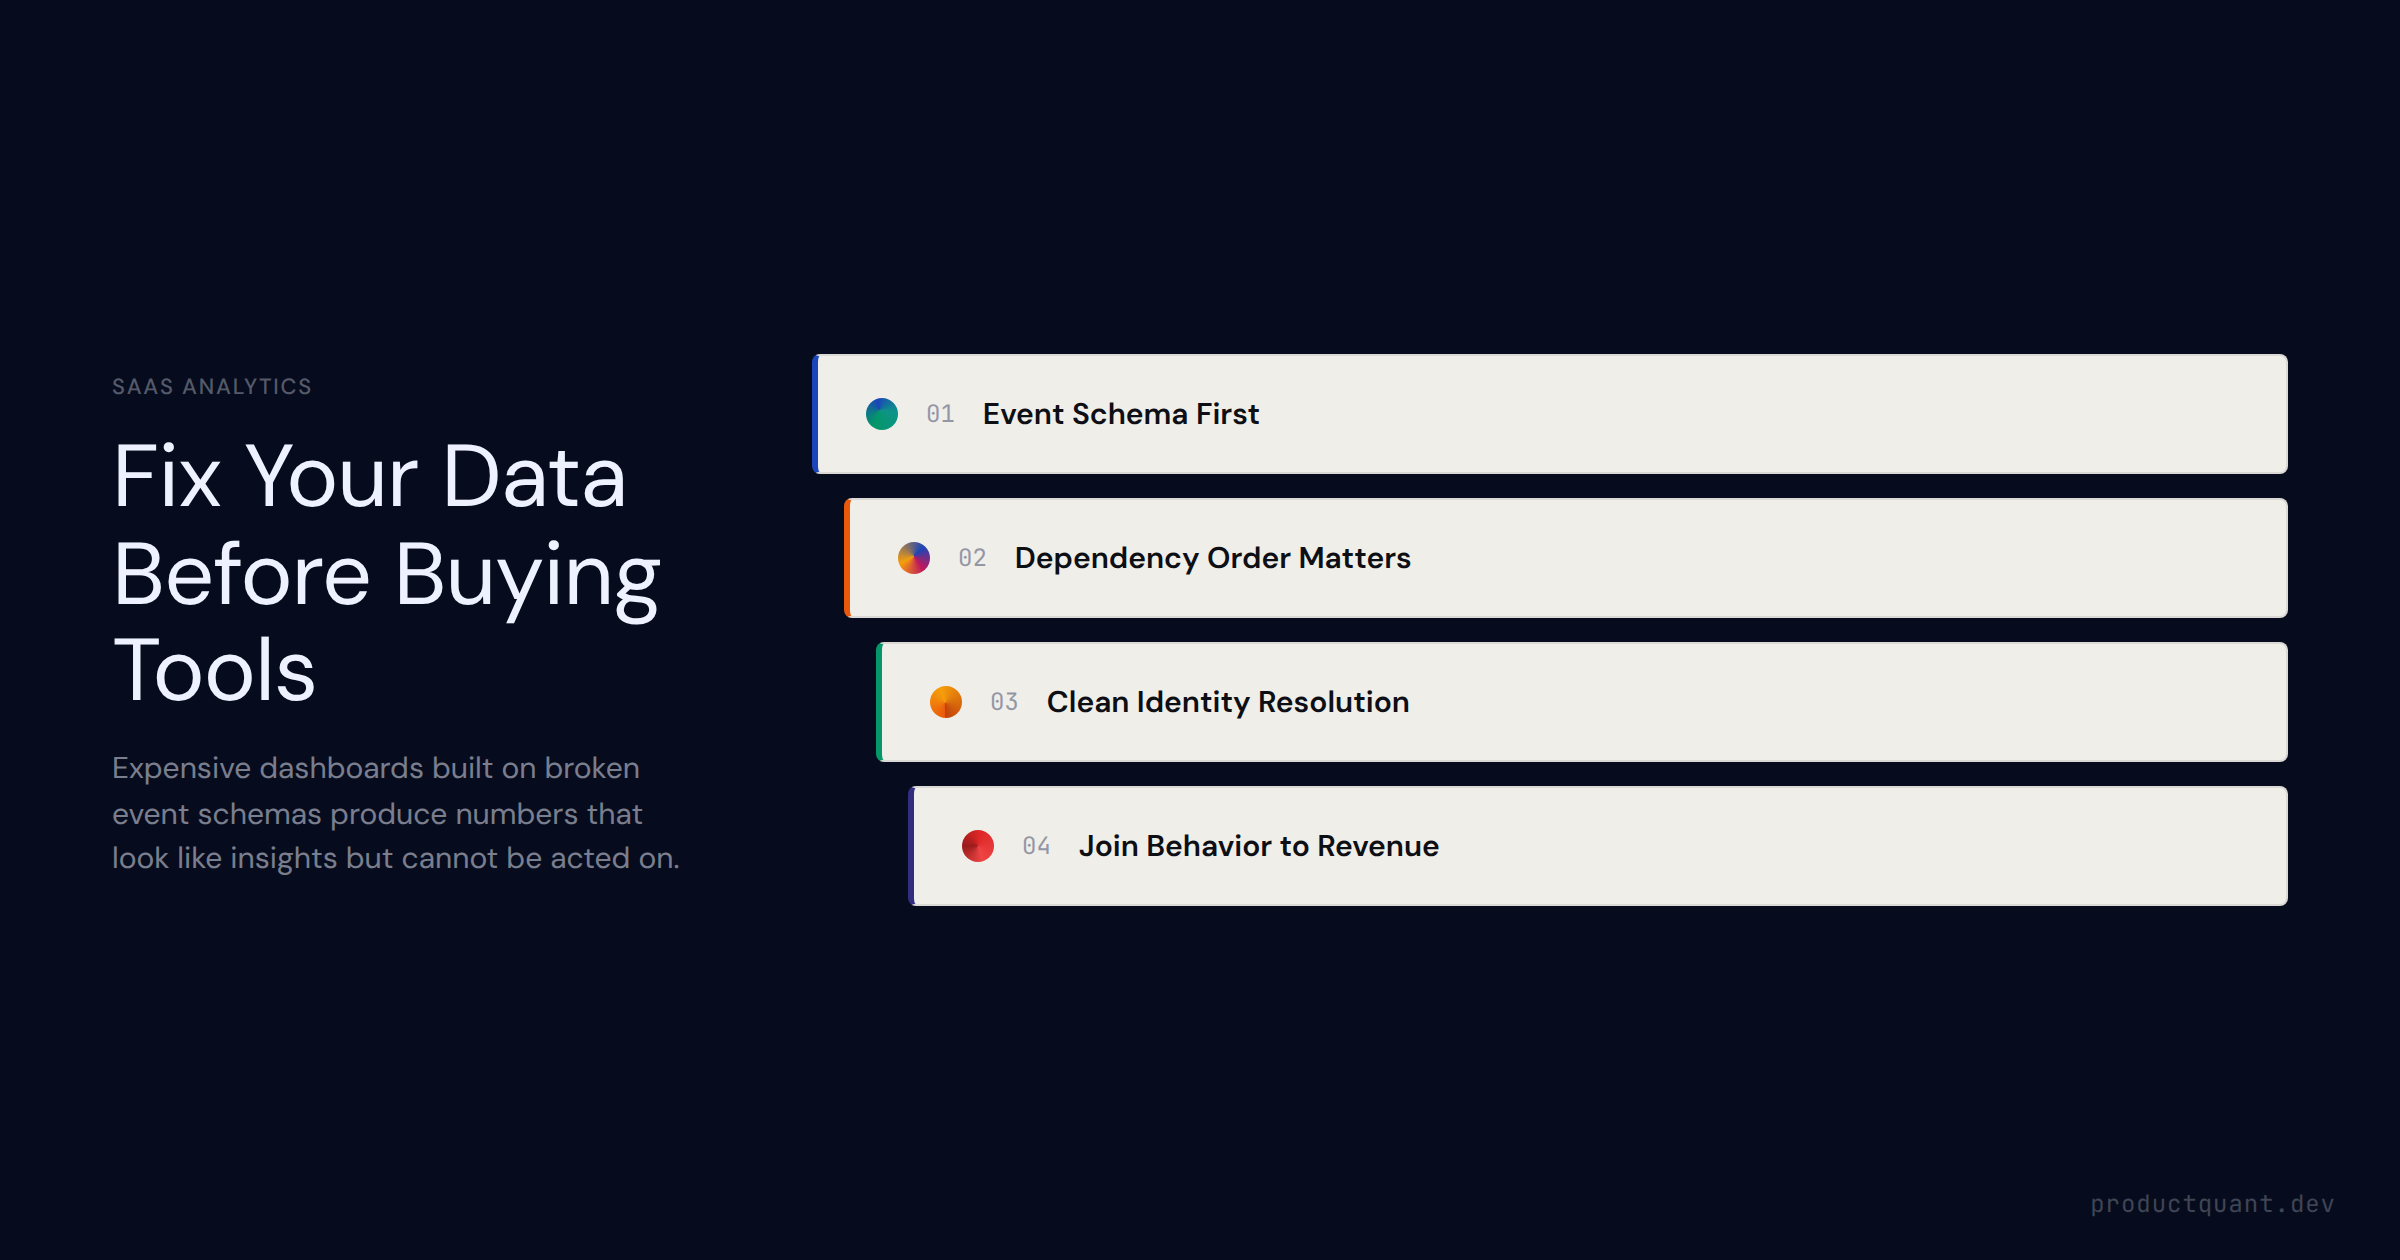
Your analytics is broken not because of the tool you chose. It is broken because your events were designed backwards. Question-first event design prevents
AI-Powered Content Marketing: A Complete Guide — ProductQuant
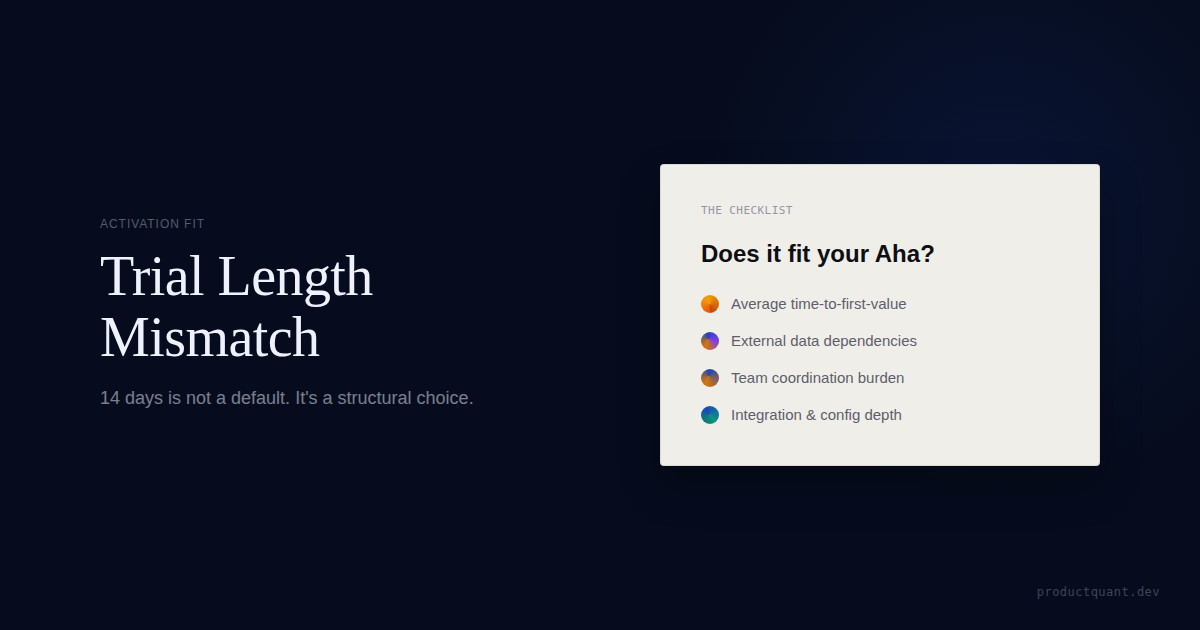
Most B2B SaaS teams copy 14-day trials from competitors with different activation patterns. Trial length should match how value actually appears.
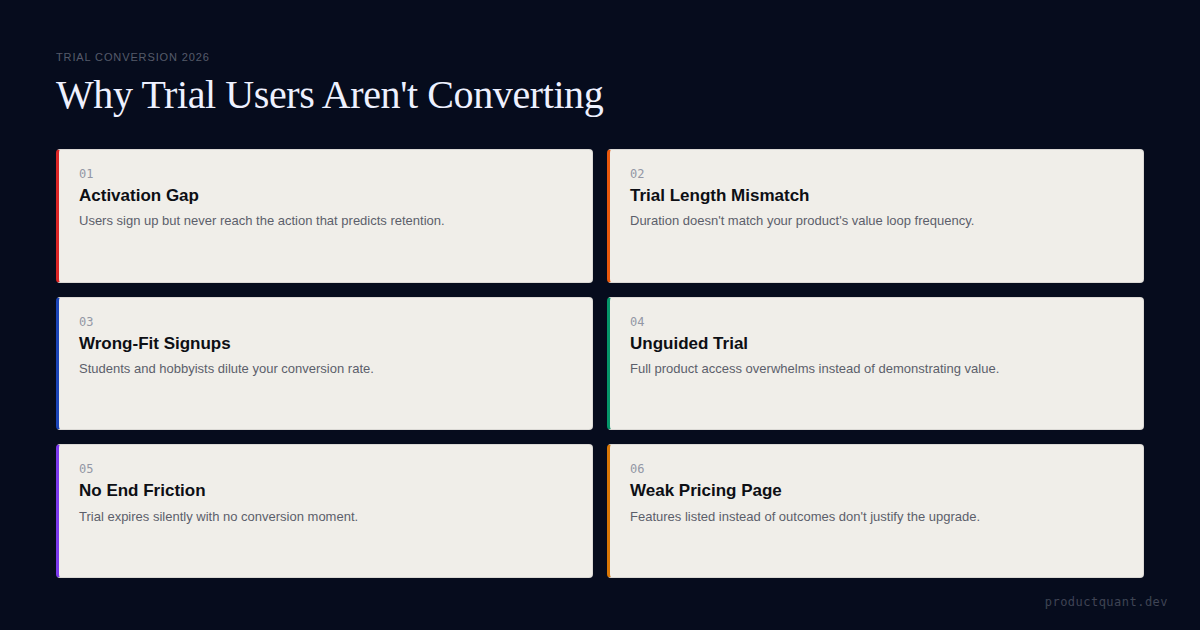
Trial users sign up but don
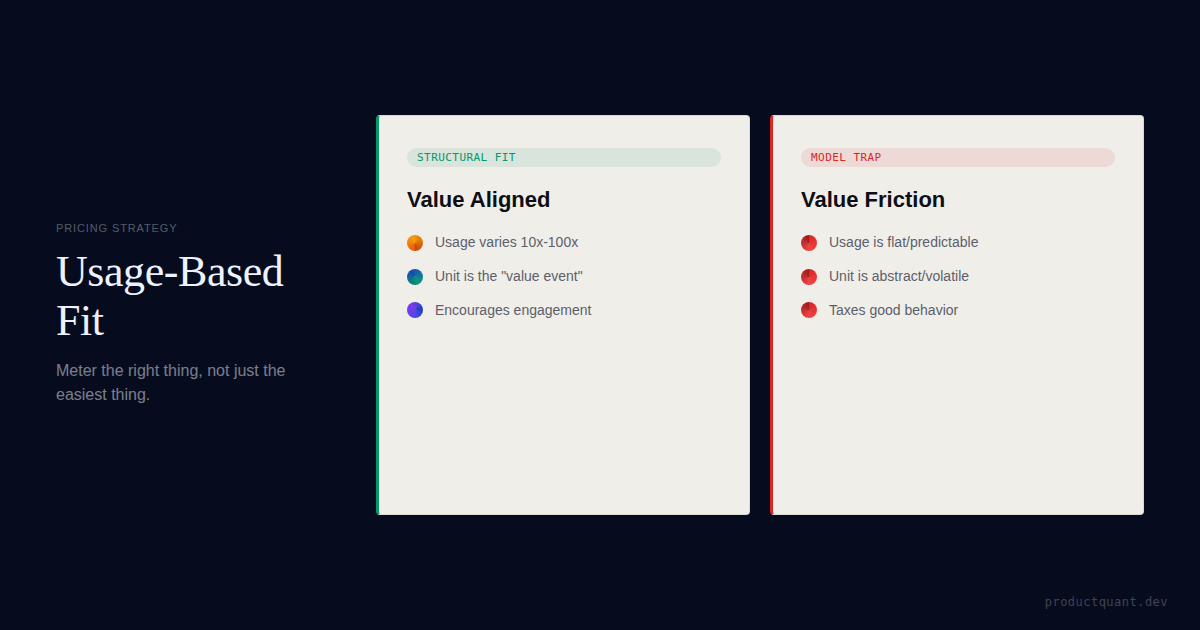
Usage-based pricing only works when consumption, value, and buyer tolerance line up. Here is the Product DNA checklist for deciding if it fits.
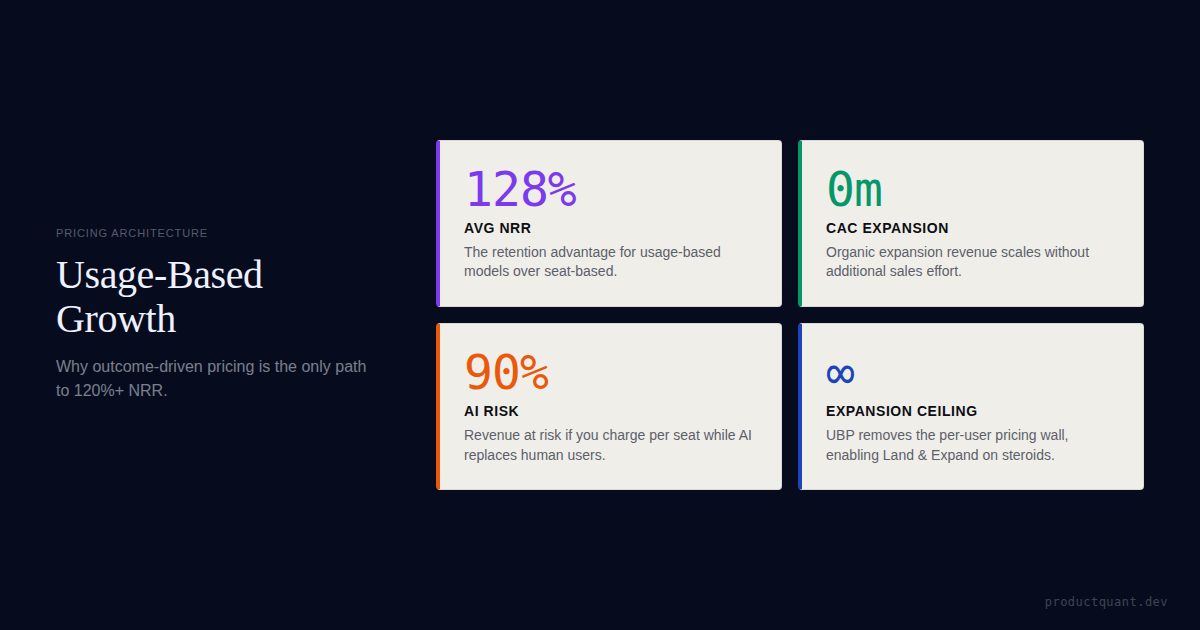
Seat-based pricing is a ceiling on your growth. Learn why usage-based models are driving the highest retention and expansion scores in B2B SaaS today.
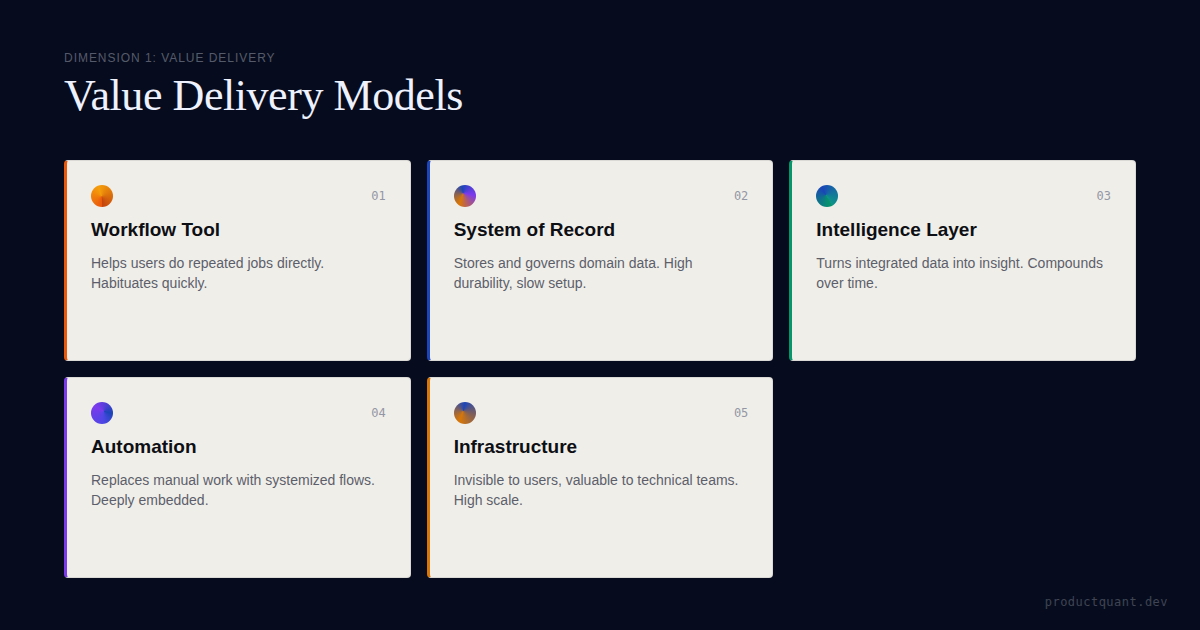
A value delivery model is the structural classification that determines how your product creates value — and constrains activation, pricing, PLG, and moat design before anything else.
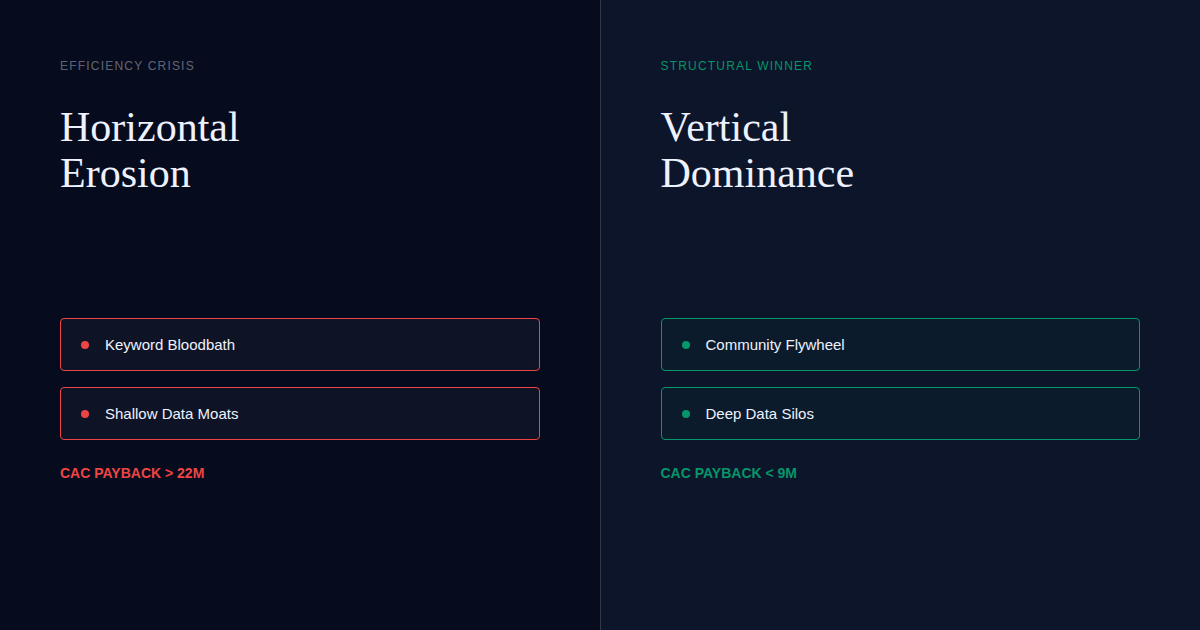
Horizontal SaaS is getting crushed by rising CAC. Learn why focusing on a specific niche is the only structural defense against the 2026 efficiency crisis.
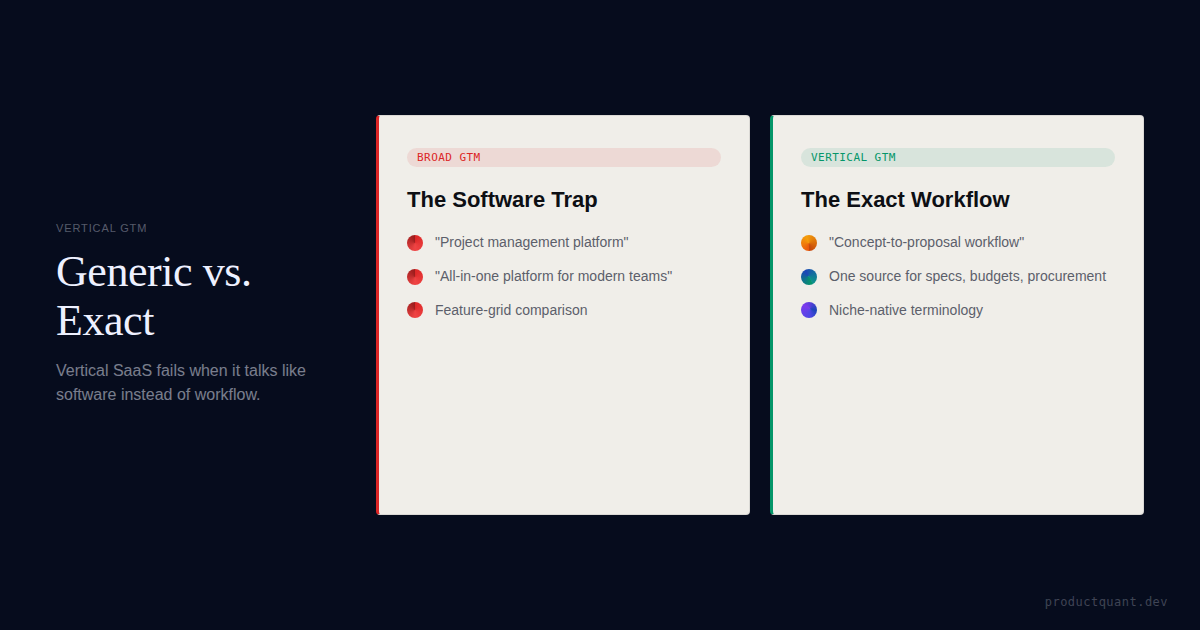
A practical GTM framework for vertical SaaS: speak the buyer
Learn the real definition of SaaS activation rate, how to calculate it, why it predicts LTV, and how to define the right activation event for your product.
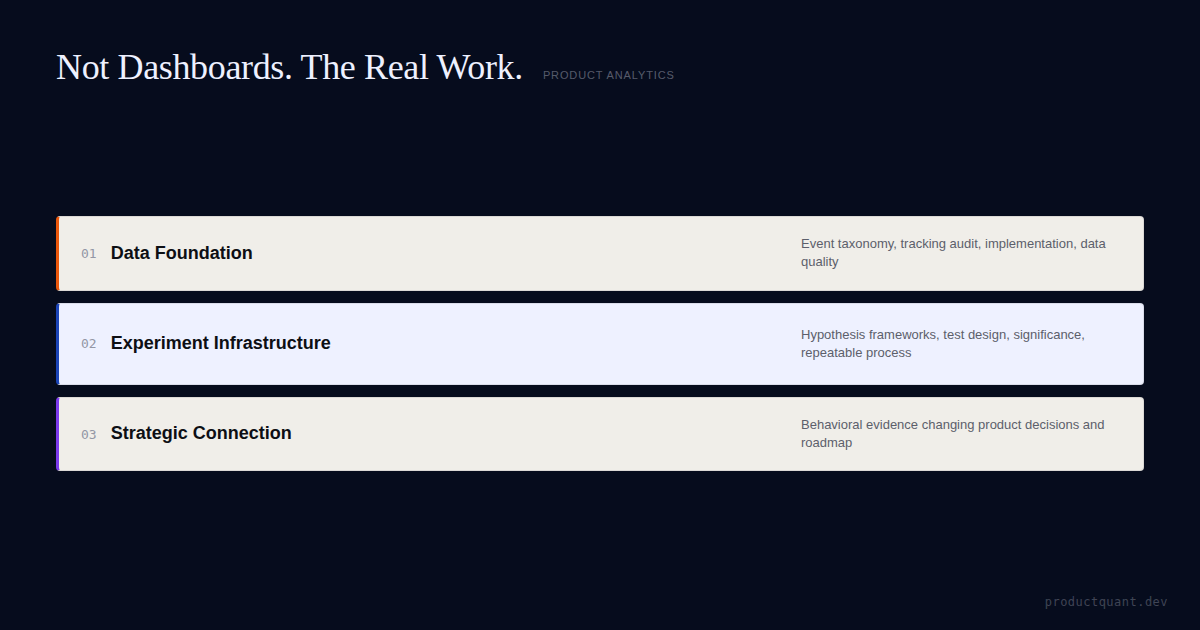
Discover what a product analytics consultant actually does — beyond dashboards. Event taxonomy, experiment design, growth systems, and when to hire vs. build in-house.
Don
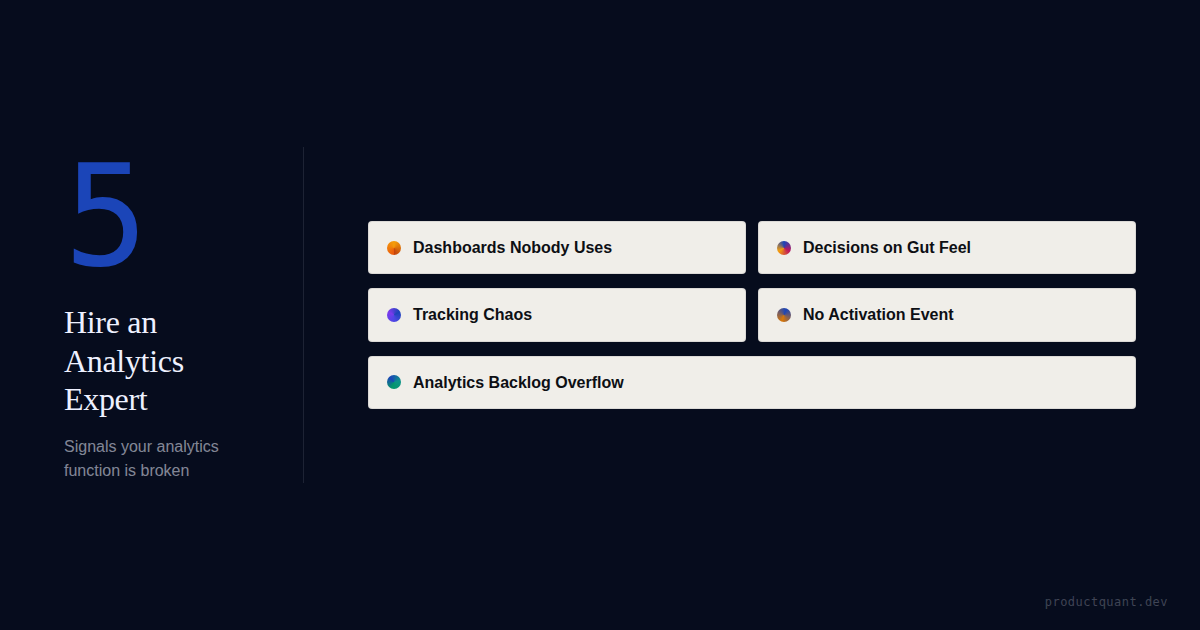
Dashboards nobody reads. Decisions made on gut feel. Tracking that nobody owns. Here
Your A/B test did not fail because of low traffic. It failed before you wrote the first line of code. The real problem is that most teams test ideas, not h
6% of users try a new AI feature. 1.2% use it weekly. This is the story of how it happens, why it keeps happening, and the framework to stop building AI features nobody uses.
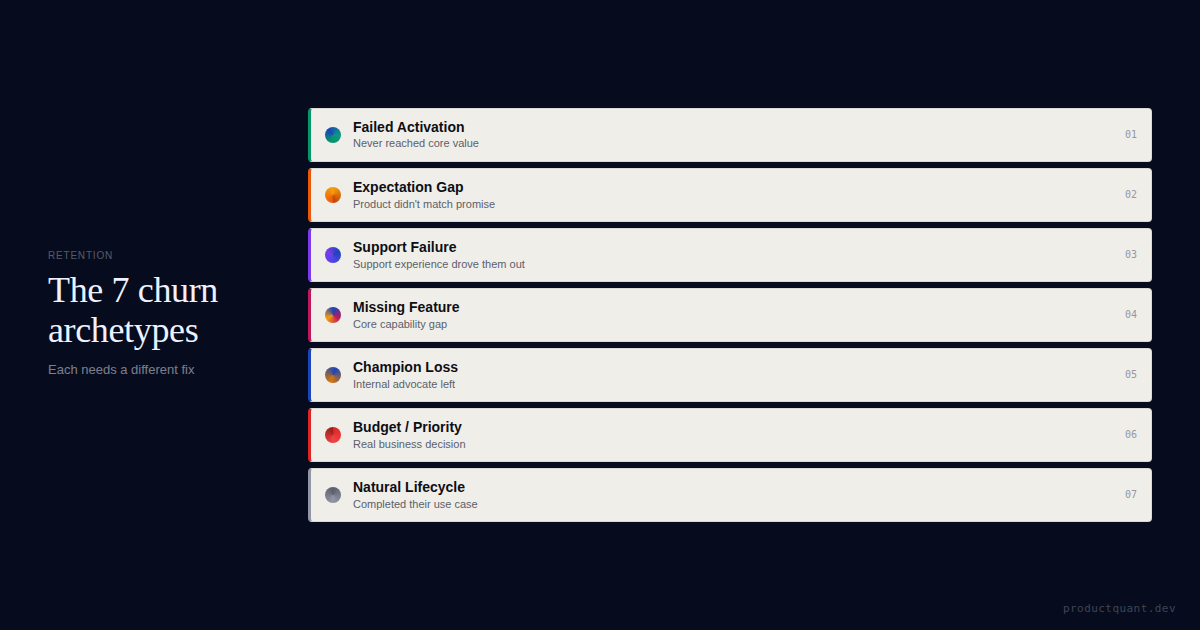
Churn is not one problem. It is a composite of 7 structurally different failure modes. Here is how to diagnose which archetypes are actually driving your number.
Only 13% of SaaS companies ever reach $10M ARR. The gap between $1M and $5M is where most stop. Here are the 5 structural root causes — and how to diagnose which one is blocking you.
Sales teams still spend hours on manual prospecting research despite a market full of tools. Here is why the tools are not solving the real problem and what structural shift changes it.
Most SaaS teams define activation as first login. That
Most teams aim battle cards at the wrong target. This article shows how to find your actual competitor from lost-deal data and product structure.
Support tickets are one of the clearest product datasets most B2B SaaS teams underuse. Turn Zendesk conversations into product signals that guide your roadmap with confidence and reduce churn.
We connect activation, monetization, and expansion into one compounding system — run inside your product.
Book a Discovery Call