
TL;DR
- Churn risk typically shows up 60-90 days before cancellation. The signal is behavioral, not verbal — usage drops, champion goes quiet, tickets spike.
- Tier the response by ARR, not just risk score. SMB accounts get automated sequences. Enterprise gets a human within 24 hours of a single Amber trigger.
- Match the intervention to the churn driver. Activation failure, value mismatch, and price pressure each require a different conversation. Generic "checking in" emails work for none of them.
- Speed matters more than polish at the Red tier. An imperfect call on day one beats a templated email on day five.
- Track save rate by driver, not just by tier. The blended number hides where your playbook is actually working and where it is not.
Most churn conversations happen too late. A customer clicks "cancel" or a renewal comes up and the team scrambles — executive escalation, discount offers, emergency calls. Sometimes it works. More often, the account was already decided weeks earlier, and what follows is theater.
The structural problem is not that CS teams are slow. It is that most teams are watching the wrong signals. They monitor NPS scores, renewal dates, and support ticket closures. They are not watching the behavioral indicators that show up 60 to 90 days before a customer even starts thinking about leaving.
"If you are first learning about churn risk when the cancellation email arrives, your intervention system is not a system — it is damage control."
— Jake McMahon, ProductQuant
This playbook covers the full structure: the trigger thresholds that should activate a workflow, how to tier the response by ARR, what the actual outreach should say depending on why the customer is at risk, and how to measure whether any of it is working. The goal is not to rescue every at-risk account — that is not realistic. The goal is to run the right intervention at the right time for the right reason, so the accounts you can save actually get saved.
The Triggers That Should Fire an Intervention

The challenge with trigger design is avoiding two failure modes: triggers that fire too early produce noise and burn CS capacity on accounts that were never genuinely at risk. Triggers that fire too late mean the conversation happens after the customer has mentally moved on.
The most reliable approach is to measure each account against its own baseline rather than a platform average.
A customer who typically logs in 12 times per week and drops to 6 is showing a materially different signal than a customer who typically logs in twice per week and drops to one. Both show a 50% decline. Only the first is alarming.
Early-stage signals (30-60 days before likely churn)
These signals appear well before the customer has made a conscious decision to leave. The window between these signals appearing and actual cancellation is your intervention opportunity. The key is to detect them against the account's own baseline, not a platform average:
- Login frequency drops 50% or more versus the account's own trailing 30-day average — not versus a global benchmark.
- Feature adoption stalls below the product's minimum viable adoption threshold. For most B2B tools this is 3 or fewer core features used after day 30 of onboarding.
- Session duration declines 40% or more. Customers who stay logged in longer are extracting value. Shorter sessions often mean they are completing minimal required tasks without exploring.
- Core workflow abandonment. A customer who starts but does not complete a critical workflow — importing data, setting up an integration, running a report — is signalling that the product is not yet part of their operating loop.
Mid-stage signals (14-30 days before likely churn)
At this stage, the customer has begun to disengage relationally. The product may still be used minimally, but the emotional and operational commitment is fading. Look for these patterns:
- Email disengagement: last 5 product emails unopened. This is a weak signal in isolation but meaningful combined with usage decline.
- Champion dark: no login from the primary user for 21 or more days. In B2B accounts, the champion going dark is often the earliest relational signal of disengagement.
- Support ticket spike: 3x the account's normal volume in a 14-day window. Note the direction matters — a spike in resolved tickets is neutral. A spike in open or escalated tickets is a warning.
- Missed 2+ scheduled check-ins or QBRs. Avoidance is a signal, not scheduling friction.
Late-stage signals (0-14 days before likely churn)
These signals indicate the customer is actively preparing to leave. The intervention window is narrow and the save rate is lower. Escalate to Red status immediately:
- Bulk data export requested. Not always a churn signal — some customers export for reporting — but combined with any usage decline it should escalate immediately.
- Plan downgrade or seat reduction in the previous 60 days.
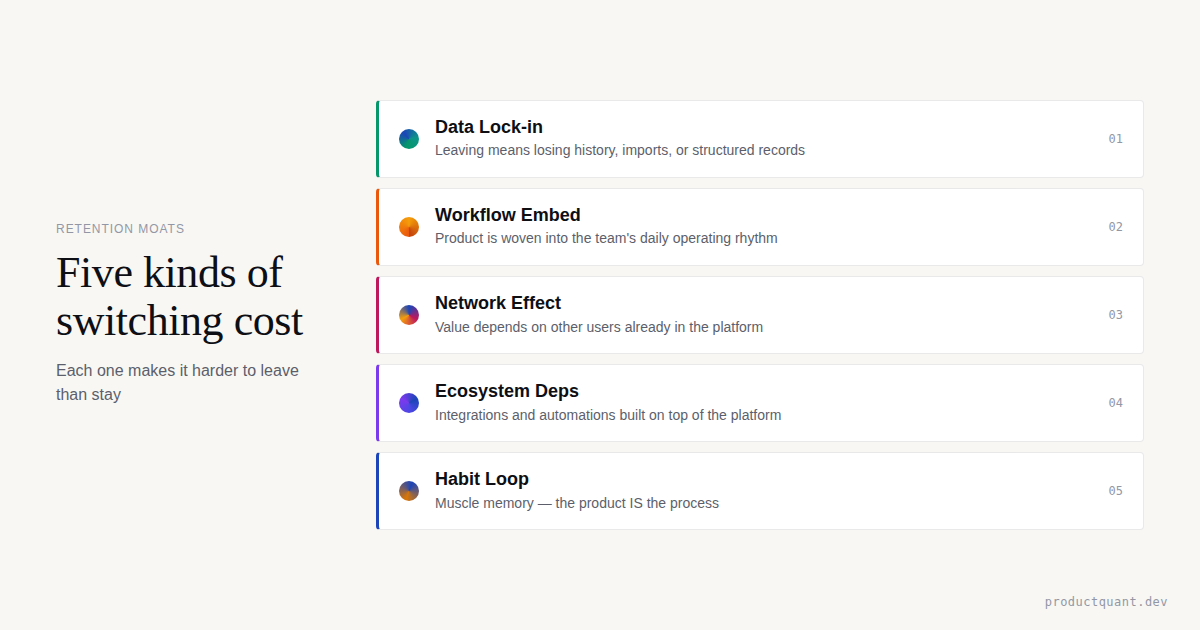
- Integration removal (disconnected Salesforce, Slack, or similar). This is a structural signal — the customer is unwinding operational dependencies, which usually precedes switching.
- Failed payment or invoice dispute. May be administrative, but at-risk accounts often deprioritise administrative tasks around the product they are planning to leave.
Research from Paddle/ProfitWell's Retention data (2025) across a large SaaS sample shows that product usage typically drops roughly 40% in the 90 days before cancellation — and that the majority of annual churn tends to originate in the first 90 days of the customer lifecycle, when onboarding gaps compound into disengagement. Both patterns point to the same conclusion: the intervention that matters most is not the one you run the week before renewal.
How to set status thresholds
A practical starting point:
- A single early-stage signal → Amber status
- Two concurrent signals, or any single late-stage signal → Red status
Amber gets a workflow. Red gets a human.
Enterprise accounts over a defined ARR threshold — typically $25K to $50K depending on your book — should have a lower Amber threshold. The cost of misclassifying an enterprise account is substantially higher.
Need a churn prediction system, not just a playbook?
The trigger design problem is easier to solve when you have a structured view of which signals actually correlate with churn in your specific product. The Churn Prediction work is built to surface that, account by account.
CS Workflow Tiers: What Happens After a Trigger Fires

The most common failure in CS intervention design is a flat playbook: every at-risk account gets the same email sequence regardless of ARR, regardless of how far along the risk signal is, and regardless of why they are at risk. That approach has a low ceiling because the right response to an SMB account two weeks into a trial that has not activated is completely different from the right response to a $100K ARR enterprise account where the champion has gone dark three weeks before renewal.
Tier the workflow. The ARR threshold and the risk signal together should determine who responds, how quickly, and what the first message contains.
Amber-tier workflow (moderate risk, typically SMB and mid-market)
Amber workflows are automated-first, with a single human touchpoint designed to escalate to Red if there is no engagement after 21 days.
- Day 1 — Targeted automated email. Not "we noticed you haven't been around" — something specific to the account's actual usage gap. If they have not used a feature they set up during onboarding, the email references that feature and links to a relevant resource or case example. The goal is to surface concrete value, not request a meeting.
- Day 7 — Personal CSM email. Short. Acknowledges the gap without being accusatory. Offers a specific 20-minute call tied to their use case, not a generic check-in. "Wanted to see if the [specific workflow] is doing what you need it to" outperforms "just checking in" materially.
- Day 14 — In-app message or product nudge. For products where this is available, a contextual in-app prompt tied to a feature or workflow the account has not tried performs better than a third email.
- Day 21 — Evaluate and escalate or close. If there has been no engagement at all across email and product, escalate to Red. If there has been partial engagement, extend the Amber workflow by 14 days with a revised message.
Red-tier workflow (critical risk, any segment)
Red workflows are human-first. Automation has already had its chance, or the signal is severe enough that automation is the wrong tool from the start.
- Day 1 — Personal CSM outreach within 24 hours. Phone or video call preferred over email for accounts above $15K ARR. The first call is diagnostic, not persuasive. The goal is to understand what is actually happening, not to pitch value. Questions like "when did this start feeling like it was not working?" are more productive than "let me walk you through what you have been missing."
- Day 3 — Follow-up if no response. A second personal outreach — different channel if the first was email. For accounts above $25K ARR, consider a phone call. Keep it short and acknowledge their time.
- Day 7 — Escalate to AE or VP. If the CSM has not made contact by day 7, a senior voice changes the signal the account receives. This is not about pressure — it is about demonstrating that the account matters at a different level of the organisation.
- Day 14 — Final structured outreach. A brief exit interview offer framed as "we want to understand what we could have done differently" rather than "please don't leave." Accounts that do churn after a well-run Red-tier workflow often provide the most useful product feedback the team will receive.
Enterprise workflow (accounts above $50K ARR)
Enterprise accounts skip the automated queue entirely. The threshold for human involvement is lower — any Amber trigger should produce a personal call within 48 hours, not the start of an email sequence.
- Day 1 — CSM phone call within 24 hours. Not email. Enterprise champions are typically senior enough that a cold email from a CSM reads as low-priority. A call, even if it goes to voicemail, signals different urgency.
- Day 3 — Escalation to VP Customer Success if no response. Enterprise accounts typically have relationship layers. The VP reaching out opens a different conversation than the CSM.
- Day 7 — CEO or founder outreach for accounts that represent greater than 5% of ARR or are strategically important. This should be a brief, direct note — not a sales pitch. "I wanted to make sure we are solving the right problem for your team" is the right frame.
- Day 14 — Executive business review scheduled, even if the account is likely churning. The EBR is partly a retention tool and partly a structured way to understand the failure clearly enough to prevent the next one.
| Tier | ARR range (estimated) | First touchpoint | Who leads | Escalation trigger |
|---|---|---|---|---|
| Amber — SMB | Under $15K | Automated email, day 1 | Sequence, then CSM | No engagement after 21 days |
| Amber — Mid-market | $15K–$50K | CSM email, day 1 | CSM | No response after 7 days |
| Red — Any segment | Any | CSM call or email, within 24h | CSM + AE | No contact after 7 days → VP |
| Enterprise | Over $50K | CSM call within 24h | CSM → VP → CEO | Any Amber signal triggers immediate call |
What the Intervention Should Actually Say
The message matters as much as the timing. Most intervention outreach fails not because it arrived too late but because it addressed the wrong problem — or no specific problem at all.
The churn driver determines the message. There are three primary drivers in B2B SaaS, and each requires a different conversation.
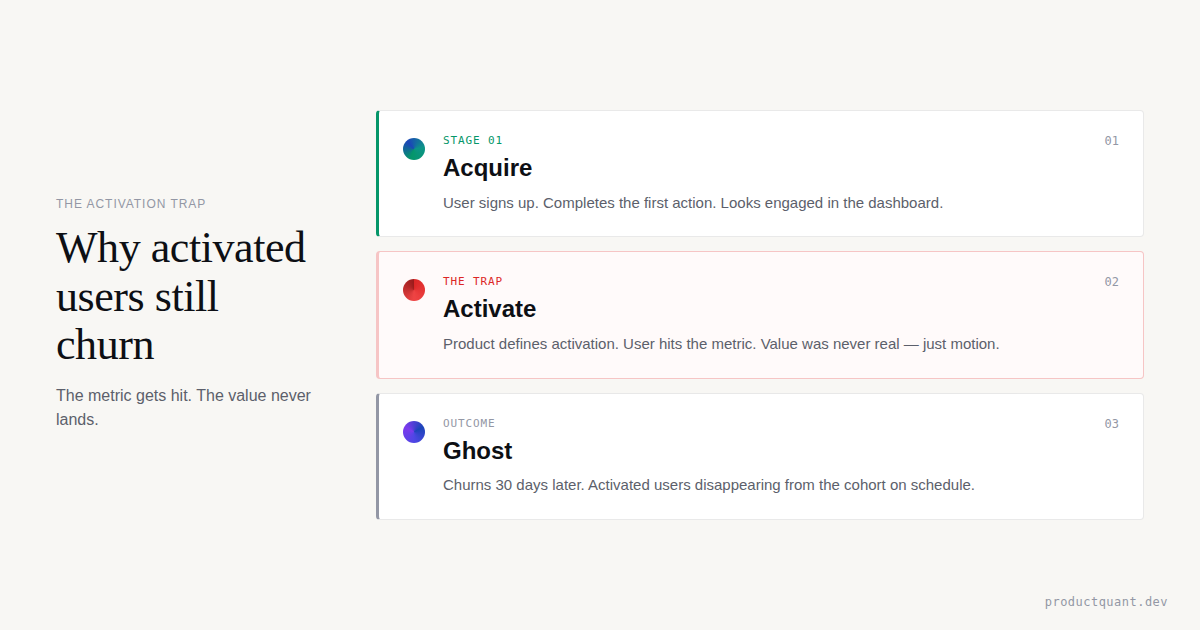
Activation failure: the customer never reached sustained value
This is typically the most common driver, and it is the most mishandled. CS teams often respond to activation failure with more product education — tutorials, webinars, feature walkthroughs. That is the wrong instinct. A customer who has not activated has not failed to understand the product. They have failed to connect the product to a specific problem that matters enough to change their workflow for.
The intervention here is a reset conversation, not a training session. The question to ask: "What were you hoping this would solve for you in the first 90 days?" The answer reframes the conversation around their actual job-to-be-done, which often turns out to be slightly different from what the product was positioned to address at the point of sale.
Effective message frame: "I want to understand what you were hoping to get done with [product] in the first few months. I think we may have started you on the wrong part of the product for your actual use case, and I'd like to fix that."
Value mismatch: the customer knows the product but doubts the ROI
This is the driver most often misdiagnosed as price pressure. The customer is not saying "this is too expensive." They are saying "I am not confident this is worth what it costs." The distinction matters because the intervention is completely different.
For value mismatch, the goal is to make the value concrete and personal — not to offer a discount and not to repeat general claims about the product. If the product has usage data, surface it. "Your team has run X reports in the last quarter" or "here is the time estimate for the workflows you have automated" changes the conversation from abstract ROI claims to evidence the customer can assess for themselves.
If the product does not yet have strong usage-to-value reporting, this is worth building. It is one of the highest-leverage investments a CS team can make in retention infrastructure.
Price pressure: the ROI is clear but the contract is under budget scrutiny
Price pressure is the driver where discounts are most defensible — but even here, discounting before demonstrating value is the wrong sequence. The correct order is: surface the ROI evidence first, then, if the customer still needs a pricing adjustment to make the renewal work, offer a structured option that aligns cost to value more explicitly.
Structured options that typically perform better than straight discounts: an annual contract at a lower monthly equivalent, a tier reduction with a defined path back to full tier tied to adoption milestones, or a usage-based arrangement where cost scales with the value the customer is extracting.
Three message patterns that reliably reduce save rates: "We miss you" (signals desperation, not partnership), "Is there anything we can do?" (puts the diagnosis burden on the customer), and a discount offer as the first message (tells the customer the price was negotiable all along, and often converts genuine retention conversations into negotiation conversations).
If churn analysis, renewal risk, and competitive pressure are getting conflated, start with the signal system.
The Churn Prediction work builds the behavioral model and surfacing layer so your CS team works from actual risk signals rather than gut feel and renewal date proximity.
How to Measure Whether the Playbook Is Working
Intervention playbooks fail silently when teams track only the headline save rate without understanding what is driving it.
A 40% blended save rate might mean the Amber workflow is working well and the Red workflow is broken — or vice versa.
The measurement structure needs to separate the signal from the noise.
Primary metrics
These three metrics tell you whether the playbook is actually moving the needle. Track them separately by tier and by churn driver — a blended save rate masks which parts of the system are working and which are broken:
- Save rate by tier. Track Amber and Red separately. If Red-tier save rate falls below 20%, the trigger thresholds may be set too high — accounts are entering Red too late. A target range for a functional Red-tier workflow is typically 35-50%.
- Save rate by churn driver. Split saves by activation failure, value mismatch, and price pressure. If one driver has a materially lower save rate than the others, the intervention content for that driver needs to be redesigned, not the overall workflow.
- Time-to-first-contact. Measure the gap between trigger detection and first outreach. Every day of delay at the Red tier reduces the probability of a successful intervention. A target of under 24 hours for Red-tier accounts is achievable with proper alerting infrastructure.
Secondary metrics
These metrics diagnose why the primary metrics look the way they do. If your save rate is low, the secondary metrics tell you whether the problem is message content, trigger timing, or post-save health:
- Response rate to outreach. A response rate below 20% typically indicates the message content is too generic or the trigger is firing too late. Target range is typically 25-40% for a well-designed sequence.
- Time-to-Amber and Time-to-Red distribution. Track how far into the customer lifecycle accounts are when they first hit Amber and Red status. If most Red-tier accounts are long-tenured customers, that points to a different structural problem than if most are within the first 90 days of onboarding.
- Post-save health trajectory. Accounts that are saved but decline again within 60 days were not genuinely saved — the intervention addressed a surface symptom rather than the underlying driver. Track 60-day post-save status alongside the initial save rate.
Review cadence
The playbook only works if the data is reviewed at the right frequency. Each review serves a different purpose:
- Weekly: All active Red-tier accounts, intervention status, and escalation needs. This is a CS lead review, not a full team meeting.
- Monthly: Save rate by tier and by driver. Identify which intervention content is converting and which is not.
- Quarterly: Trigger calibration. Are Amber thresholds producing accounts that actually convert to Red? Are there signals that should be in the trigger set but are not? Refine based on actual churn outcomes from the previous quarter.
| Metric | What it measures | Estimated healthy range | Warning sign |
|---|---|---|---|
| Red-tier save rate | % of Red accounts returned to Green within 30 days | 35–50% | Below 20%: triggers firing too late |
| Time-to-first-contact (Red) | Hours from trigger to first outreach | Under 24 hours | Over 72 hours: alerting or capacity issue |
| Response rate to outreach | % of at-risk accounts that reply or engage | 25–40% | Below 20%: message content or timing problem |
| 60-day post-save retention | % of saved accounts still active 60 days later | 70%+ | Below 60%: root cause not addressed |
FAQ
What triggers should fire a churn intervention?
The three most reliable early triggers are:
- A login frequency drop of 50% or more versus the account's own baseline (not a platform average)
- The champion going dark for 21 or more days
- A support ticket spike of 3x normal volume in a 14-day window
For late-stage signals: bulk data export, plan downgrade, or payment dispute.
Any single trigger should move an account to Amber status. Two concurrent triggers, or any late-stage signal alone, should escalate to Red.
How quickly should CS teams respond to a risk signal?
Response timing varies by tier. For Amber-tier accounts, the first automated touchpoint should go within 24 hours of trigger detection. For Red-tier accounts, a human CSM should reach out within 24 hours. For enterprise accounts over $50K ARR, the threshold for human outreach is lower — a single Amber signal should trigger a personal call, not an automated email. Speed matters more than message quality at the Red tier. An imperfect call on day one beats a polished email on day five.
What save rate should B2B SaaS teams target?
A well-functioning intervention system typically recovers 35-50% of flagged Red-tier accounts within 30 days. Below 20% usually means interventions are firing too late, the churn reason is being misread, or the ARR threshold for Red-tier classification is set too high. Above 60% may indicate triggers are too sensitive and the team is working accounts that were never at genuine risk. Tracking save rate by churn driver tells you more than the blended number — if activation failure saves are low but price pressure saves are high, the content design needs work, not the workflow.
What is the difference between Amber and Red workflows?
Amber workflows are automated-first: a sequence of targeted emails, in-app messages, and a single CSM touchpoint over 21-30 days. Red workflows are human-first: personal CSM outreach within 24 hours, phone escalation by day 3 if no response, and AE or VP involvement by day 7. The structural difference is not just urgency — it is also that Red-tier interventions require a diagnosis conversation before any solution is offered, while Amber touchpoints can lead with content and value reminders.
Should we offer discounts to save at-risk accounts?
Only after the churn driver is confirmed. Discounts are appropriate when the driver is price pressure or ROI ambiguity, and only after value has been demonstrated. Offering a discount to an account churning due to activation failure does not fix the underlying problem — it delays the churn by one cycle, often at a worse margin. If you do offer a discount, pair it with a specific commitment: a success plan, a milestone, or a defined outcome the account will reach within 60 days.
Sources
- PipelineRoad: SaaS Churn Rate Benchmarks — What's Normal in 2026
- Prospeo: Reducing Churn in SaaS — 2026 Benchmarks and Playbook
- Churnbuster: Full Guide to B2B SaaS Churn Rate Management in 2026
- Baremetrics: The Ultimate Guide to Dunning Management
Free tool: Calculate the gap between logo and revenue retention → Logo vs Revenue Retention Calculator

About the Author
Jake McMahon works on the structural layer underneath B2B SaaS retention — the systems, signals, and workflows that determine whether CS teams find out about churn risk in time to do anything about it. This article draws on the framework used in the ProductQuant Churn Prediction work, which builds behavioral scoring and intervention infrastructure for product and CS teams.
This article is part of the Customer Success series, which focuses on the operational side of retention: how signals get built, how workflows get designed, and how teams measure whether any of it is actually working.
Related Reading
Build the intervention system before the cancellation email arrives.
Churn prediction is the foundation. If the signal system is not in place, even the best-designed CS workflow fires too late. Start with the behavioral model, then layer the workflows on top.