
TL;DR
- The right first experiment is rarely a homepage headline test. For B2B SaaS, it is almost always an activation, discovery, or first-value-path test.
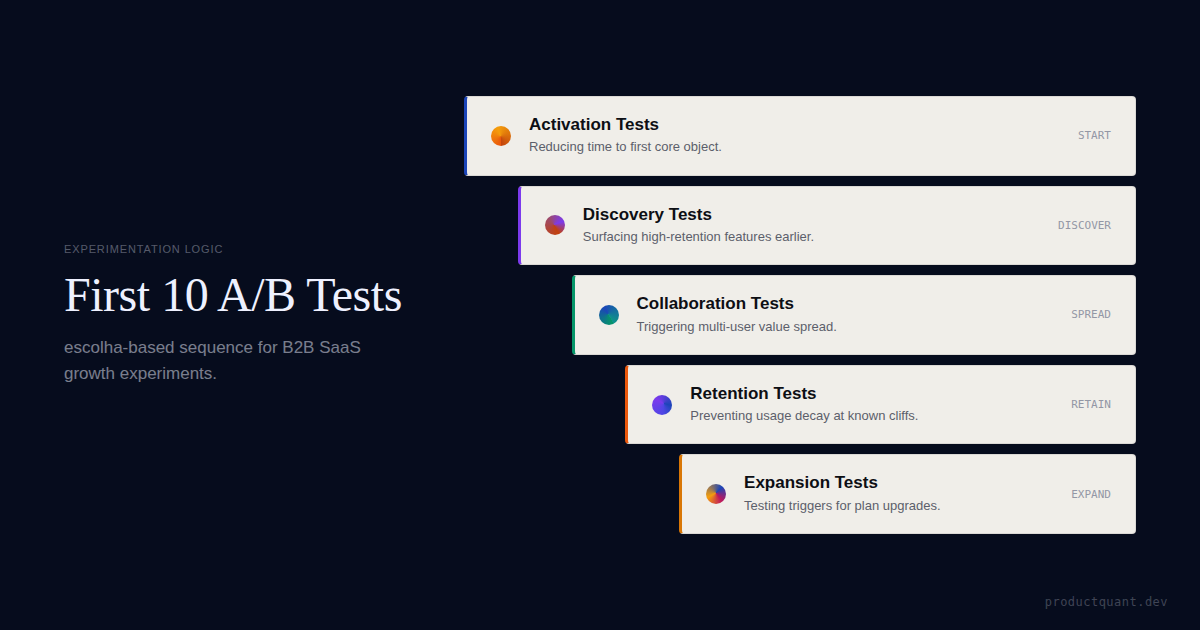
- Your first 10 experiments should be sequenced by constraint order — activation first, expansion last — not by idea novelty or stakeholder excitement.
- Every test needs a written hypothesis, one primary metric, guardrail metrics, an MDE threshold, and a pre-committed ship/kill/iterate rule. Without these five components, experiments produce motion, not learning.
- For teams with fewer than 500 weekly signups, sequential testing and session recording forensics can generate directional evidence before classical A/B tests are statistically viable.
- The goal of the first 10 tests is not just lift. It is to build an evidence chain the team can compound over time.
Why the First Experiments Usually Fail
When B2B SaaS teams decide to start A/B testing, they typically open their experimentation tool and pick the thing they most want to validate. That is usually a recent design change, a pricing page tweak, or a homepage headline that someone on the leadership team is curious about.
None of those are necessarily bad tests. The problem is sequencing.
If activation is broken — if a significant portion of new signups never reach the first moment of value — then tests on expansion prompts or checkout copy are measuring noise from a leaky funnel. The signal does not exist yet.
This is the core mistake in early-stage experimentation programs: the team conflates access to a testing tool with having an experimentation strategy. The tool is the infrastructure. The strategy is the sequence.
Sequencing experiments correctly also builds institutional trust. When the first two or three tests produce clear decisions — even negative results — the team develops confidence in the process.
When the first tests are picked haphazardly, results are ambiguous, and the program quietly dies before it has produced anything.
How to Sequence the First 10 Experiments
The fundamental rule: experiment on the earliest unresolved constraint in the value path before moving to later stages.
Experimenting on retention before activation is stable means you are measuring the noise of a leaky funnel. Experimenting on expansion before retention behavior is observable means your monetization signals are based on fragile usage patterns.

| Stage | What you are testing | Primary metric | Why it comes first |
|---|---|---|---|
| Activation (01–02) | Can users reach first value? | First Core Object Rate | Without stable activation, all later tests measure noise |
| Discovery (03–04) | Can users find the retained workflow? | High-Retention Feature Use Rate | Activation without discovery produces single-session users |
| Collaboration (05–06) | Do users spread and repeat usage? | Invite Sent Rate | Multi-user value compounds retention without added acquisition cost |
| Retention (07–08) | Which interventions prevent decay? | Week 2 Retention Rate | Only worth testing once behavioral patterns are observable |
| Expansion (09–10) | Which signals precede upgrades? | Expansion Intent (Clicks) | Monetization experiments sit on top of stable usage; test them last |
The sequencing discipline also prevents a second failure mode: running too many experiments at once. In B2B SaaS, where weekly signup volume is often 200–800 for a mid-market product, simultaneous tests compete for the same population, inflate each other's variance, and make interpretation nearly impossible.
One to three active tests is the healthy range for most teams before the experimentation infrastructure is mature.
How to Write a Hypothesis That Produces Learning
Before the 10 tests, there is a prerequisite: learning how to write a hypothesis that actually constrains a decision.
Most teams skip this and write something like "let's test the new onboarding flow and see what happens." That is not a hypothesis. That is curiosity without a decision rule.
A proper experimentation hypothesis has four parts:
- If we change [specific element] — the intervention, stated as precisely as possible
- Then [population] will [measurable action] — the behavioral change you expect to observe
- Because [mechanism] — the causal reasoning behind why the change would produce that outcome
- We will know this worked if [primary metric] moves by at least [MDE threshold] — the pre-committed decision criterion, set before the test runs
If we replace the generic empty-state placeholder with a contextual "Create your first [core object]" prompt tied to the user's stated goal during signup, then new users who selected "automate reporting" during setup will reach first core object creation within session one at a higher rate. Because users who state a specific goal during onboarding are in a task-completion mindset and respond better to action-specific prompts than to generic navigation. We will know this worked if First Core Object Rate for goal-selected users increases by at least 8 percentage points above baseline within 21 days.
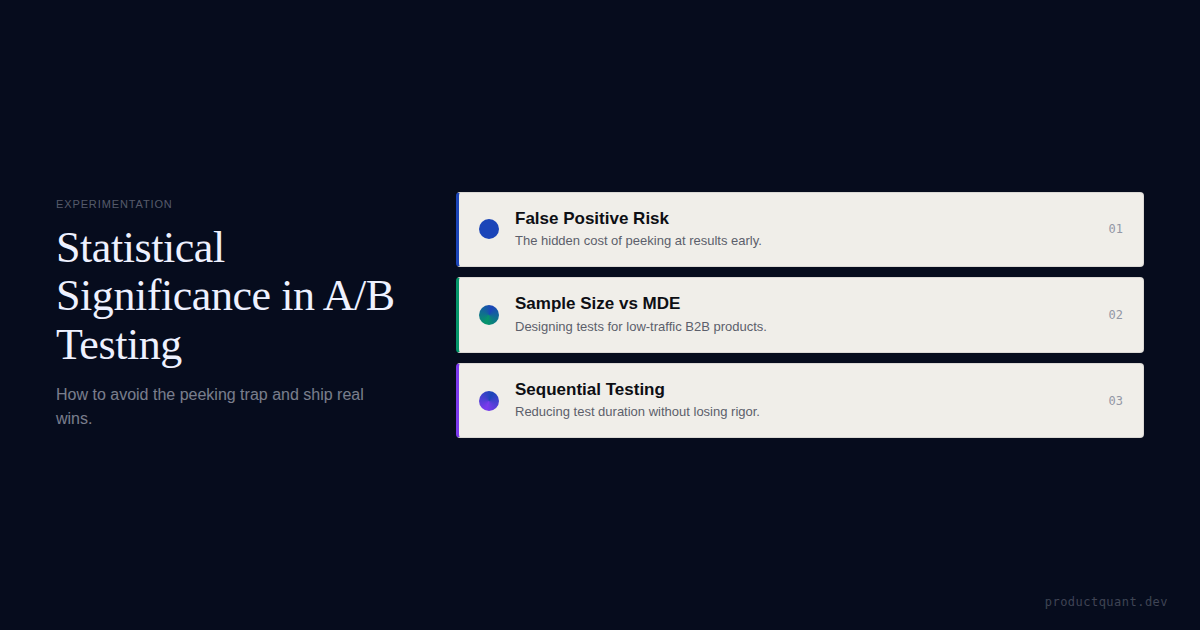
The Minimum Detectable Effect (MDE) threshold deserves particular attention in B2B SaaS. Because traffic is lower than in consumer products, it is tempting to run shorter tests and declare results.
Kohavi's research on controlled web experiments consistently shows that ignoring MDE is the leading cause of false-positive wins in smaller datasets — teams ship variants that look better but are not statistically distinguishable from chance.
Set your MDE before the experiment starts and do not move it afterward.
The First 10 A/B Tests Worth Running
Below are the 10 experiments structured in constraint order. For each test, the format covers what to test, the hypothesis logic, the primary metric, and a guardrail to watch.
These are not prescriptive: the specific change varies by product. What is prescriptive is the category and the measurement approach.
Reduce the path to first core object creation
The single most common activation problem in B2B SaaS: too many steps between signup and the first meaningful product action. Test whether a shortened, opinionated path to the first core object — removing optional fields, reducing choice, auto-populating defaults — increases the rate at which users complete that action in session one.
The hypothesis mechanism here is cognitive load reduction. Fewer decisions and fewer screens mean lower abandonment before the value moment.
This test is not about making onboarding shorter for its own sake — it is about removing friction that exists between the user's intent and the product's core function.
Replace generic onboarding with goal-based routing
B2B products typically serve multiple use cases. An HR platform used by a compliance manager, a finance director, and an operations lead involves three different first-value paths. Test whether routing users to a goal-specific onboarding flow — based on a single question at signup about their primary job or intent — increases activation versus the default single-track experience.
The mechanism is relevance. Users who see a workflow calibrated to their stated goal experience less cognitive dissonance between "what I came here to do" and "what the product is showing me right now."
Asana's early growth data, for instance, showed that users who created and completed a task with at least one collaborator had significantly higher week-4 retention than solo users — and goal-based routing was one lever they used to accelerate that path.
Surface the highest-retention feature earlier in onboarding
In most B2B products, there is one feature — sometimes two — that, when used in the first week, strongly predicts whether the account stays active at day 30. That feature is often not the one that new users discover first by default. Test whether navigational prominence, contextual prompts, or sequence reordering in onboarding increases discovery of this feature for new users.
To run this test cleanly, you need to have run the correlational analysis first: pull cohort data to identify which feature adoption in week 1 most strongly predicts week 4 retention.
Without that anchor, you risk promoting a feature that is merely popular, not sticky. The experiment is only as good as the feature selection that precedes it.
Simplify the first integration or connection step
For many B2B SaaS products, connecting a data source, CRM, or external service is the real activation moment — not account creation. If the product's full value requires an integration, test whether reducing the fields required, reordering the steps, or clarifying the value of the connection increases connected-account rate within the first session.
The integration abandonment funnel is often the steepest drop in B2B onboarding, and it rarely gets tested directly because engineers assume the complexity is unavoidable.
Sometimes it is. But often, optional fields snuck in over multiple release cycles, error messages are ambiguous, or the value of completing the connection is never stated. Each of those is testable without a platform rearchitecture.
Add the first collaboration trigger at the right moment
For multi-user B2B products, the transition from solo to collaborative usage is often the stickiness inflection point. An account using the product alone is at much higher churn risk than one where two or more team members are actively engaged. Test whether a contextual prompt — triggered at the moment a user completes their first high-value action — increases invitation sent rates.
The timing of the invite prompt matters as much as its presence. A prompt shown before the user has experienced value ("invite your teammates to join!") performs worse than one shown at the moment of first value delivery ("you just [completed X] — share this with your team").
This is the difference between an interruption and a natural next step.

Change the empty-state action hierarchy
Empty states are one of the highest-leverage and most consistently undertested surfaces in SaaS products. They appear at the moment users need direction most — and they typically point to product areas that are easy to explain rather than the ones most likely to create value. Test whether replacing the generic empty-state call-to-action with the single most activation-correlated action increases the rate at which that action is taken.
Run this test on the most important empty state first: the dashboard or home view on first login. The hypothesis is simple — a user who sees the one specific next step tied to their goal takes that step more often than a user who sees three generic options. Focus wins over choice in a low-context moment.
Test a lifecycle nudge tied to a specific behavior cliff
Once the activation and discovery layer is stable, the first retention test should not be a broad reactivation email. It should be a targeted intervention at a known behavioral cliff.
Pull your cohort data: at what point in the user journey does dropout accelerate? For most B2B SaaS products, this is somewhere between day 3 and day 14 — and it often correlates with a specific incomplete action (failing to complete a recurring workflow, not returning after the first session, not having invited a collaborator).
Test whether a single, behavior-triggered nudge — an in-app prompt, an email, a push notification — that fires at the point just before the cliff reduces dropout rate in that cohort.
The key word is "behavior-triggered." Nudges tied to time elapsed underperform nudges tied to behavioral state. "You haven't logged in for 5 days" loses to "You created a project but haven't assigned a task yet."
Compare assist models for stalled accounts
Some accounts stall at a known adoption milestone and do not respond to automated nudges. Test whether different assist models — pure self-serve (no intervention), automated in-app flow (guide or checklist), human outreach (a CS message), or a hybrid — produce different outcomes for this population.
This is one of the few tests in this list where the result has direct budget implications. If human outreach produces significantly better adoption at acceptable cost, that is a staffing and process argument. If the automated flow matches human outreach, that is a case for investment in in-app experience rather than headcount.
The test does not just tell you what works — it tells you where to allocate.
Test plan exposure at demonstrated value moments
Pricing experiments belong late in the sequence — once you understand which usage patterns predict retained value. When that understanding exists, test whether plan upgrade prompts are more effective when triggered by specific product events (hitting a usage threshold, accessing an advanced feature, adding a collaborator) compared to time-based triggers (day 14 of trial) or page-visit triggers (pricing page visit).
The hypothesis is that contextual relevance increases conversion. A prompt that says "you've analyzed 3 datasets this week — upgrade to unlock unlimited" is more compelling than "your trial ends in 7 days" because it grounds the upgrade value in demonstrated behavior rather than abstract timeline pressure.
Test this against whatever your current default trigger is.
Test workflow packaging versus feature fragmentation
Once the earlier layers are stable, the final test addresses whether users engage more deeply with product capabilities when those capabilities are surfaced as a packaged workflow versus left fragmented across the navigation. Test whether a guided checklist, template library, or structured workflow path increases repeated use of multiple product capabilities compared to leaving users to discover the sequence themselves.
This is sometimes called "experience packaging." It matters in B2B because the product's full value is often spread across many features that users only discover over time. Structured packaging compresses that discovery curve.
The test is simple: control gets the status quo; variant gets a guided workflow pathway for a specific job. Measure whether the variant group uses more features and returns more often.
If experiments 1 through 4 are skipped, tests 7 through 10 frequently produce inconclusive results — because the behavioral system those later tests are meant to influence has not been stabilized by the earlier work. Inconclusive results from a skipped prerequisite look identical to a failed hypothesis. Teams waste months chasing the wrong problem.
The Five Non-Negotiable Components of Every Experiment
Beyond the sequencing, the structure of each individual test determines whether it produces genuine learning or theater.
In B2B SaaS, where traffic is often lower than in consumer products, weak test structure is especially costly: an underpowered test wastes 3–4 weeks and produces a "neutral" result that paralyzes the team's next decision.
Every experiment — regardless of where it sits in the sequence — should include these five components before it launches:
- Written hypothesis: If [change], then [population] will [action], because [mechanism]. This is documented before a single line of code ships.
- One primary metric: The metric directly downstream of the change being made. If you change the invite prompt, the primary metric is invite sent rate — not global retention, not revenue. Testing everything means learning nothing.
- Guardrail metrics: Two to four secondary signals that monitor for unintended damage. A lift in invites sent that comes with a spike in spam reports is not a win. Guardrails are the conditions under which a positive primary result still gets killed.
- Minimum Detectable Effect threshold: The smallest real difference you are willing to act on. This is set before the test, based on your business context. It determines sample size. If you do not set it, you will stop tests whenever the result looks good, which inflates false positives significantly.
- Pre-committed ship/kill/iterate rule: Written before the test starts. What action will be taken based on the primary and guardrail results? If the team can reinterpret the outcome after seeing the data, the test did not constrain a decision — it just generated a story to fit whatever happened.
Get the experiment tracker and hypothesis template
The tracker helps rank your first 10 experiments by constraint order and expected impact. The hypothesis template enforces one primary metric, guardrails, MDE, and a pre-committed decision rule before anything ships.
What Not to Test First: Four Strategic Traps
The graveyard of B2B experimentation programs is filled with tests that were technically executed but strategically misplaced. These four traps account for most wasted experiment cycles in the first year.
Trap 1: Homepage or brand copy tests before the post-signup funnel is understood
If the primary source of growth is intent-heavy search and direct referral, changing homepage copy rarely shifts economics. The people who find you through high-intent queries already know roughly what you do. The more important question is whether they activate after they sign up. Homepage tests belong in the experimentation roadmap eventually — but not before the activation layer is stable.
Trap 2: Pricing page experiments before usage patterns are mapped
Pricing tests matter and should eventually run. But if the team does not yet understand which product behaviors predict retained value, monetization experiments optimize on a broken signal.
A trial-to-paid conversion lift that comes from users who later churn at high rates is not a win — it is a retention tax disguised as a conversion win. Run pricing experiments after tests 1 through 6 have produced stable behavioral baselines.
Trap 3: Many micro-optimizations running simultaneously
Local friction tests — button colors, field labels, icon positions, copy tweaks — have their place in a mature experimentation program. They do not belong in the first 10. With limited traffic and a team still building testing discipline, micro-tests compete for sample size without moving the business trajectory. Each of the 10 tests in this playbook targets a structural behavior that, if shifted, produces downstream effects. Micro-tests do not.
Trap 4: Experiments without a maintained backlog
A test finishes. The team looks around and asks "what should we test next?" This is where experiment selection gets political again.
The solution is a scored, maintained backlog using a framework like RICE (Reach, Impact, Confidence, Effort) with an added constraint-alignment check: does this test address the current highest-value bottleneck in the funnel?
A good backlog is 15–20 scored, pruned candidates — not a 200-item idea dump.
Low-Traffic Alternatives for Early-Stage B2B Teams
If you have fewer than 500 weekly signups, classical A/B testing will take too long to reach statistical significance on most behavioral metrics. These alternatives generate directional evidence in the meantime:
- Sequential testing: Deploy the change to 100% of users and measure against the prior 4-week baseline, controlling for seasonality. Not as clean as an RCT, but useful for decisions that cannot wait.
- Archetype interviews: Show the variant to 8–10 users in your target segment. If 7 out of 8 misread the same element or abandon at the same step, you have directional evidence that does not require a p-value.
- Session recording forensics: Compare the first 100 sessions on the variant against the previous 100 on the control. Look for rage clicks, unexpected abandonment, and hesitation patterns. Not statistically rigorous, but faster than waiting for significance on low traffic.
- Bayesian testing: If your experimentation platform supports Bayesian inference, you can make decisions with smaller sample sizes by accepting wider credible intervals — a useful trade-off for teams where speed of learning matters more than statistical precision.
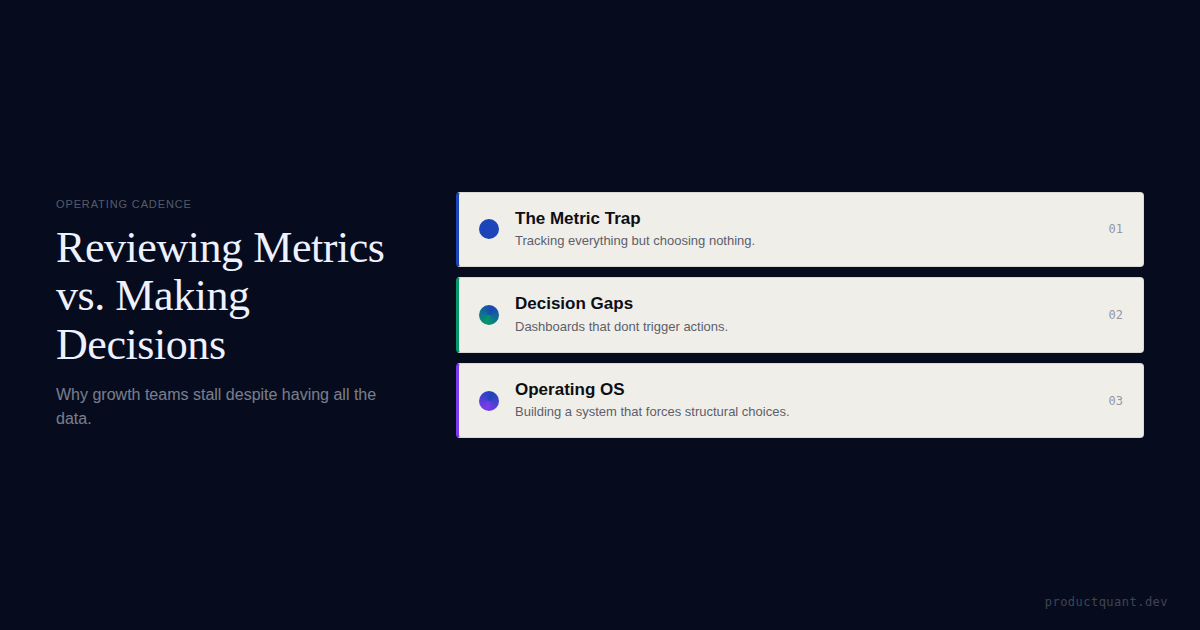
Experiments only matter if the review system closes the loop
Good tests still get wasted when the team never turns results into an explicit next decision. The review cadence is the operating system that makes experimentation compound.
Experiment Velocity and Decision Density
A common question after finishing the first few tests is: how many experiments should we be running? Optimizely's research across large-scale experimentation programs suggests that high-growth SaaS teams run an average of 2.4 experiments per product squad per month. That is a reasonable north-star benchmark.
But velocity without decision density is a vanity metric. Decision density means that each experiment ends with a documented decision: shipped, killed, or iterated — with the reasoning recorded.
If 70% of experiments end in "we'll think about it," velocity is irrelevant. The team is producing experiment reports, not product decisions.
In B2B SaaS, because of lower traffic and longer sales cycles, the median experiment duration is 14–21 days. Running tests faster than that means measuring behavioral noise rather than stable signal.
The practical target for most B2B product teams in year one of experimentation is not speed — it is a 100% pre-registration rate, where every product change is documented with a hypothesis and a metric before it reaches production. That discipline, more than velocity, is what makes an experimentation program compound.
The minimum test duration for most B2B SaaS behavioral experiments, covering two full business cycles. Stopping earlier dramatically inflates false-positive rates — a test that looks significant at day 7 has a much higher probability of reversing by day 21.
Frequently Asked Questions
What if the team does not yet have enough traffic for classical A/B tests?
You can still run structured experiments. The point is not the label — it is the discipline. Use a defined hypothesis, a clear primary metric, a fixed population, and a real decision rule. Sequential testing, session recording forensics, archetype interviews, and Bayesian inference all generate directional evidence at lower traffic volumes. The goal is to make product decisions on evidence rather than intuition, even when that evidence is imperfect.
Should the first experiment always target activation?
Usually, but not always. If activation is already strong — consistently above the benchmark for your product category — and the clear bottleneck is feature discovery, collaboration adoption, or expansion behavior, start there. The right first test follows the current highest-value constraint, not a predetermined category. Diagnose first; sequence second.
How many experiments should run at once?
For most B2B SaaS teams in year one of experimentation, one to three active tests is the right range. Overlapping tests compete for the same user population, inflate each other's variance, and make interpretation difficult. As infrastructure matures and traffic grows, that ceiling rises — but concurrent testing requires sophisticated assignment logic and analysis that most early-stage programs do not yet have.
What makes an experiment backlog good?
A good backlog is scored, pruned regularly, and balanced across the funnel. It is maintained as a live document — not a historical archive of ideas. Aim for 15–20 scored candidates, re-evaluated after each experiment completes. Remove tests that no longer address the current constraint. A 200-item backlog is not a strategy; it is an unprocessed list.
What is the minimum detectable effect and why does it matter?
The minimum detectable effect (MDE) is the smallest difference in your primary metric between control and variant that you would act on. Setting it before the test determines how much traffic you need and how long to run the experiment. Teams that ignore MDE stop tests whenever the result looks good — which dramatically increases false-positive rates. In B2B SaaS with low traffic, an underpowered test that ends early is one of the most common sources of confident-but-wrong decisions.
How long should a B2B SaaS A/B test run?
A minimum of two full business cycles — typically 14 to 21 days — to account for day-of-week behavioral patterns. For products with lower signup volume, 3 to 4 weeks is common. Never stop a test early because an interim result looks compelling. Peeking at interim results and stopping on significance is one of the documented causes of inflated false-positive rates in experimentation research.
Sources
- Statsig: B2B SaaS Experimentation Strategies
- Statsig: Onboarding for Growth with A/B Tests
- VWO: How to Calculate A/B Test Sample Size
- Ron Kohavi: Practical Guide to Controlled Experiments on the Web
- GuessTheTest: Calculating Sample Size in A/B Testing
- Understory: A/B Testing — What Really Matters for SaaS Growth
- ProductQuant: Growth Metrics vs. Decisions
- ProductQuant: Activation Definitions — How to Operationalize Them
Free tools: Calculate your required sample size before every test → Sample Size Calculator · Check if your results are statistically significant → Statistical Significance Calculator

About the Author
Jake McMahon writes about growth operating systems, product analytics, and the structural reasons B2B SaaS experimentation programs stall. ProductQuant helps teams build a cumulative evidence chain that actually improves activation, retention, and expansion — rather than producing quarterly experiment reports that sit unread.
Related reading
If the first 10 tests do not build an evidence chain, they are just motion.
The real goal is a system where each experiment clarifies what should happen next — instead of sending the team back to intuition after every result.