
TL;DR
- Most churn models fail because they predict cancellation, not disengagement. By the time a customer cancels, the decision was made 30-60 days earlier.
- The strongest signals are behavioral, not demographic. Login frequency drops, core feature abandonment, and champion departure predict churn weeks before exit surveys fire.
- SaaS Capital's 2025 data shows median gross retention at 92% for bootstrapped companies. The 90th percentile reaches 98%. The gap is not effort — it is signal quality.
- A usable churn model needs three things: events that fire before the decision, lead time to intervene, and a clear action for each signal tier.

The Churn Model Nobody Uses
Every B2B SaaS company at some point decides it needs a predictive churn model. The data team builds one. It produces a score. The score goes into a dashboard. Nobody looks at it.
The model usually fails for one of three reasons:
- It predicts cancellation, not disengagement. By the time the model flags a customer as at-risk, they have already stopped using the product. The CS team gets a notification about a decision that was made weeks ago.
- It uses demographic features, not behavioral ones. Company size, plan tier, and tenure are weak predictors. What matters is what the customer did — or stopped doing — in the product.
- It produces a score with no action attached. A churn probability of 73% tells the CS team nothing about what to do differently. The score is informative but not actionable.
Research on subscription businesses confirms this pattern. A 2025 study in the International Journal of Science and Research Archive found that behavioral ML models consistently outperform self-reported and demographic signals in predicting churn — because behavior captures the decision as it forms, not after it is finalized.
The question is not "which algorithm predicts churn best?" It is "which signals fire early enough to do something about it?"
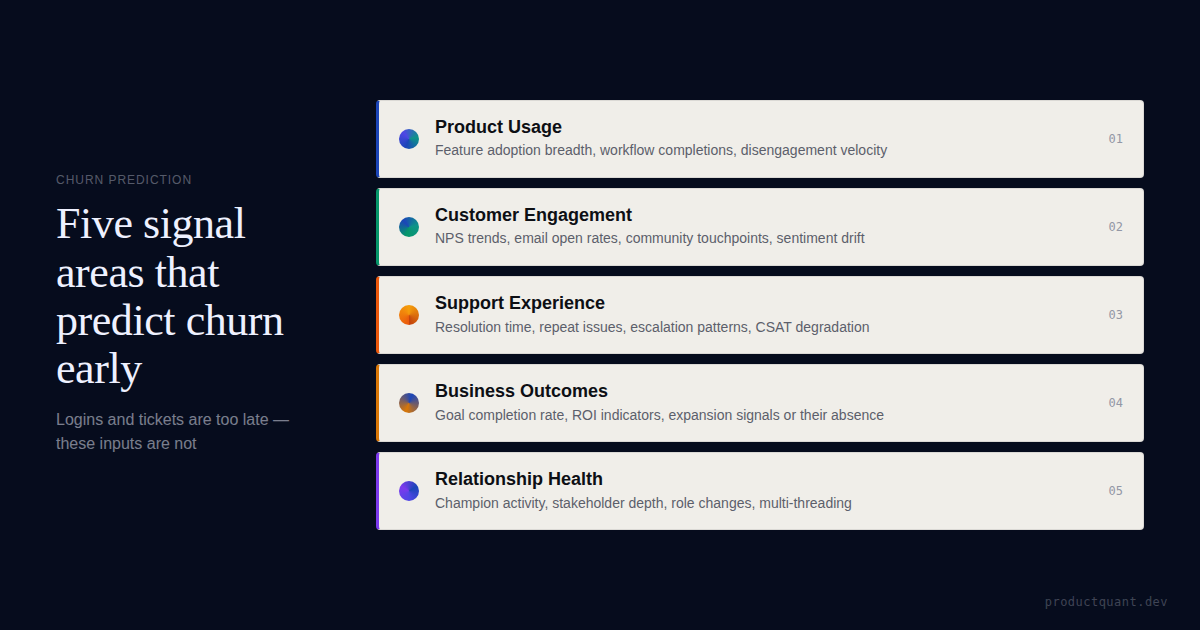
The Five Signals That Actually Predict Churn
Across B2B SaaS companies at $5M-$20M ARR, five behavioral signals consistently appear before the cancellation event. Each fires with enough lead time to allow intervention.
Signal 1: Login frequency drop of 40% or more over 30 days
A user who was logging in five times per week drops to two or three. The drop does not happen because the user decided to cancel. It happens because the product is no longer central to their workflow.
Login frequency decline precedes the cancellation decision. It is the early signal that the user is mentally stepping back.
Lead time: commonly 4-8 weeks before cancellation. Appears earlier for users who were highly active before disengaging.
Signal 2: Core feature unused for 14 or more days after prior regular use
The core feature — the specific action that delivers the product's primary value — goes unused by a previously active user.
This is not a user who never adopted the feature. It is a user who adopted it and stopped. That reversal is the clearest available signal of genuine disengagement.
Lead time: typically 3-6 weeks before cancellation.
Signal 3: Primary user stopped logging in with no secondary user activity
For B2B accounts, the champion — the user who drove adoption, trained teammates, and owns the relationship with the product — stops logging in. No secondary user has picked up activity. The account is dark.
This is the champion-left signal, and it is one of the strongest predictors of account-level churn in multi-seat products.
Lead time: the account is typically at risk from the day the champion login stops. Intervention window is commonly 7-14 days.
Signal 4: Data export and integrations page visited in the same week
A user visits the integrations or connections page and also triggers a data export event in the same 7-day window.
This combination is a strong signal of competitor evaluation: the user is assessing how to extract their data and what the product connects to — the questions you ask when you are considering switching.
Lead time: commonly 2-4 weeks before cancellation for competitor-switch churn.
Signal 5: Support ticket volume increased, then stopped entirely
An account that was submitting regular support tickets goes silent — not because the issues were resolved, but because the user stopped trying to fix them. This is the "gave up" signal.
An account that engaged with support for months and then went quiet is more likely to have mentally abandoned the product than to have resolved all friction. The silence is the signal.
Lead time: ticket silence typically begins 3-5 weeks before cancellation in accounts where friction was the primary churn driver.
Why Most Churn Models Miss These Signals
The gap between what predicts churn and what most models actually measure is a data architecture problem, not an algorithm problem.
Most companies track billing events, not usage events
The billing system knows when a renewal is due, when a payment fails, and when a customer downgrades. It does not know whether the customer logged in this week, whether the core feature was used, or whether the champion left the company.
Churn models built on billing data alone can only predict what has already happened commercially. They cannot predict what is happening behaviorally.
Most models use aggregate features, not individual ones
A model that uses "average weekly logins for the account" misses the signal that matters: the champion stopped logging in, and nobody else picked up the slack. Account-level aggregates smooth away the individual behavior changes that predict churn.
Most scores have no intervention mapped to them
A churn score of 0.73 is information. It is not a workflow. The CS team needs to know: who do I contact, what do I say, and what action do I take?
The model that produces the most accurate prediction is not the most useful model. The model that produces the most actionable signal is.
The median gross revenue retention for bootstrapped SaaS companies at $3M-$20M ARR is 92%. The 90th percentile reaches 98%. The gap between these cohorts is not CS effort — it is signal quality and intervention timing.
What a Usable Churn Model Actually Looks Like
A churn model that CS teams actually use has three layers:
Layer 1: The signal definition
Each signal is defined as a specific behavioral pattern, not a probability score. "Champion login frequency dropped to zero for 7+ days with no secondary user activity" is a signal the CS team can understand and act on. "Churn probability: 0.73" is not.
Layer 2: The lead time
Each signal is tagged with its typical lead time before cancellation. Signals with 4-8 weeks of lead time trigger a different intervention than signals with 7-14 days. The urgency of the response should match the urgency of the signal.
Layer 3: The intervention map
Each signal tier maps to a specific action:
- Early signals (4-8 weeks out): CS reaches out with a check-in, not a retention play. The goal is to understand whether the disengagement is seasonal, structural, or competitive.
- Mid signals (2-4 weeks out): If competitor evaluation signals fire (export + integrations), the response is proactive positioning — not defensive discounting.
- Late signals (7-14 days out): If the champion-left signal fires, the response is account-level: identify the new champion, re-establish value, and prevent the dark-account spiral.
| Signal | Lead time | Intervention |
|---|---|---|
| Login frequency drop ≥ 40% | 4-8 weeks | CS check-in: is this seasonal or structural? |
| Core feature unused 14+ days | 3-6 weeks | Re-onboarding: has the use case changed? |
| Champion departure, no secondary | 7-14 days | Identify new champion, re-establish value |
| Export + integrations in same week | 2-4 weeks | Proactive positioning, not defensive discounting |
| Support tickets spike then stop | 3-5 weeks | Direct outreach: "We noticed things went quiet" |
How to Build This Against Your Own Data
The architecture for a behavioral churn model is simpler than most data teams expect. It does not require graph transformers or deep survival networks. It requires event tracking, cohort logic, and a dashboard that surfaces signals.
Step 1: Define your core feature event
Every product has one action that delivers the primary value. For an analytics tool, it might be "dashboard viewed." For a collaboration tool, "message sent." If you cannot name this event, you cannot build a churn model.
Step 2: Track champion identity at the account level
In B2B SaaS, the person who drives adoption is usually not the same as the person who renews the contract. You need to know who the champion is at the account level. The simplest definition: the user with the highest session count over the trailing 30 days.
Step 3: Build cohorts for each signal
Each signal is a cohort query. In PostHog, this looks like:
- Declining engagement cohort: users who were active in the 14-44 day window and have not been active in the last 14 days.
- At-risk activation cohort: users past day 7 who have not completed the core activation event.
- Competitor research cohort: users who triggered both the integrations page view and a data export event within any 7-day window.
Step 4: Surface signals in a CS-facing dashboard
The output is not a score. It is a list: which accounts have which signals, when did the signal fire, and what is the recommended intervention? The dashboard should be updated daily and reviewed weekly.
Build the early warning system against your own data
Define the behavioral signals that matter for your specific churn mix, build the cohorts, and map the interventions to each signal tier.
FAQ
Do I need a machine learning model to predict churn?
No. The five signals described above are rule-based cohort definitions, not ML models. They are simpler to build, easier to explain to CS teams, and usually more actionable than a black-box probability score. ML becomes useful when you have enough historical churn data to validate which signal combinations are most predictive for your specific product.
How far in advance can churn actually be predicted?
Behavioral signals commonly appear 30-60 days before the cancellation event fires. The earliest signals (login frequency drops, feature abandonment) tend to fire first. The latest signals (champion departure, export activity) fire closer to the decision. The window between signal and cancellation is where intervention is possible.
What if our product does not have event-level tracking?
Without event tracking, the behavioral signals described here are not available. Session frequency from server logs can serve as a rough proxy for login frequency drops, and support ticket data can surface the "gave up" signal. But the highest-signal indicators require event instrumentation. An analytics audit to define and implement the right tracking plan is typically the prerequisite step.
Should we build this in-house or buy a churn prediction tool?
If your team already has product analytics infrastructure (PostHog, Amplitude, Mixpanel), building rule-based cohorts is straightforward and costs nothing beyond engineering time. Third-party churn tools often require additional data pipelines and may not understand your product's specific core feature event. Start with cohorts. Add ML later if the data supports it.
Sources
- Bello, Ajibade & Ekweli: Predicting customer churn in subscription-based businesses using machine learning (2025) — behavioral ML models outperform self-reported signals
- Imani, Joudaki & Beikmohammadi: Customer Churn Prediction — A Systematic Review of Recent Advances (2025)
- SaaS Capital: 2025 Benchmarking Metrics for Bootstrapped SaaS Companies — GRR 92% median, 98% 90th percentile
- Paddle: Customer Exit Surveys — limitations of exit surveys and what they can and cannot tell you
Free tool: Plot your retention curve against SaaS benchmarks → Cohort Retention Calculator

About the Author
Jake McMahon writes about analytics architecture, product instrumentation, and the decisions B2B SaaS teams make when building their data foundations. ProductQuant helps teams design what to instrument, set it up correctly the first time, and connect analytics to decisions that affect revenue.
Related reading


Stop reading the rationalisation. Start reading the behaviour.
The Churn Analysis & Prevention cohort builds the behavioural early warning system against your own product data — so you see the decision forming, not the cancellation form being submitted.