Retainers
The Foundation
Growth LAB
Growth OS
Diagnostics & Sprints
Analytics Audit
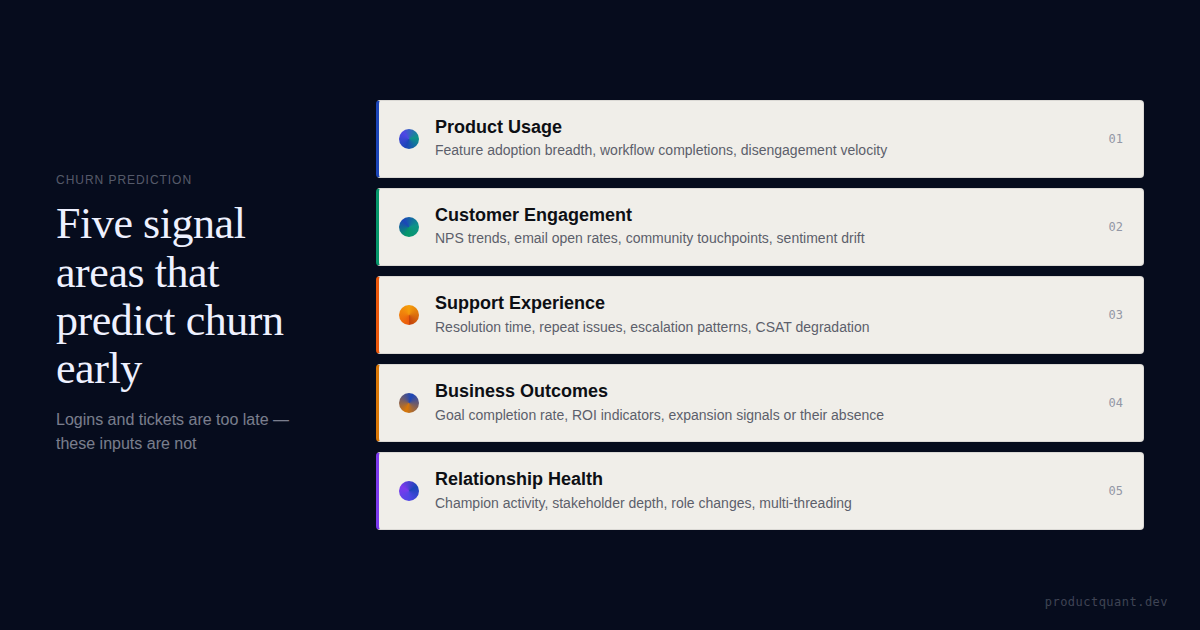
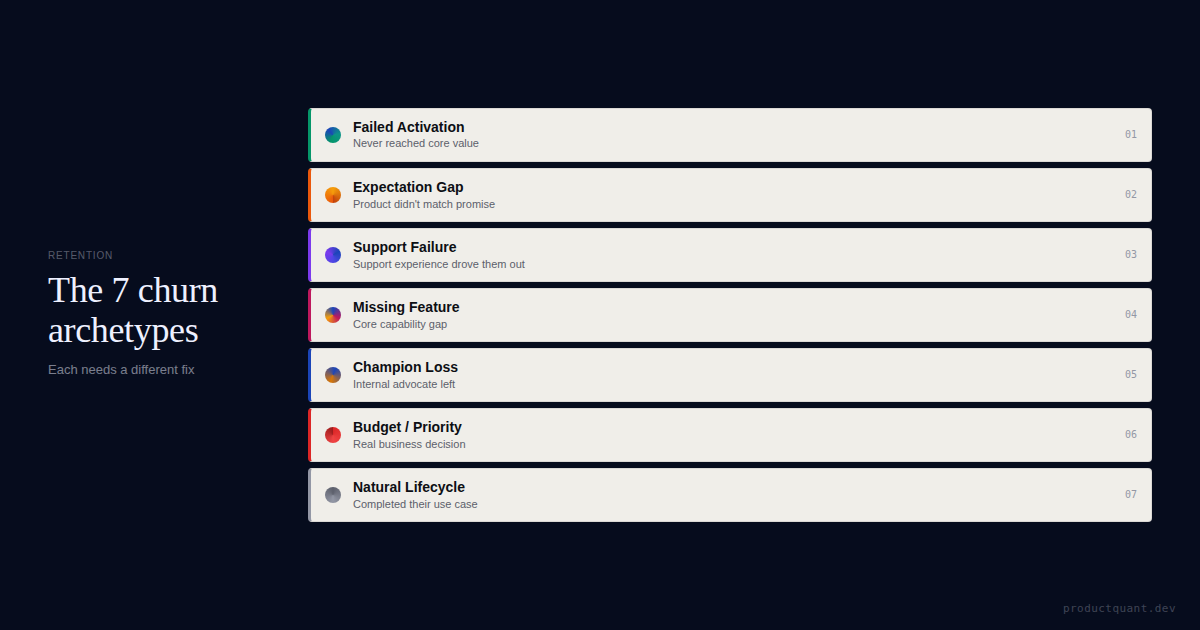
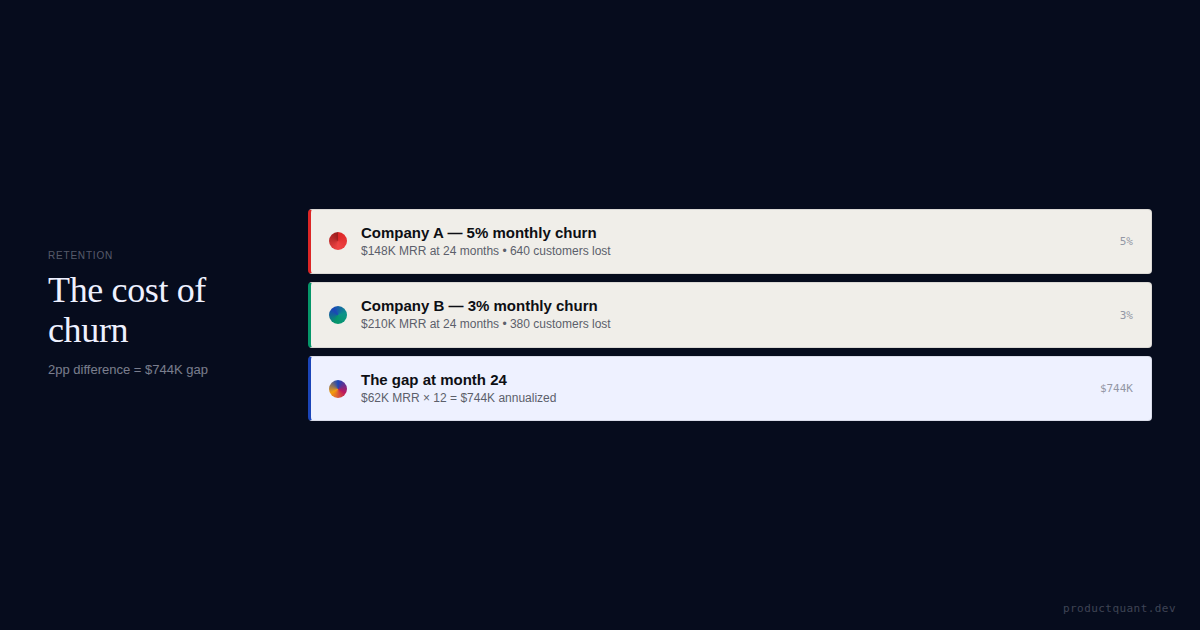
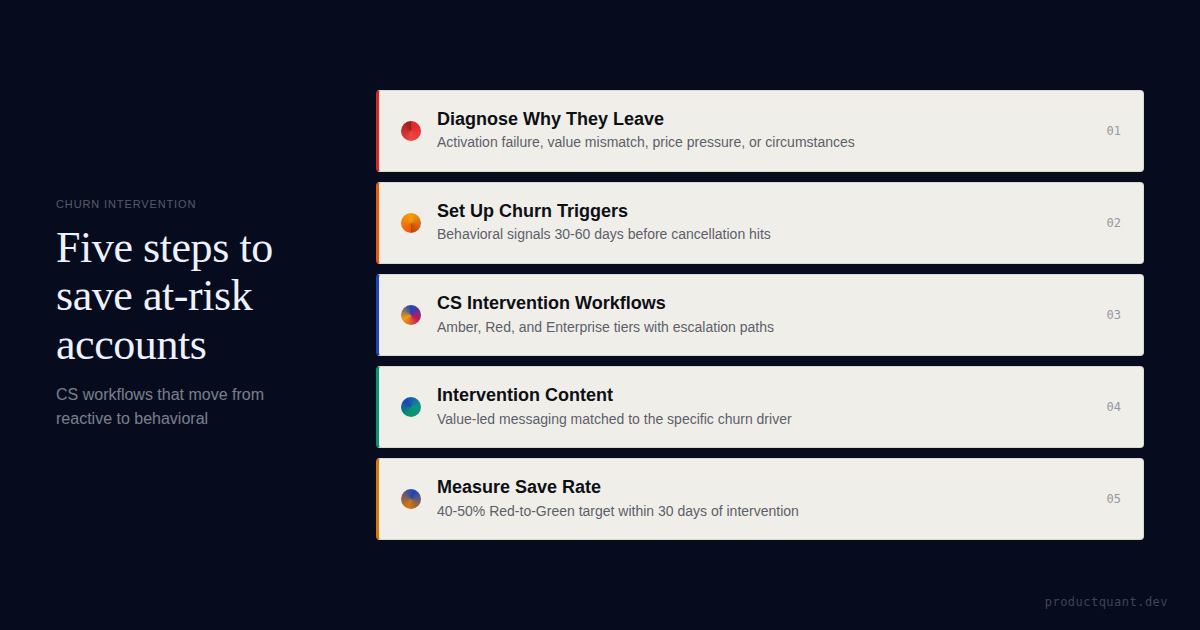
Churn Prediction
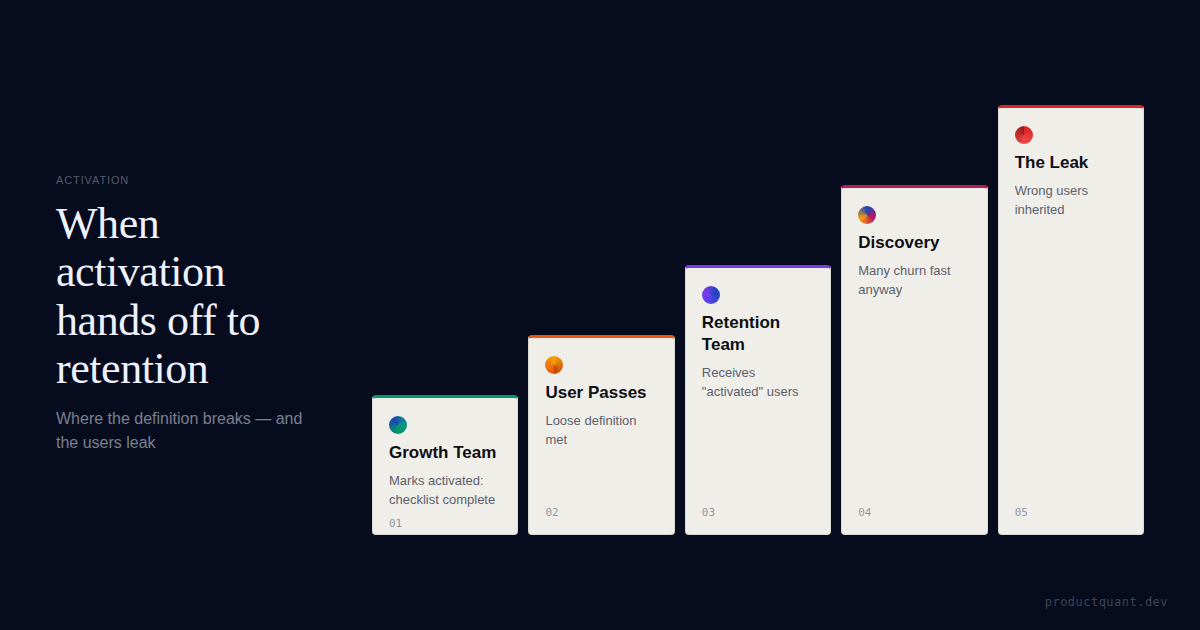
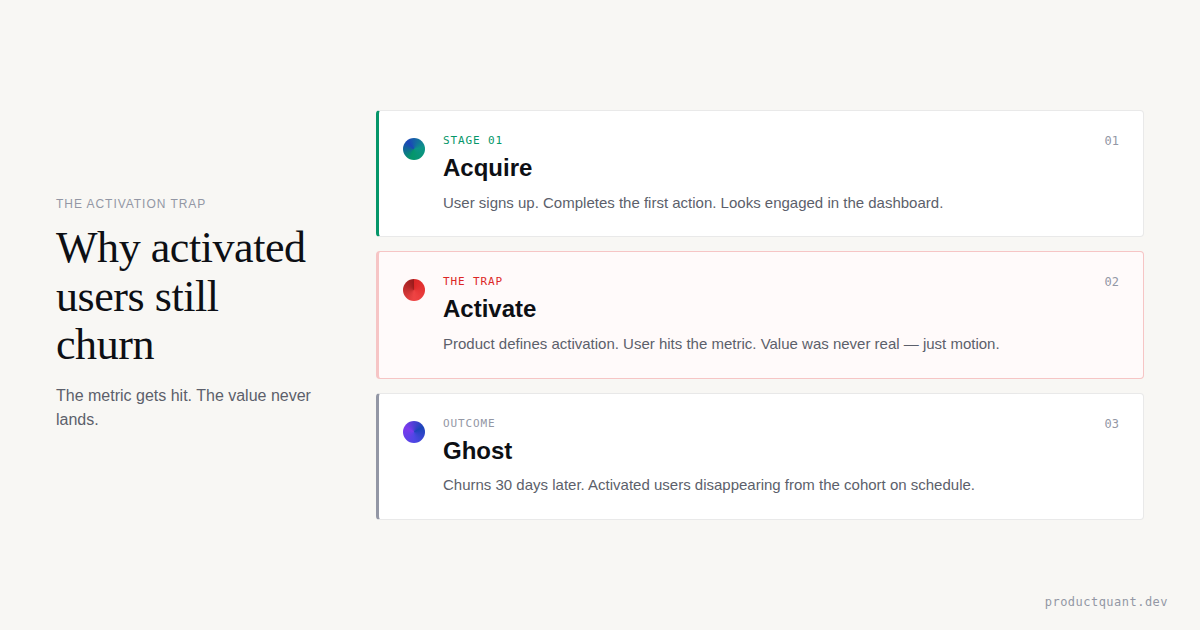
Activation Deep Dive
Pricing Audit
Focused Sprint
Onboarding Review
Experiment Velocity
Tool Sprints
PostHog Setup
Chameleon Flows
A/B Testing + ML
Stripe & RFM
Launch Packages
AI Feature Launch
Feature Launch Intelligence
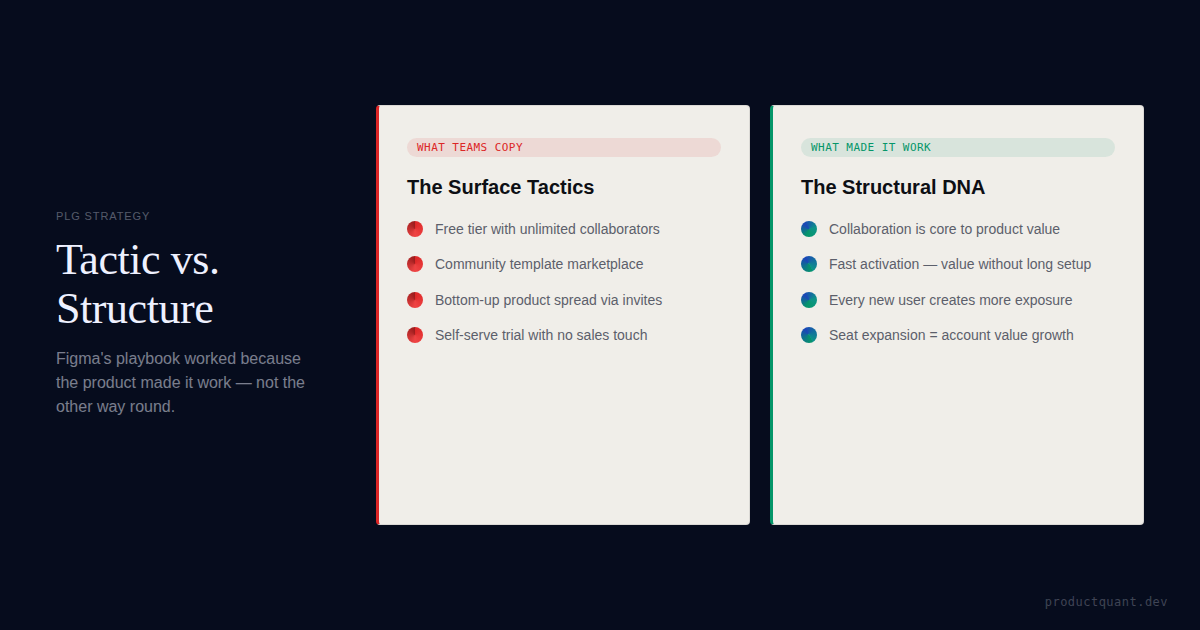
PLG Motion Sprint
Fundraise Readiness
PMF + GTM + Launch
App Launch Sprint
Experiment Program
Case Studies
Healthcare SaaS
E-commerce SaaS
View all →
Results
Results
Compare
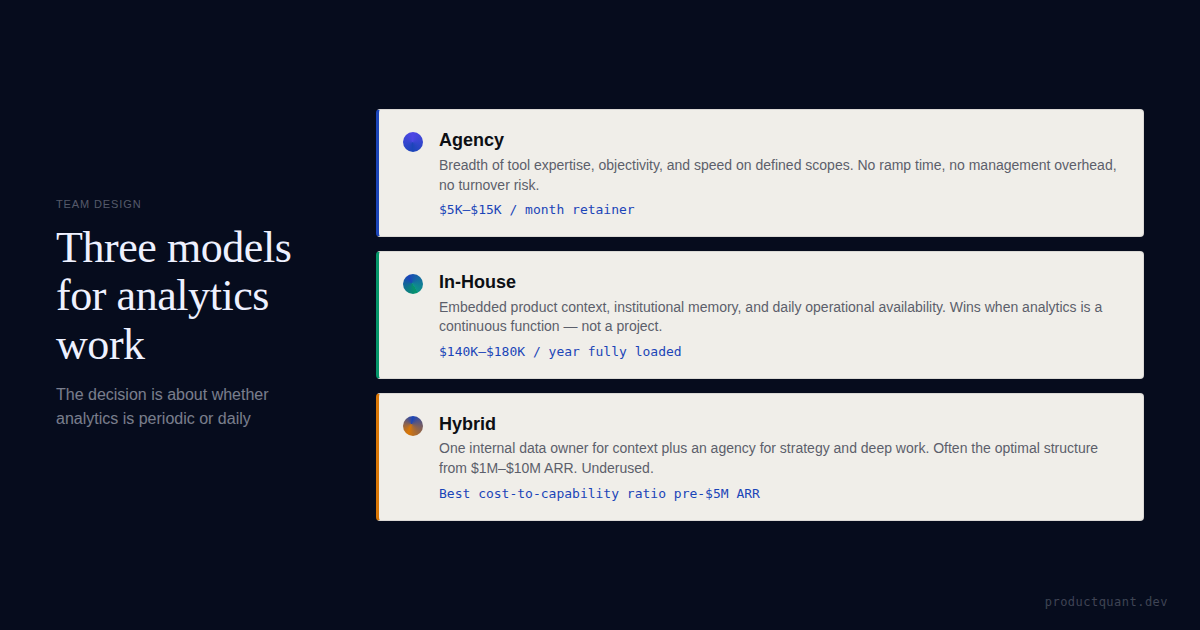
vs Hiring In-House
vs Agency
vs Fractional